50.3k
50.3k
In July 2026, Mat Duggan and Charity Majors each published posts arguing that "ClickHouse is winning the observability wars". Neither were prompted by us; we were flattered to read them, and a little surprised by how widely the idea traveled.
Obviously, we appreciate the compliment, but we wanted to take a moment to look at why two experienced observability practitioners and leaders in the space felt compelled to make the case in public, based on what they had seen in production.
Which part of the observability stack is ClickHouse winning? Why has it become such a common choice there? And when is it not the right answer? And where do we need to focus for it to remain such a compelling choice?
We’re excited that ClickHouse is helping more and more teams improve their observability capabilities while reducing costs. But, in the words of Lewis Hamilton, since I’m a huge F1 fan - “we still have unfinished business”.
What does "winning" even mean?
Both Mat and Charity ultimately focus on the storage and query layer, which narrows any definition of “winning”, with this representing only one facet of the observability problem. Collection, schema design, correlation, visualization, alerting, and investigation workflows, plus the experience wrapped around them, still have to be built. A good engine creates the foundation, but it does not make the product decisions or how you treat and think of telemetry.
To Charity’s point:
"A better storage engine can’t beat bad architecture"
At the storage layer, ClickHouse has become the default choice for many engineering teams building their own observability systems. Teams at Netflix, Anthropic, and OpenAI use it to store and query telemetry at scale, particularly logs and traces.
|
“ClickHouse played an instrumental role in helping us develop and ship Claude 4. With ClickHouse, the database is green, queries are lightning-fast, and money is not on fire. ClickHouse has already delivered significant value in helping us create state-of-the-art language models.” Anthropic |
“Data in ClickHouse is better than data anywhere else. No other system lets you slice and dice your data, ask interesting questions, and get answers in an acceptable amount of time. There’s nothing out there that competes with ClickHouse.” Tesla |
“A lot of our peer companies are using ClickHouse for this exact use case (observability). It’s battle-tested and just the right tool for the job.” OpenAI |
Likewise, many observability SaaS companies build products on top of ClickHouse, owning the interface, workflows, and product decisions while using it as the engine.
These products serve different users and do not all share the same philosophy. Some are designed around rich, wide events; others retain familiar experiences organized around logs, metrics, and traces. Their common ground is ClickHouse’s columnar architecture, which suits the shape and access patterns of telemetry.
We agree with Charity that observability data is often more useful as rich, wide events than as separate signals. Keeping context together preserves relationships, avoids duplicating information across formats, and lets teams derive views when questions arise. But many teams already have instrumentation, schemas, and workflows built around logs, traces, and metrics. They should not have to remodel their telemetry to benefit from ClickHouse.
ClickHouse also works well with conventional logs and traces. Production logs are often structured, wide, and high cardinality - after all, are wide events anything more than structured logs with metrics? Even free-form messages contain repeated tokens and templates that compress well when ordered together. Trace spans already resemble wide events: structured records containing timestamps, durations, identifiers, attributes, and status.
ClickStack takes the same practical approach. It combines ClickHouse, an OpenTelemetry Collector, and the ClickStack UI, embracing wide events while accepting the logs, traces, and metrics teams already collect. Users can retain familiar workflows without giving up the ability to correlate and query those signals as data.
Products can make different decisions about signals, schemas, and workflows while reaching the same conclusion about storage. ClickHouse has proven itself as a storage and query engine across both models.
So if "winning" means becoming the de facto storage and query layer for teams building observability systems on this model, then maybe yes.
Get started today
We’re building ClickStack Cloud, a turnkey observability platform for humans and agents with the performance and economics of ClickHouse. Join the private preview and be among the first to try it!
Join the waitlistWhy is ClickHouse so well-suited to the storage layer?
ClickHouse is fundamentally well-suited to observability because it is a columnar database. Wide events, log records, and trace spans may represent different philosophies or signal types, but they share the properties of analytical data: many fields per record, large volumes, and queries that usually inspect or aggregate only a subset of those fields.
In a row-oriented database, the values belonging to one record are stored together. A columnar database stores the values for each field together instead. The timestamps sit with other timestamps, service names with other service names, and durations with other durations. That layout matches observability queries, which often scan a few fields across millions or billions of events.
This conclusion is not unique to ClickHouse. Honeycomb reached it early, building Retriever, its own distributed column store, around rich, wide events. Datadog reached a similar architectural conclusion with Husky, the columnar event store it introduced in 2022 for logs and other event data. Their product models differ - Honeycomb argues for keeping context together in wide events, while Datadog continues to offer familiar experiences organized around metrics, logs, and traces. At the storage layer, however, both arrived at columns.
So why is a columnar architecture so well suited to observability data?
The benefits start on disk. Within each data part, rows are sorted by the table’s ordering key, and each column is stored separately. When the ordering key reflects the main access patterns, similar values are placed close together. Dictionary, delta, and run-length encodings can then reduce the data before general-purpose compression is applied, which itself benefits from contiguous data values.
These compression benefits are often one of the first things that users of ClickHouse for observability call out:
"I was genuinely impressed by the compression we achieved with ClickHouse. Some columns gave us 10x, others 20x - even up to 50x in some cases."
Character.AI
"We ingest up to 3 million rows per second using just 20 CPU cores, achieving a 1:8 compression ratio without any tuning.”
Shopee
The layout of data on disk also matches the queries engineers actually run. Many observability charts are aggregation queries e.g. counting requests or averaging latency over time buckets, then grouping the results by service, region, or another dimension. These queries may scan millions or billions of events while touching only the timestamp, the value being aggregated, and a handful of fields from a much wider record.
ClickHouse can read those columns without paying the I/O cost of reading the rest. Its sparse primary index can eliminate granules that do not match the filter, with data-skipping indexes available to support additional access patterns.
"Most user queries - around 80% - only touch data from the last two days, so that data stays on disk for fast access."
OpenAI
"ClickHouse’s ability to skip data based on time makes the table sizes become almost irrelevant, as it can zoom in on the needed data efficiently."
BENOCS
The same layout continues to help once those columns reach the CPU. ClickHouse processes data in blocks of column values rather than interpreting one row at a time. For the aggregation queries, it can apply the same operation across batches of contiguous values. This improves cache locality, reduces per-row overhead, and allows suitable operations to use the SIMD instructions supported by the processor. Multiple blocks can also be processed in parallel across CPU cores.
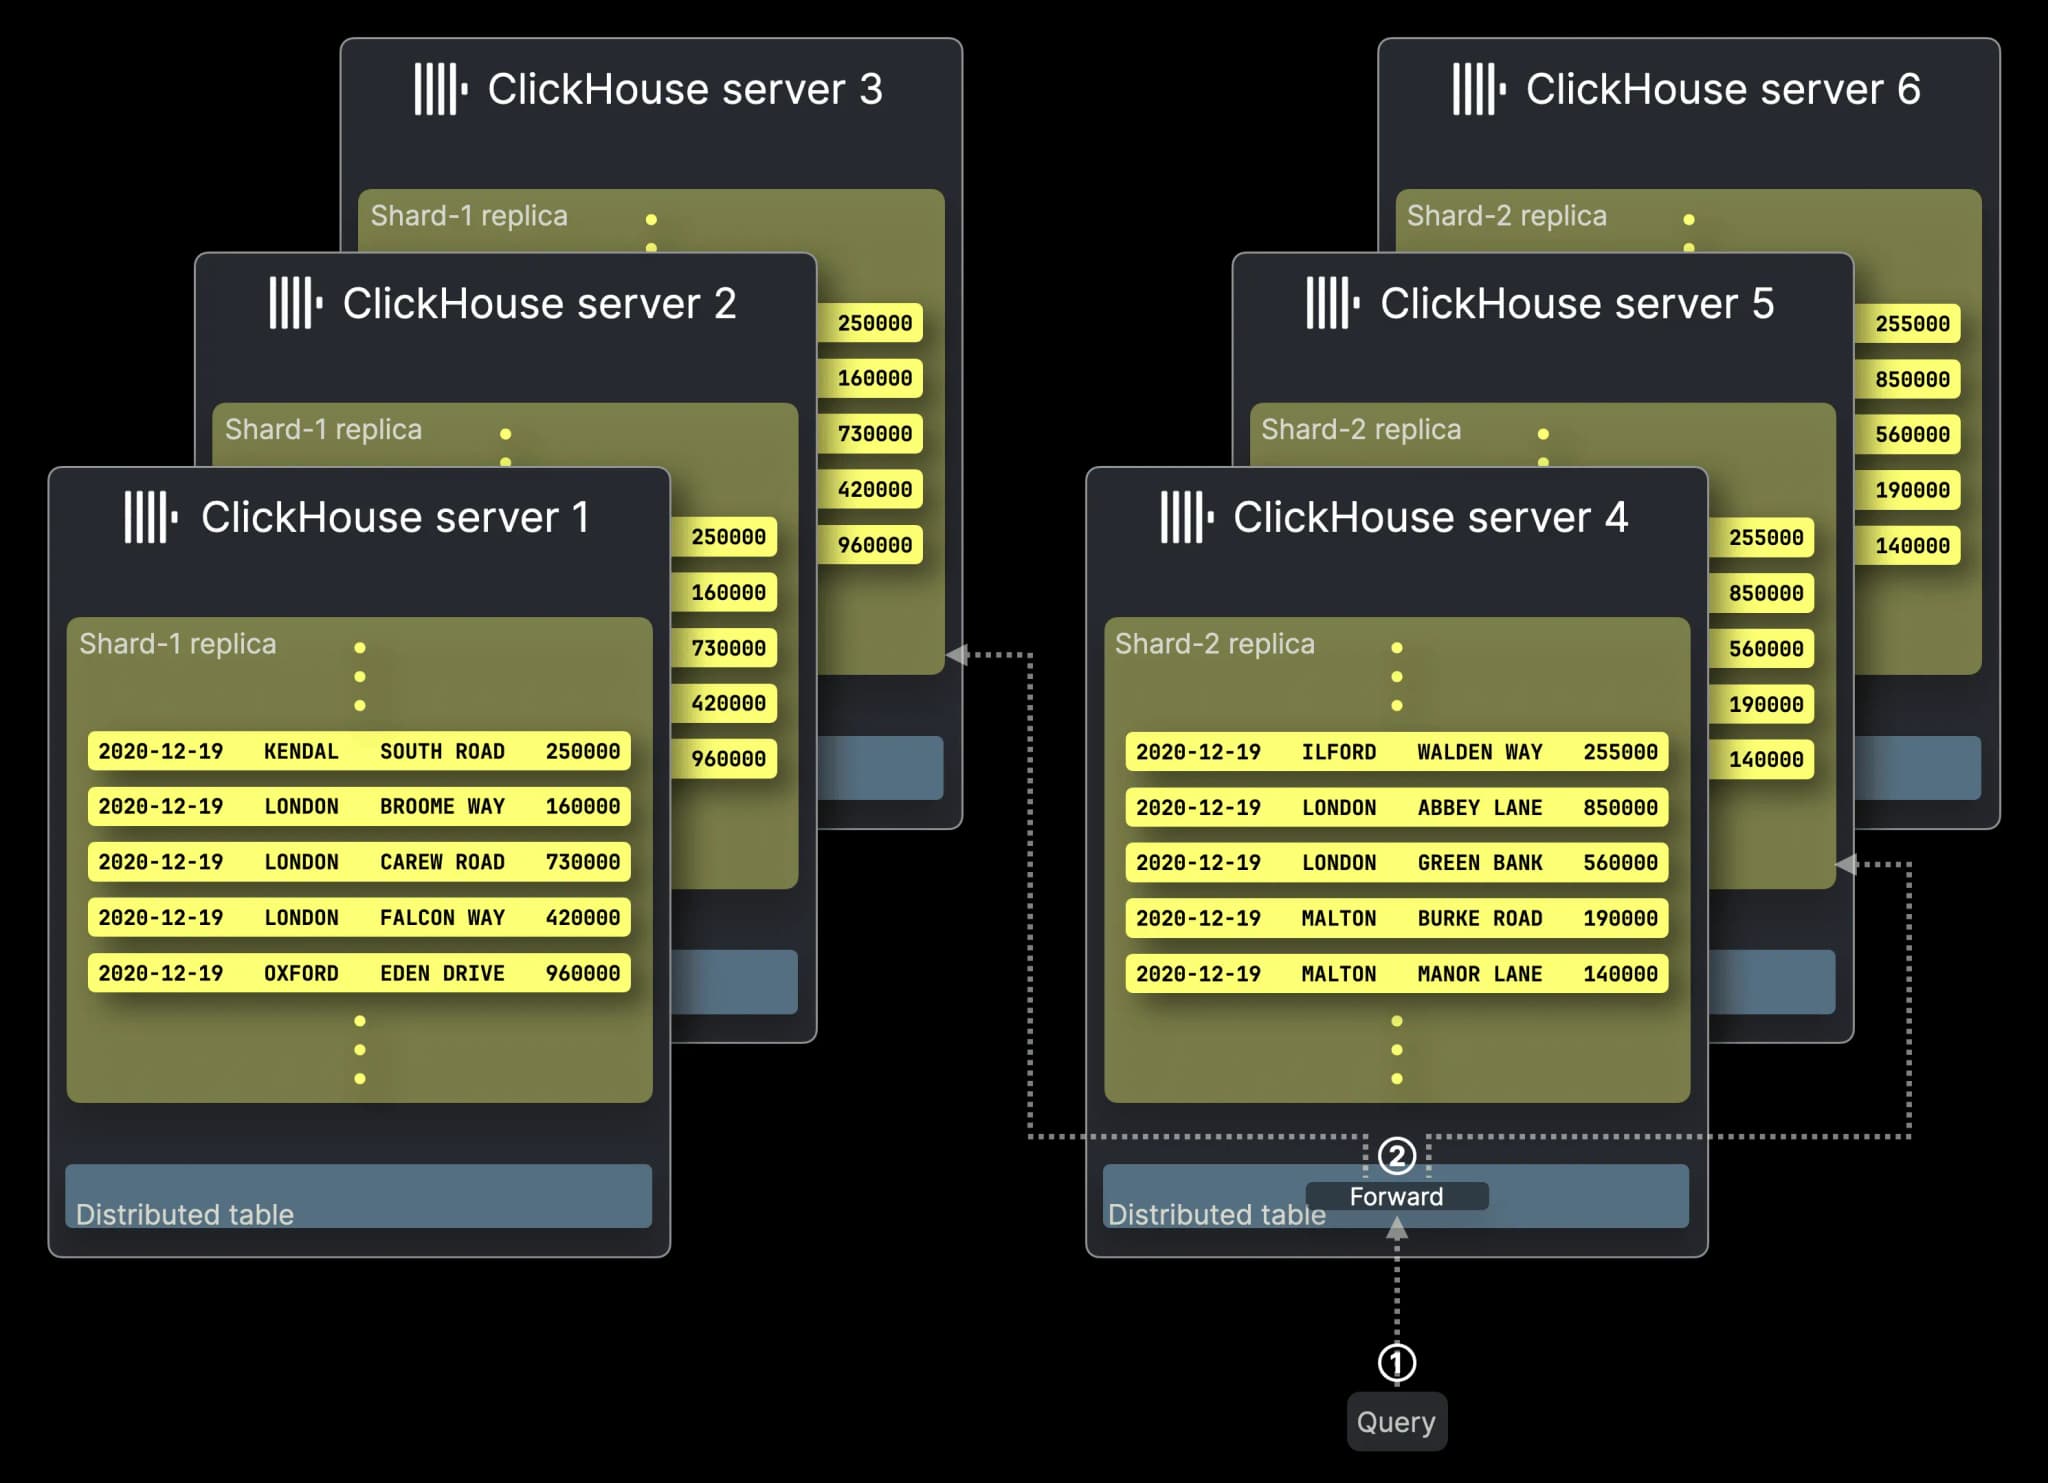
That parallelism extends across a cluster. A distributed query is sent to the shards holding the data, where each node scans and aggregates its local portion at the same time. The partial results are returned to the initiating node and merged into the final result. Adding nodes, therefore, makes more query compute available as well as more storage.
"The Parallel Replica feature distributes queries to multiple nodes for parallel processing … increasing query speeds by up to 2.5 times"
Poizon
"Making heavy use of SIMD instructions, ensuring data structures are CPU-cache efficient, and using purpose-built algorithms … processing data at massive scales."
RunReveal
Mat’s article highlights a property separate from columnar storage: ClickHouse’s scaling model. His point is that:
"ClickHouse at 10 TB a day looks like ClickHouse at 1 TB a day with more shards."
A deployment can scale vertically on larger machines, postponing sharding until the workload requires it. From there, it can scale horizontally by adding shards while keeping the same query engine and data model. Adding shards still requires capacity planning and, for self-managed deployments, careful rebalancing. But the system remains recognizable as it grows.
Other teams operating ClickHouse at scale have called out the same predictability:
"ClickHouse is also cloud-native and designed to scale horizontally. This means it’s relatively low operational lift to scale with both ingest and queries."
OpenAI
Aggregation is one common observability query pattern. During an investigation, engineers also search for an error message, filter on an attribute, and follow clues they could not have predicted when the telemetry was collected. Alerts, dashboards, and predefined workflows cannot anticipate every question. This search-heavy workflow is one reason Elasticsearch became such a common backend for logs.
ClickHouse could already run text searches using highly parallelized string scans, with Bloom filter skip indexes to rule out granules that could not contain a term. Bloom filters help, but they are probabilistic and operate at the granule level. They can produce false positives, require careful tuning, and offer little pruning when a term appears in most granules.
In March 2026, full-text search became generally available in ClickHouse. Its text index uses an inverted index that maps tokens to the row numbers containing them. ClickHouse can identify candidate rows without scanning every string value, then filter and aggregate the results in the same query. These indexes use more storage and add write overhead compared with Bloom filters, but provide exact, row-level term lookups and support multi-token and phrase search.
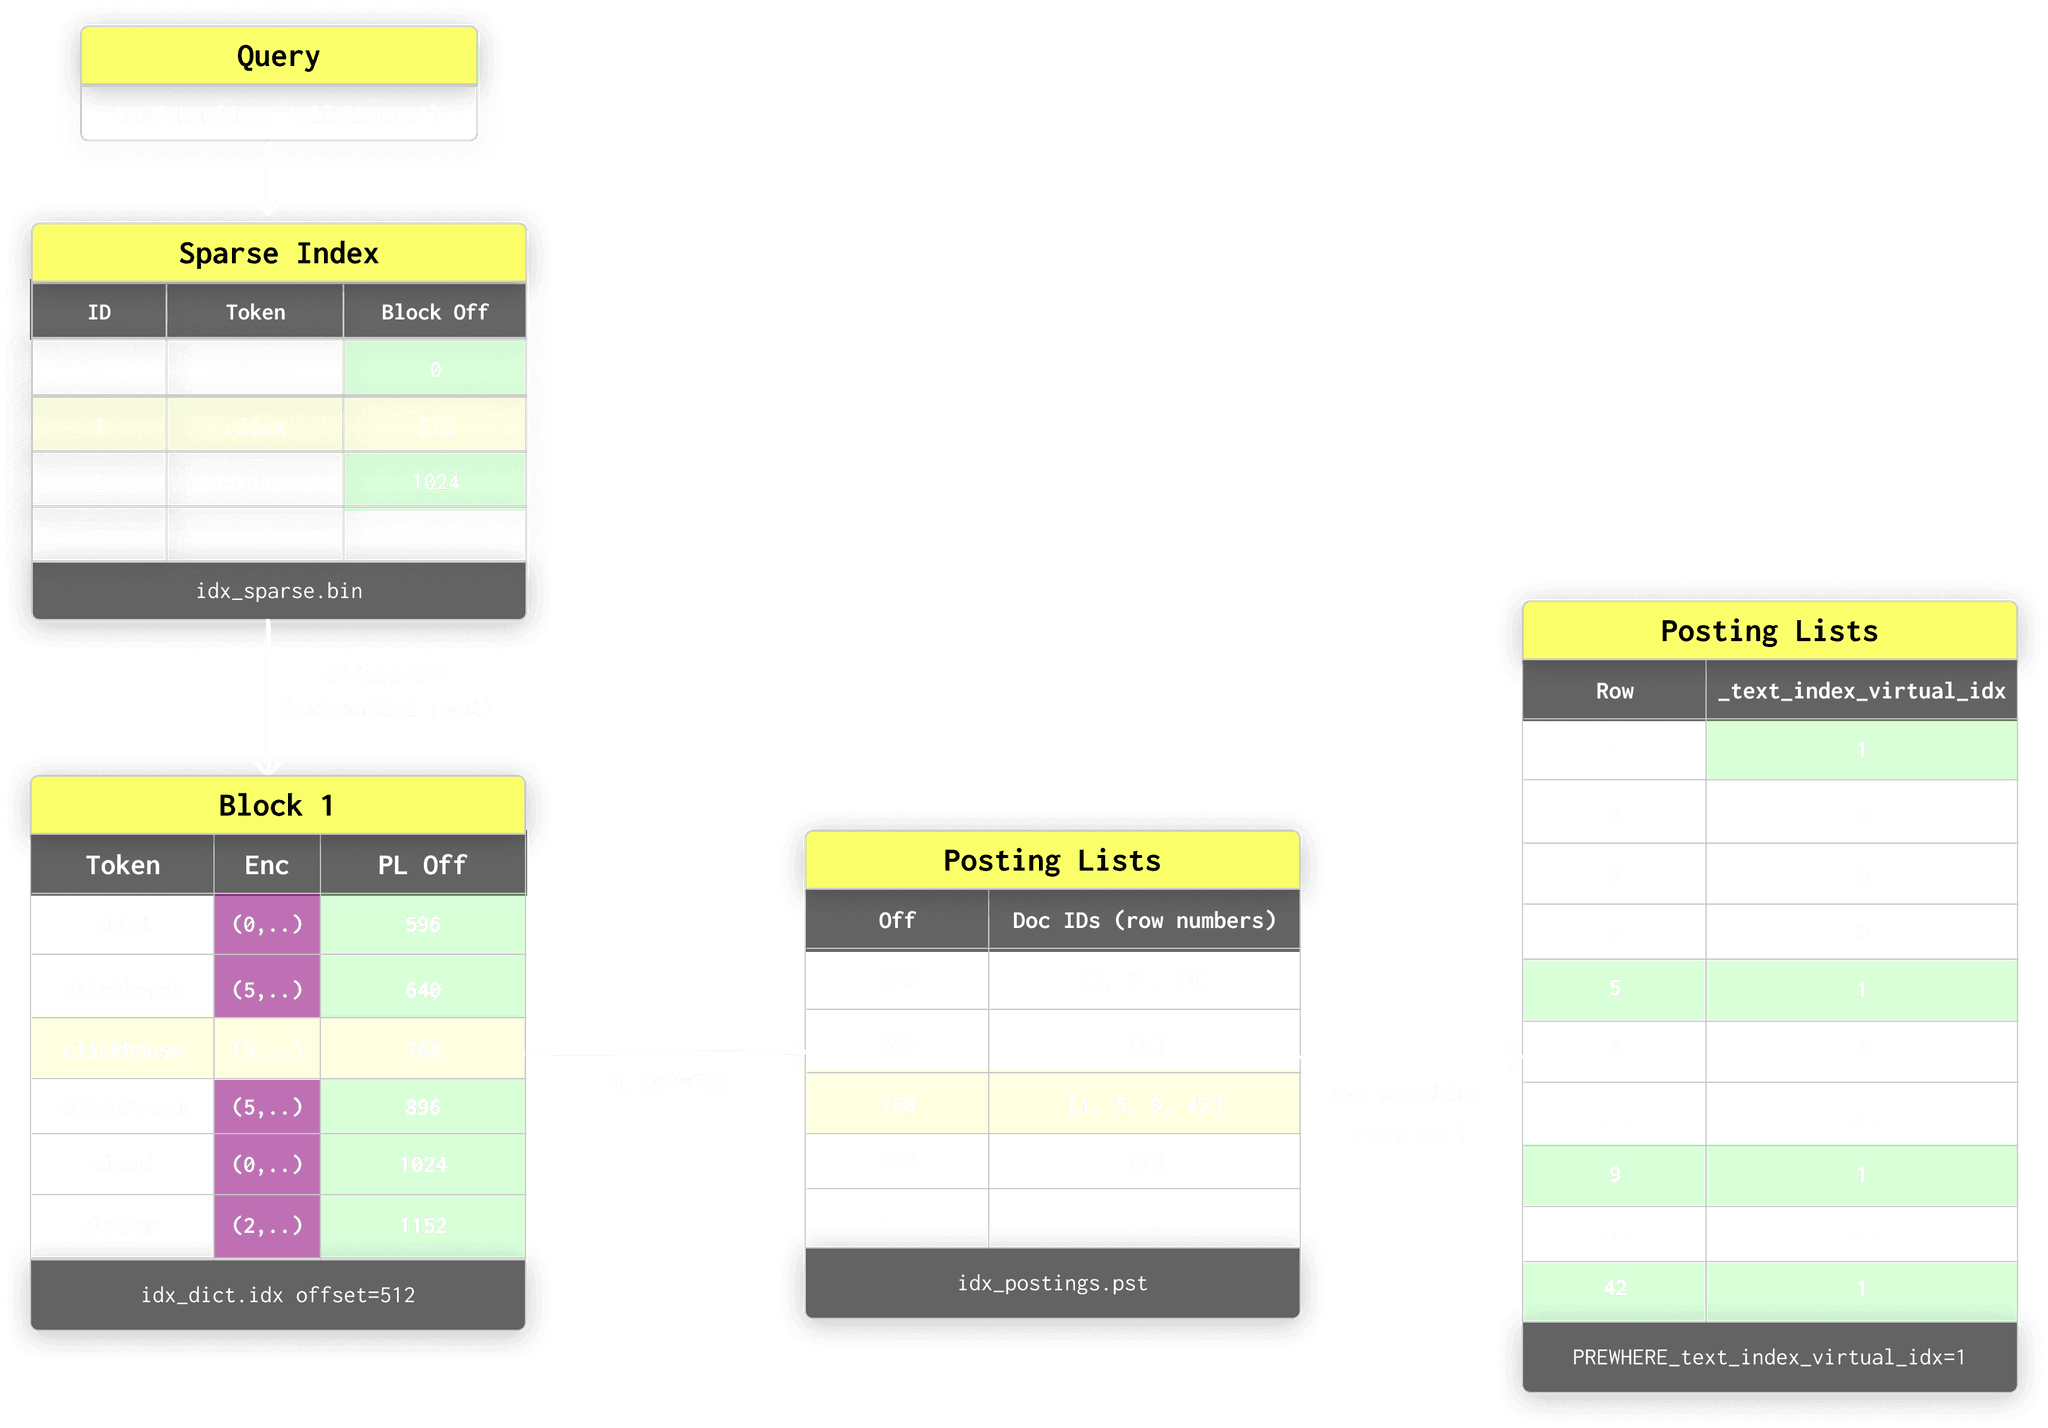
We exploit these text indexes in ClickStack to accelerate searches over log bodies and exact filters on Map attributes. Because the index is itself searchable, ClickStack can also use prefix lookups to discover attribute values for autocomplete and filter suggestions without scanning the underlying telemetry columns. The inverted index narrows the candidate rows. ClickHouse’s columnar engine handles the analysis that follows.
Our users have found these text indices extremely powerful in improving the performance of observability search workloads:
"Full-text search in ClickHouse has fundamentally changed how we search across our log data. We ingest millions of events from diverse sources, storing the raw payload in a String column, and previously, multi-term searches could take 30 to 45 seconds using linear scans. With the new inverted index, those same queries now complete in around 400 milliseconds."
Icite
High cardinality behaves differently in a columnar model. In stores like Prometheus, every unique combination of labels creates a separate time series with its own metadata, chunks, and indexing overhead. ClickHouse writes another event row instead. A field such as TraceId, user_id, or container_id may contain millions of distinct values, but its storage and compression costs remain isolated to that column, or to the relevant bucket when it is held in a sharded Map. It may compress less efficiently than a column such as ServiceName, but it does not reduce the compression achieved by every other field in the event.
Filtering is similarly driven by the columns and granules read, rather than by the total number of distinct values in the dataset. A selective filter on a high-cardinality field can reduce the amount of data scanned, particularly when the sorting key or a secondary index supports that access pattern. Cardinality still has a cost. Grouping by millions of distinct values requires ClickHouse to build millions of aggregation states, increasing query time and memory use, although those states can spill to disk when configured to do so. Typically, it's also rare for a user to want to group by and display millions of series! Our deeper comparison of cardinality in ClickHouse and Prometheus explores where those costs appear in each model. The result is that ClickHouse users stop fearing high cardinality:
"We don’t fear cardinality anymore … We can basically have all the data in one place and use it to answer all our questions."
Sierra
It's not just about columns
Columnar architecture is clearly one of the reasons ClickHouse has, in the narrow sense described above, “winning” the storage and query layer for observability. But columns alone do not explain why so many engineering teams and observability vendors have chosen it.
An obsession with performance
ClickHouse’s architecture accounts for much of its performance on observability data. Compression reduces the amount of data that has to be stored and read, while columnar I/O, vectorized execution, and parallelism (within and across nodes) reduce the work required to answer a query. The project has also developed an obsessive culture around performance and resource efficiency. Andy Pavlo captures that focus in this CMU lecture on query execution:
This work compounds in observability, where every unnecessary byte read and every wasted CPU cycle becomes an operating cost at sufficient volume. This efficiency also changes the economics of retention. ClickHouse has first-class support for object storage and for separating storage from compute, allowing large datasets to be retained at low-cost. Combined with compression and selective reads, this allows teams to retain full-fidelity, unsampled telemetry for longer without keeping it all on local disks.
Sampling and rollups can then become optimization techniques rather than requirements imposed by storage cost. Teams can preserve the raw events and decide what to aggregate after they know which questions matter.
Our users value this resource efficiency in practice:
"Users can now query data over extended time frames and analyze raw data in real-time, rather than relying on pre-aggregated formats."
Tekion
"ClickHouse offers the best performance-to-dollar of anything in the market for our use cases."
Last9
A single datastore for all signals
Many teams do not want a different backend for every telemetry signal. ClickHouse can serve logs, traces, and some metrics workloads (more below), reducing the number of systems with different scaling models, failure modes, query languages, and operational requirements that teams have to learn and maintain. The opportunity extends beyond observability, with ClickHouse also used for real-time analytics and data warehousing, allowing telemetry, operational data, and business data to be queried and correlated in the same engine rather than joined later in the application layer. Where these workloads overlap, consolidation means simpler infrastructure and a lower total cost of maintenance.
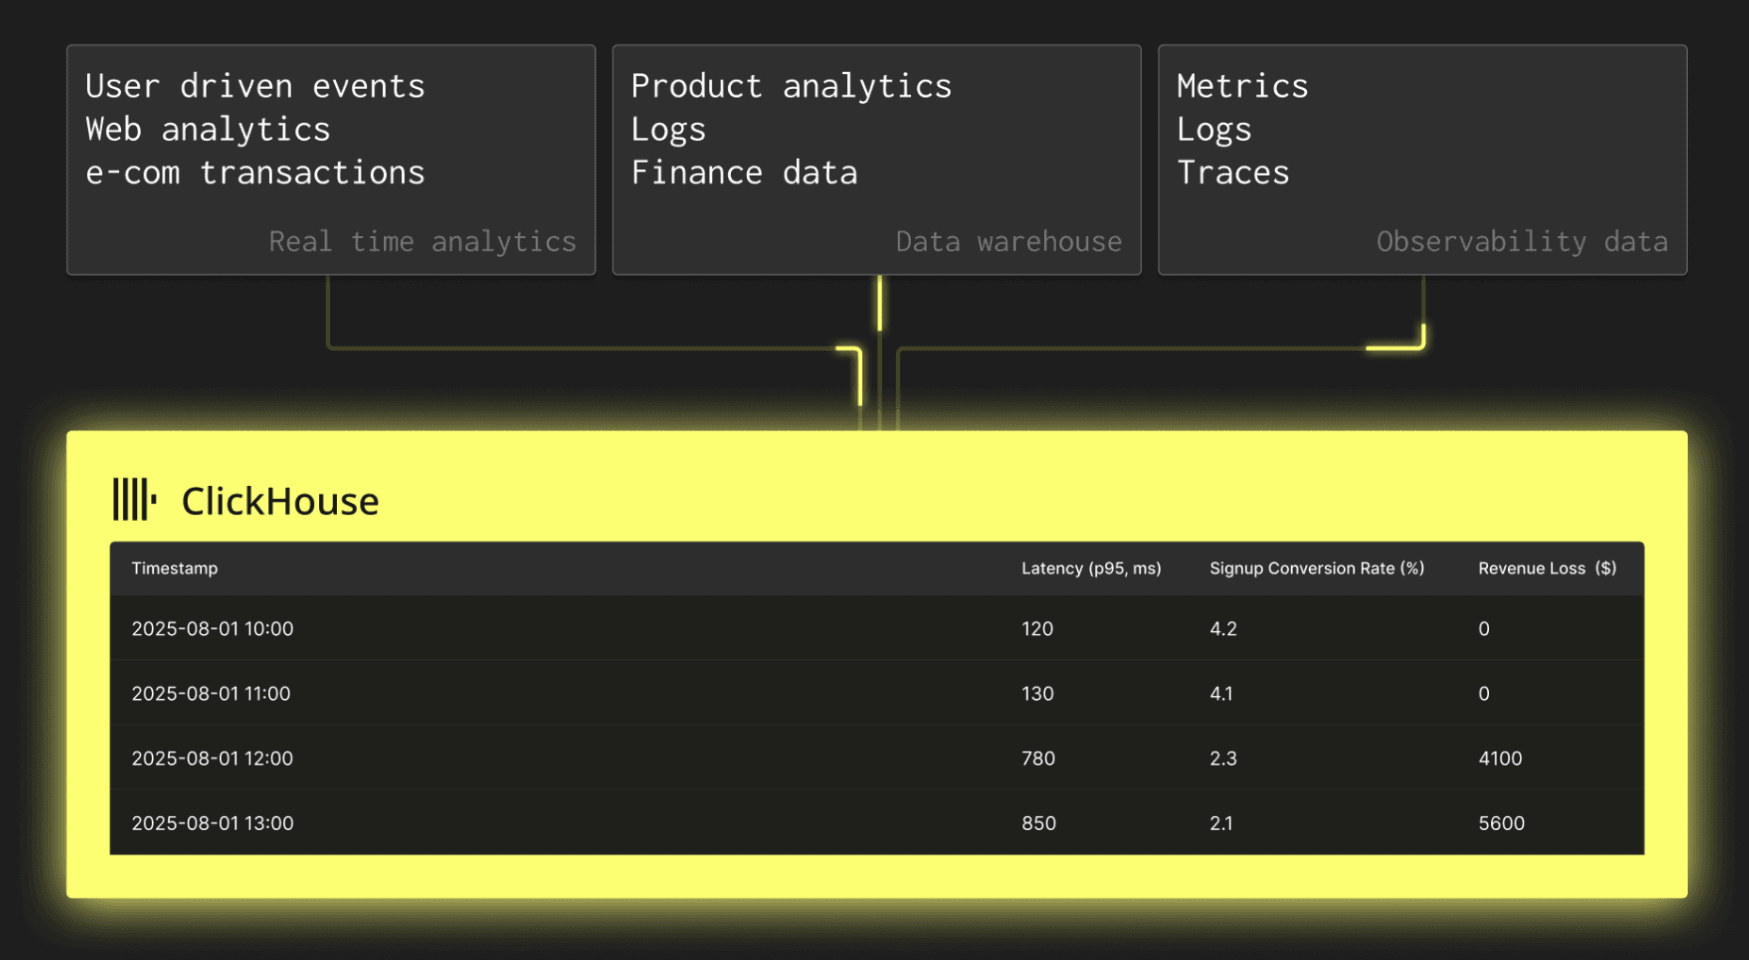
Sierra captures this well, considering observability and analytics to be just one data problem:
“It would be really cool if we no longer thought of observability and analytics as two different islands, but just one data problem, powered by a really good compute engine like ClickHouse.”
SQL as the lingua franca of data
Another reason we believe ClickHouse has become widely used for observability is its query interface. SQL is an open, well-understood standard with a mature tooling ecosystem, making it accessible to engineers and straightforward to build applications against. It is also well represented in the training data and tooling used by AI agents. ClickHouse extends SQL with a large set of analytical, statistical, time-series, and string functions, supporting complex filtering, dimensional grouping, joins, window functions, and multi-stage aggregations. These richer analytical workflows can be difficult to express in query languages designed for datastores that have been optimized for a single data signal, such as metrics or logs.
“We want to be able to ask interesting questions about our data and not be limited by a simplistic domain-specific language.”
Tesla
We acknowledge that not every user needs this level of control, of course, which is why ClickStack provides familiar builders and translates Lucene-style searches into queries optimized for the underlying ClickHouse schema and indexes, as well as having query builders that abstract complexity away. When those abstractions run out, native SQL charts and alerts give users direct access to the engine. The same platform can support a quick log search or an opinionated dashboard while leaving SQL available for users who want to investigate and analyze their observability data more deeply.
An open ecosystem
ClickHouse's open ecosystem is another reason teams are comfortable adopting it for observability. Our approach has been to meet users where they are rather than require them to adopt one complete workflow. ClickStack is the open-source stack for teams that want an integrated experience, while continued investment in the Grafana plugin supports those that already use Grafana. A growing set of partner integrations gives teams more options for collection, visualization, and investigation without changing the underlying store.
The same approach shapes our investment in OpenTelemetry. This includes work on the clickhouse exporter and Datadog receiver in the Collector Contrib distribution, helping existing telemetry pipelines connect to OpenTelemetry-compatible backends. We are also contributing to the Apache Arrow collector project, with support for Arrow as an ingestion format to reduce transfer and serialization overheads. ClickStack’s OpenTelemetry-compatible SDK distributions add capabilities such as session replay and browser capture, where the standard SDKs do not provide them directly. But most importantly, adopting ClickHouse should not require users to abandon the tools and instrumentation they already have.
Permissive licensing
It would be remiss not to acknowledge how much ClickHouse’s Apache 2.0 license has contributed to its adoption. The permissive license lets teams run ClickHouse locally or within their own infrastructure, adapt it to their needs, and build commercial products and SaaS services on top of it. They can start on their own terms and retain control over where and how the database runs.
"The open-source version had clear benefits: ‘It’s quick to get started, it’s tried and tested, you get great performance."
Anthropic
"The team appreciated ClickHouse’s open-source roots - ‘all of our tech stack is open-source’ [although] they ultimately chose to run ClickHouse Cloud."
Laminar
If operating the database later becomes a distraction, those teams can choose ClickHouse Cloud and the usual benefits of a managed service. Its separation of storage and compute is particularly compelling for the scales seen in observability: data is written once to shared object storage, avoiding a separate copy for every replica - compute services can read that data and scale independently without a “write tax”. Teams can, for example, isolate ingestion from interactive queries so that an ingestion spike does not consume the compute needed for an investigation. Open source gives users control over how they begin; ClickHouse Cloud provides another operating model when they need it, without requiring them to adopt a different database.
But what about metrics?
If you have made it this far, you may be wondering whether the same storage and querying argument holds for metrics. The honest answer is yes and no.
For metrics carried as fields on high-cardinality events, the answer is yes. This is the model Charity describes: keep the measurement with the context that produced it, then aggregate at query time. You can think of these records as structured logs with measurements attached. They retain the service, customer, request, deployment, and other dimensions that would create an explosion of series in a traditional metrics store. ClickHouse treats those dimensions as columns, so adding cardinality to one field does not multiply the number of objects the database has to maintain.
Prometheus-style metrics are a different question. Prometheus and OpenTelemetry define different metric models and protocols (why observability is needed, both are questions for another post), and teams have years of dashboards, alerts, and operational habits built around them. Meeting users where they are means supporting those workflows rather than asking everyone to translate PromQL into SQL or remodel every metric as a wide event.
That support exists today, but we would not call it finished. ClickHouse 24.8 introduced the experimental TimeSeries table engine with Prometheus remote write and remote read support. ClickHouse 25.8 added initial PromQL support, and in June 2026 ClickStack exposed an experimental PromQL data source and chart editor backed by the same engine. Coverage continues to grow, but the storage model and API can still change. Teams that depend on mature PromQL semantics across dashboards and alerts should not yet treat ClickHouse as a drop-in replacement for an established Prometheus-compatible system.
Drop-in Prometheus compatibility and maturing the TimeSeries engine are now major areas of investment for ClickHouse and ClickStack. For ClickHouse to become the default storage and query layer for observability as a whole, this is probably the largest remaining gap. The evidence for logs, traces, and event-style metrics is already strong. Prometheus-style metrics are where we still have work to do.
A database doesn’t make an observability product
ClickHouse can be the right storage engine and the resulting observability product can still be poor. Collection, schema design, signal correlation, visualization, alerting, investigation flows, and operational ownership all determine whether the system helps an engineer find the cause of an incident. A badly chosen ordering key can limit data pruning. Queries can fail to use the schema and indexes effectively. An interface can hide useful context or make routine investigations unnecessarily difficult. The database provides the capabilities, but the product still has to assemble them coherently.
That recognition is one reason we built ClickStack, which has itself seen strong open-source adoption.
ClickStack gives us a place to turn what we learn into defaults for schemas, generated queries, and optimized investigation workflows. Our work on investing in the default ClickStack to make queries faster illustrates the point, with improvements not from changing one database setting. It requires coordinated changes to primary keys, text indexes, materialized views, and the queries generated by the UI, tested against representative observability workloads. ClickHouse made that performance possible; you still need to make the right decisions to expose it.
Agents change the game
Observability’s primary interface is moving beyond dashboards and search boxes as agents investigate, form hypotheses, and query telemetry on an engineer’s behalf. More than 60% of queries to our internal LogHouse cluster now come from an agent.
This changes the workload. An agent may issue tens of queries for one question as it discovers schemas, validates results, retries, and drills down without an SRE’s pauses.
Query latency sits directly in that loop, while concurrent agents create bursts of queries. ClickHouse’s web analytics roots prepared it for both low latency and high concurrency. SQL also helps: foundation models have extensive exposure to it, giving agents an expressive language for filtering, joining, aggregating, and testing telemetry.
Agents also increase the value of fidelity and retention. Humans may compensate for a missing event using experience; agents can reason only over the context they retrieve. No prompt can recover a record that was sampled away, rolled up, or aged out. Unsampled telemetry offers more investigative paths, while longer retention provides the history needed to distinguish anomalies from normal behavior. ClickHouse makes that context practical to retain.
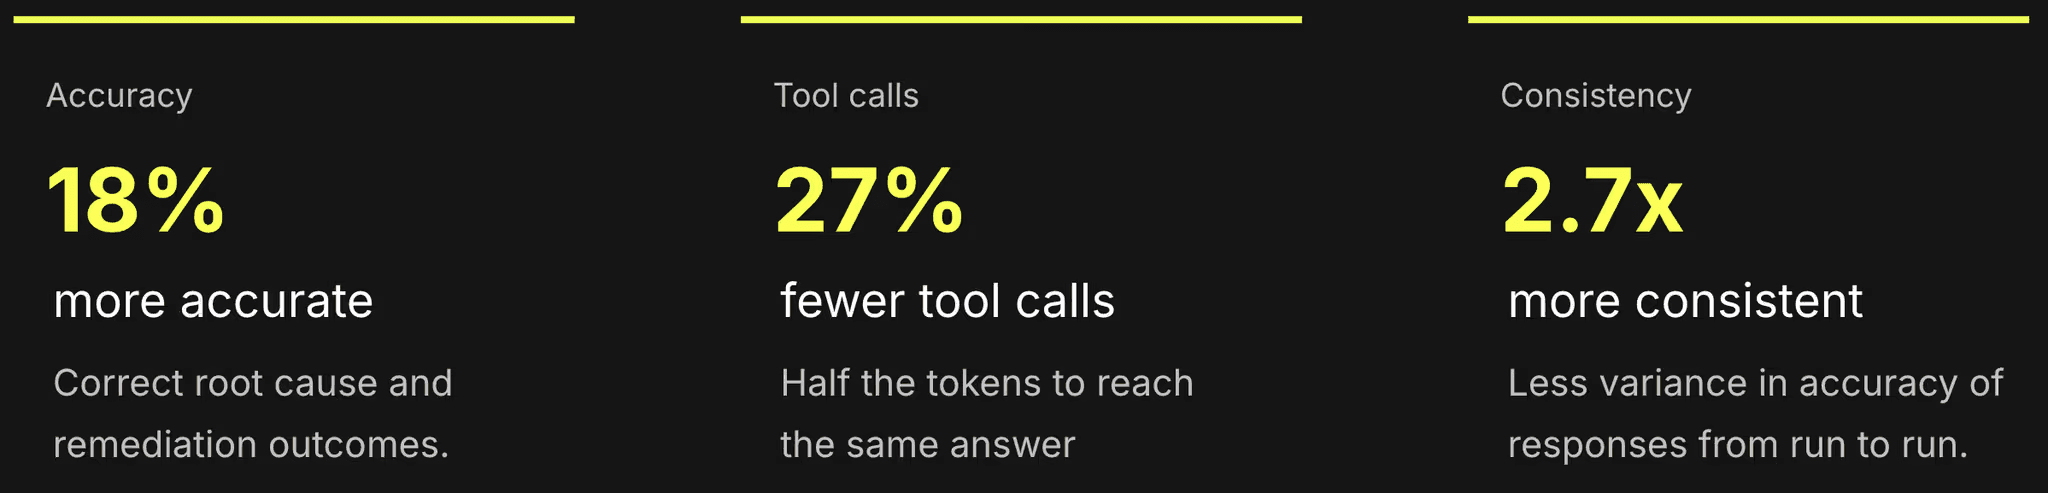
A fast SQL engine is still only part of the answer. Models can issue invalid or inefficient queries, retry them, and waste tokens and database resources exploring paths that deterministic tooling could exclude. This motivated the ClickStack MCP server. In our internal evaluations, its observability-specific tools required 27% fewer calls, produced 2.7 times more consistent results, and improved evaluation scores by almost 20% compared with the generic ClickHouse MCP server.
Log pattern analysis is a good example. Asking a model to normalize millions of messages with regular expressions and group the results can produce a large scan and a high-cardinality result. ClickStack instead samples matching events through a small number of bounded queries, clusters them with Drain3 in the MCP layer, and returns the ranked patterns to the agent. The agent gets a better investigative primitive, the loop moves faster, and ClickHouse avoids unnecessary work. SQL remains available when the investigation reaches a question that no predefined tool anticipated.
Agents may move some observability work from dashboards to conversations and automated investigations, but they do not diminish the datastore’s importance. Their need for low latency, high concurrency, expressive queries, full-fidelity data, and historical context reinforces the properties that led teams to ClickHouse - and should give users confidence that it can support this changing interface.
When ClickHouse might not make sense
ClickHouse’s strengths matter most when volume, retention, cardinality, query flexibility, or cost become significant. A small team with modest telemetry and a preference for an out-of-the-box experience may not be best served by operating a database.
Historically, we would have directed these teams to a turnkey product, especially if nobody wanted to design schemas, write SQL, or maintain the surrounding infrastructure. Open-source ClickStack now closes much of that gap.
It provides OpenTelemetry collection and familiar observability workflows, so users need not build the experience themselves or write SQL for routine investigations.
Users must still deploy and operate the stack. Managed ClickStack removes more of that burden while leaving them in control of collectors, schemas, compute sizing, tuning, and workload isolation. That control produces attractive economics at scale, but exceeds what some teams want.
There is another reasonable exception. Companies building an observability product may have workloads specialized enough to justify their own storage engine, or may decide that owning the datastore is part of their commercial IP. Control over its roadmap, behavior, and trade-offs can matter, particularly when the alternative means depending on a company with which they also compete. Building and operating a database is an expensive choice, but in those circumstances, it can be a rational one.
Most users are neither building an observability database nor competing in the observability market. For teams that need to retain and query large volumes of logs, traces, or increasingly metrics, ClickHouse remains a strong default.
So, is ClickHouse winning?
We would not declare victory - the risk of complacency alone makes that unwise. But the evidence supports a narrower conclusion: ClickHouse has become the de facto storage and query engine for many teams building observability systems. It should be the first backend evaluated for a new observability product, and we believe it can satisfy most teams’ logs, traces, and increasingly metrics workloads.
That position depends on more than the original columnar architecture. Full-text indexes have closed an important search gap, PromQL support is beginning to address conventional metrics, and ClickStack is turning database capabilities into a fuller observability experience. Continuing to execute across those layers matters more than any claim of victory.
Severin Neumann described observability as an infinite game, not a war. There is no finish line: volumes keep growing, retention expectations lengthen, and humans and agents ask harder questions. Whatever leads today must earn that position again tomorrow.
For the storage and query layer, we can acknowledge that ClickHouse is a winning choice. Observability as a whole was never a war one database could win. For us, the work has only just started.