At Sony LIV, we ingest tens of millions of video streaming events into ClickHouse Cloud and run queries to generate complex dashboards for analysis. This allows our operations team to monitor, alert & troubleshoot the QOS and QOE of our customers in real-time. ClickHouse Cloud has helped us to optimize costs and ensure the high availability and resilience of our services.
ClickStack
Open source observability for OpenTelemetry at scale
Lightning-fast queries and powerful aggregations on logs, metrics, traces, session replays and errors with unmatched resource efficiency for even your highest-cardinality OTel data.
All in one stack and built for OTel at scale - powered by ClickHouse.
Trusted for observability by
Join the companies choosing ClickStack as their high-performance observability solution
ClickHouse played an instrumental role in helping us develop and ship Claude 4. With ClickHouse, the database is green, queries are lightning-fast, and money is not on fire. ClickHouse has already delivered significant value in helping us create state-of-the-art language models.
Previously, querying the last 10 minutes would take 1-2 minutes. With ClickStack, it was just a case of how fast I could blink. The performance is real. When you're digging into logs during an incident, every second matters.
ClickStack
The ClickHouse powered observability stack
Sub-second queries
Even on petabytes of high cardinality OTel data
10-100x in cost savings
With best in class ingestion and compression rates (10x - 30x) for OTel data
Full stack OTel observability
Unify Session Replays with OTel Logs, Traces and Metrics


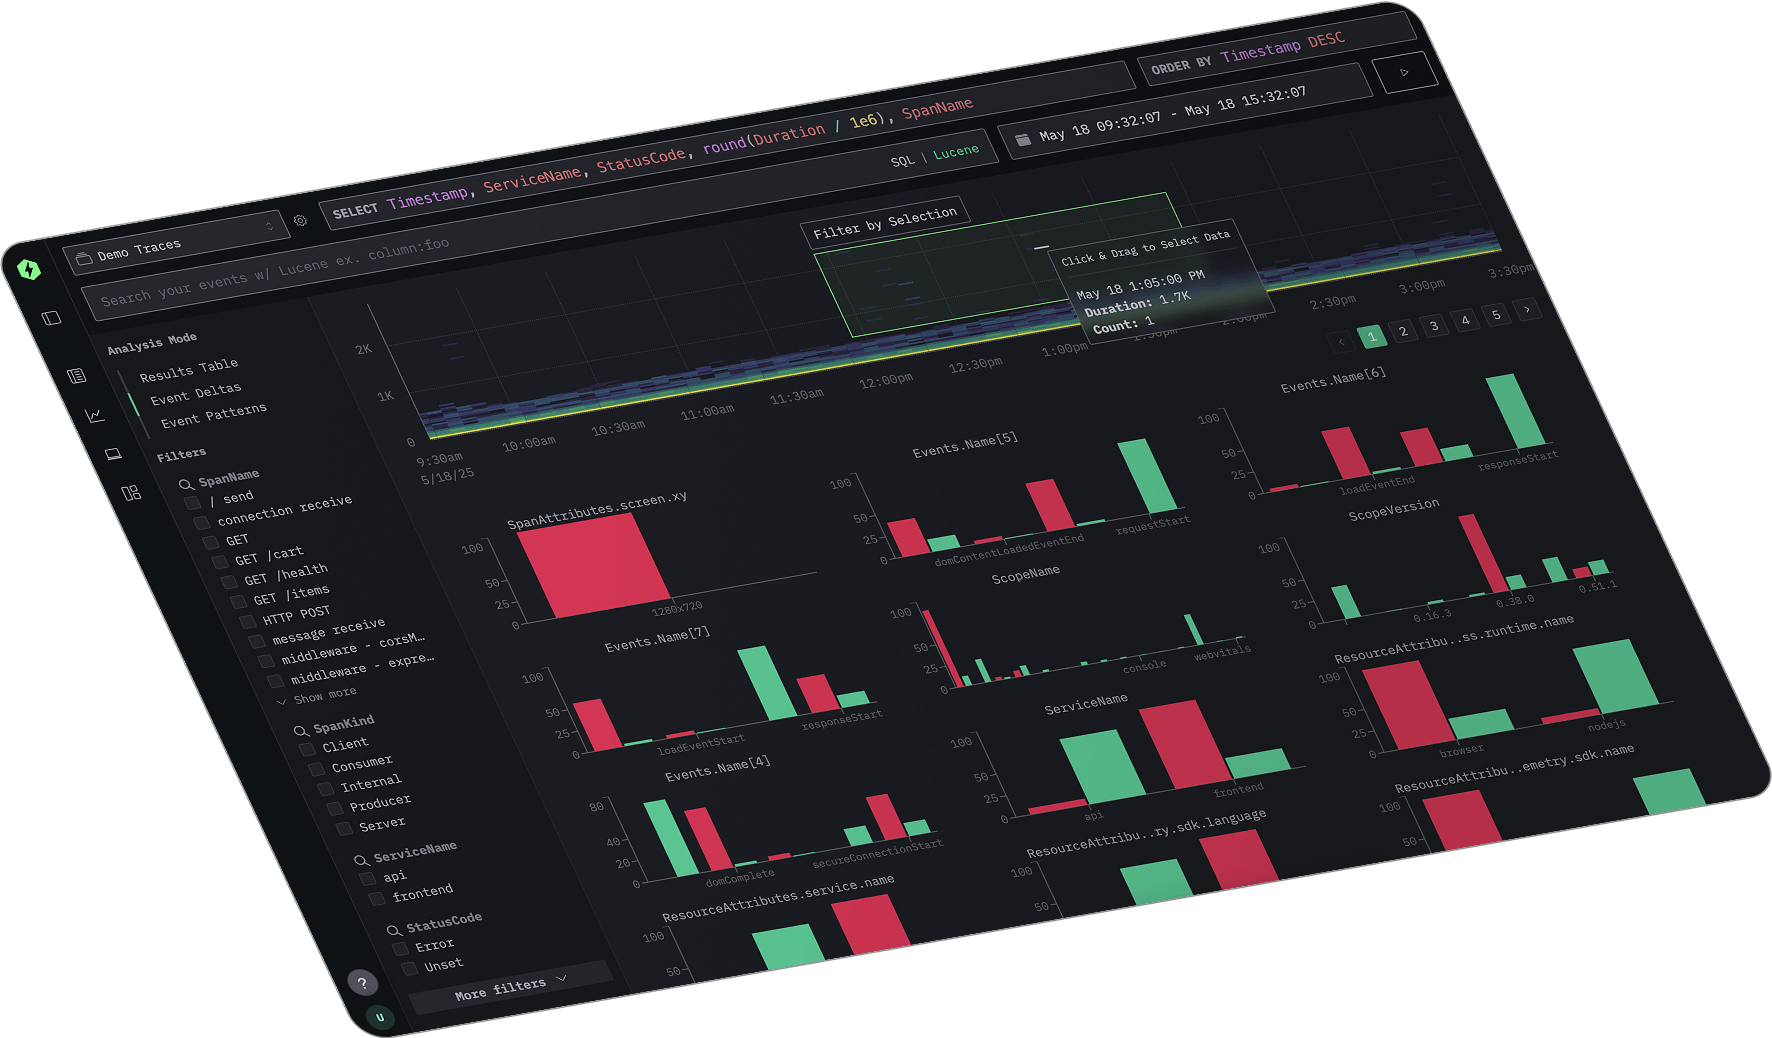
ClickStack unifies logs, metrics, traces, and session replays in one platform via the HyperDX UI. Optimized for ClickHouse, it supports fast Lucene-style search and full SQL access for advanced analysis and deeper analysis powered by over 100+ built-in functions.
Create dashboards and alerts with minimal setup. Spot anomalies with event deltas and speed up root cause analysis using event patterns.
Powered by ClickHouse, HyperDX searches terabytes of OTel data in seconds and ingests billions of high-cardinality events daily. ClickStack ships with optimized OTel schemas, removing the need for manual tuning and letting you focus on insights.
On ClickHouse Cloud, ClickStack gains elastic scaling and cost efficiency through full separation of storage and compute. Ingestion and queries can run independently on dedicated resources, thanks to compute-compute separation, ensuring consistent performance at any scale.
ClickStack natively supports the OpenTelemetry standard, capturing logs, metrics, and traces as wide events - context-rich records that unify observability data in ClickHouse. Designed for OTel data at Petabyte scale.
With native JSON support, ClickHouse efficiently handles evolving, semi-structured data. Fields are created automatically on ingest, with compressed columnar storage delivering fast queries and high compression with no upfront schema required.
Looking for a managed solution?
We've got you covered. Managed ClickStack gives you a fully managed ClickStack experience on ClickHouse Cloud. You get the same open source observability stack, and more.
- Infinite low-cost retention on object storage
- Integrated authentication
- Enterprise grade reliability
Ingest and retain high-cardinality OpenTelemetry data at less than a cent per GB, with predictable costs and no operational overhead.


Your workflows. Your harness. Your agents.
Bring your own agents to observability
Use ClickStack with Claude Code, Cursor, or any custom agent framework through the ClickStack MCP server, exposing semantic observability tools for investigation, correlation, and operational workflows.
Connect ClickStack to Claude Code, Codex, Cursor, Slack, Linear, Jira, runbooks, internal platforms, or your own custom agents through the ClickStack MCP server.
Teams can integrate AI into existing operational workflows using a consistent bidirectional interface, without being locked into a single agent or toolchain.
Purpose-built MCP tools expose structured observability primitives instead of raw SQL, enabling optimized investigation and correlation workflows for real SRE operations. In internal evaluations, ClickStack delivered up to 25% fewer tool calls, 17% more accurate root-cause and remediation outcomes, and 2.7x more consistent investigations across runs.
When deeper exploration is needed, agents and engineers can always drop directly into ClickHouse SQL for unrestricted analysis.
ClickHouse stores logs, traces, and metrics with no sampling, no rollups, and full retention, allowing agents to reason over complete telemetry instead of summarized snapshots.
Built for the speed and concurrency agentic workflows require, ClickHouse enables parallel investigations across massive telemetry volumes without slow queries or bottlenecks.
Built for OTel at scale. Get started in minutes.
Whether you're handling gigabytes or petabytes of OpenTelemetry data, ClickStack delivers unmatched efficiency with high compression, parallel query execution, and native SQL support.
The HyperDX UI provides a seamless experience with Lucene-style log search, full SQL access, and automatic correlation of logs, traces, and metrics at the database layer - no extra services, pipelines required, restricted workflows or correlation at the application layer.
If you're wondering where to send your OpenTelemetry data, the answer is simple: ClickStack. Open source. Built for OTel at scale.
Watch the 60 second overview & introduction


Want to compose your own stack with(out) OTel?
Need a custom pipeline or schema that isn't OpenTelemetry? The HyperDX UI is schema-agnostic and works with any telemetry pipeline, connecting to any ClickHouse instance for full control over your observability data.
Building your own stack? ClickHouse provides the tools: a high-performance SQL engine, HTTP ingestion, scalable MergeTree storage, and materialized views for real-time transformation. For flexible dashboarding, use the Grafana plugin to correlate ClickHouse data with other sources.
Why build your observability on ClickStack?
How does ClickStack reduce observability costs?
ClickHouse delivers exceptional cost efficiency, avoiding the overhead of JVM-based systems, with a hardware-optimized column-oriented design that reduces storage for OTel data by up to 90% without sacrificing speed.
Scaling seamlessly from a single machine to hundreds of cores, with automatic tiering between local disks and object storage for maximum performance and efficiency.
How simple is ClickStack to deploy and maintain?
Experience operational simplicity with ClickHouse's homogenous architecture—a single executable handles everything from standalone deployments to massive clusters.
For zero overhead, choose ClickStack on ClickHouse Cloud for automated scaling, backups, and maintenance. The separation of storage and compute ensures both infinite scalability and sub-second query performance through intelligent caching.
How does ClickStack deliver real-time observability?
ClickHouse is designed to handle huge volumes of continuous streams of ingest data, supporting ingestion rates of gigabytes per second while ensuring new data is searchable with sub-second latency.
Built for the most intensive real-time workloads, HyperDX exploits ClickHouse's powerful suite of aggregation and analytical functions with deep optimizations to deliver blazingly fast observability queries.
Is ClickStack only for observability data?
ClickHouse isn't just an observability store - it's a high-performance SQL database built for fast analytics.
Observability is just another data problem, and with ClickHouse you can seamlessly join observability, business, and security data in a single system, unlocking deeper insights across your entire stack with your favorite visualization tool.
Subscribe to our observability newsletter
Stay informed on ClickStack feature releases, product roadmap, support, and cloud offerings!
Instrument your applications
Trace every log, API request, DB query, and more with just a few lines of code. Instrument and observe your stack in minutes with ClickStack.
Try ClickStack in ClickHouse Cloud
Experience the full power of HyperDX + ClickHouse in just minutes. We'll get you started on a 30 day trial and $300 credits to spend at your own pace.

FAQs
We're here to make observability simple, fast, and open. Explore our FAQs to learn more about ClickStack, and if you don't see what you need, we're always happy to chat.
01
ClickStack is a high-performance, open source observability stack powered by ClickHouse. It unifies logs, metrics, traces and session replays, delivering lightning-fast queries and efficient storage at any scale.
02
At a high level, Elastic (ELK) and ClickStack share a familiar shape: both have a data collection layer (Beats and Logstash vs. OpenTelemetry), a storage engine (Elasticsearch vs. ClickHouse), and a UI (Kibana vs. HyperDX). But beneath these parallels, the architectures diverge.
Elastic is a distributed search engine built around inverted indices and a shard-based architecture. While effective for full-text search, this design introduces high storage overhead, limited query parallelization, and contention between ingest and query workloads.
ClickStack, powered by ClickHouse, takes a different approach. Its columnar, shared-nothing architecture is optimized for analytics, minimizing storage with advanced compression, parallelizing queries across all available cores, and separating storage from compute in the cloud for consistent, efficient performance. With full SQL support, ClickStack enables deep, real-time analysis across all your observability data while still providing support for Lucene-style queries for fast searching.
For more details on how ClickStack compares with the ELK Stack see our comparison guide.
03
The ClickStack consists of three core components:
- ClickHouse - The columnar database powering fast, cost-efficient queries and compression.
- HyperDX - The unified UI for search, dashboards, alerts, and session replays.
- OpenTelemetry - Standardized data collection for logs, metrics, and traces.
Together, they form a single, integrated observability stack optimized for speed, scalability, and simplicity.
04
Yes. ClickStack is built for OpenTelemetry at any scale. It includes a bundled OpenTelemetry Collector and natively ingests OTel events - combining logs, metrics, and traces into a unified model. Powered by ClickHouse's parallel processing and columnar storage, ClickStack scales seamlessly from small deployments to petabytes of telemetry data while maintaining real-time performance.
Although ClickStack is OpenTelemetry-native, it also supports any wide event format. While OpenTelemetry schemas are provided out of the box, users can bring their own - just include a timestamp, and the HyperDX UI with ClickHouse delivers the same powerful querying, correlation, and visualization capabilities.
05
No. While ClickStack is optimized for the OpenTelemetry schema, making it the fastest way to get started and scale easily, it's not limited to it. ClickHouse, the database powering ClickStack, can store and query any event schema.
The HyperDX UI requires only a timestamp field to render and visualize events, so you can use your own data formats or custom pipelines. By following a wide events pattern and including a timestamp, your data becomes immediately usable within ClickStack.
06
Yes. ClickStack is a full observability platform designed to handle logs, traces and metrics in one place. Built on ClickHouse, it efficiently ingests and stores high-cardinality OpenTelemetry data, automatically correlating events at the database layer for deep, real-time insights.
07
Yes. ClickStack uses ClickHouse, which is columnar by default, and supports optional inverted indices at the column level. You can enable inverted indices and bloom filters to accelerate log and text search, which is common for log data exploration. The HyperDX UI accepts Lucene-style syntax, transpiles it to SQL, and can leverage these indices for speed. If you want to minimize storage, you can disable indices and rely on ClickHouse's fast, multi-parallel string search, which is sufficient for many use cases.
08
Yes. ClickStack and its components are fully open source and built on open standards. ClickHouse and the OpenTelemetry collector are licensed under Apache 2.0, with the HyperDX UI using the MIT license. You can deploy ClickStack anywhere - self-hosted, hybrid, or in the cloud, without restrictions.
09
Managed ClickStack is the fully managed version of ClickStack, running on ClickHouse Cloud. You get the same open source core and user experience, but without the operational overhead of managing ClickHouse. Cluster management, scaling, upgrades, backups, and reliability are handled for you, and authentication and user management are fully integrated with ClickHouse Cloud.
Managed ClickStack also includes additional platform capabilities that are not available when running ClickHouse open source alone. This includes cloud-native separation of storage and compute, independent scaling of read and write paths, and low-cost object storage that enables near-limitless retention. Planned enterprise features such as fine-grained RBAC are delivered as part of the managed platform, alongside the broader reliability, security, and cost-efficiency benefits of ClickHouse Cloud.