50.5k
50.5k
What is Direct I/O, and why would a managed Postgres care about it when taking a backup? Every day, a backup copies your whole database, hundreds of gigabytes, off the same NVMe drives that are answering your queries, and ships it to object storage. Linux treats those reads like any other file read: it keeps a copy of every byte in memory, in the page cache, in case someone asks for it again. Nobody will. To make room for those copies, the kernel throws out data Postgres had in memory and was about to use, and the next query that needs it goes to disk instead.
Direct I/O is the flag that tells the kernel to skip the cache for those reads. Turn it on and a second problem appears. The reads also lose the kernel's readahead, and on a set of four striped NVMe drives a small read keeps one drive busy while the other three sit idle.
The short version
A backup reads every byte of a live database off the drives that are serving queries. By default those reads go through the kernel's page cache, pushing out data the database had in memory and costing a kernel copy per byte while queries run.
Direct I/O skips the cache. On our test box it left the warm data in place, cut the latency hit queries took during the backup by about two thirds, and used about 14% less CPU. It also switches off readahead, so on striped NVMe the read size and reader count have to match the array.
ClickHouse Managed Postgres sizes each direct read to span the whole RAID0 stripe and scales the reader count to the hardware. On a 48 vCPU box with four NVMe drives and a 467 GB database under a live workload, the buffered backup evicted all 40 GiB of a table that was warm in memory and idle. The Direct I/O backups evicted nothing and finished in 71 seconds.
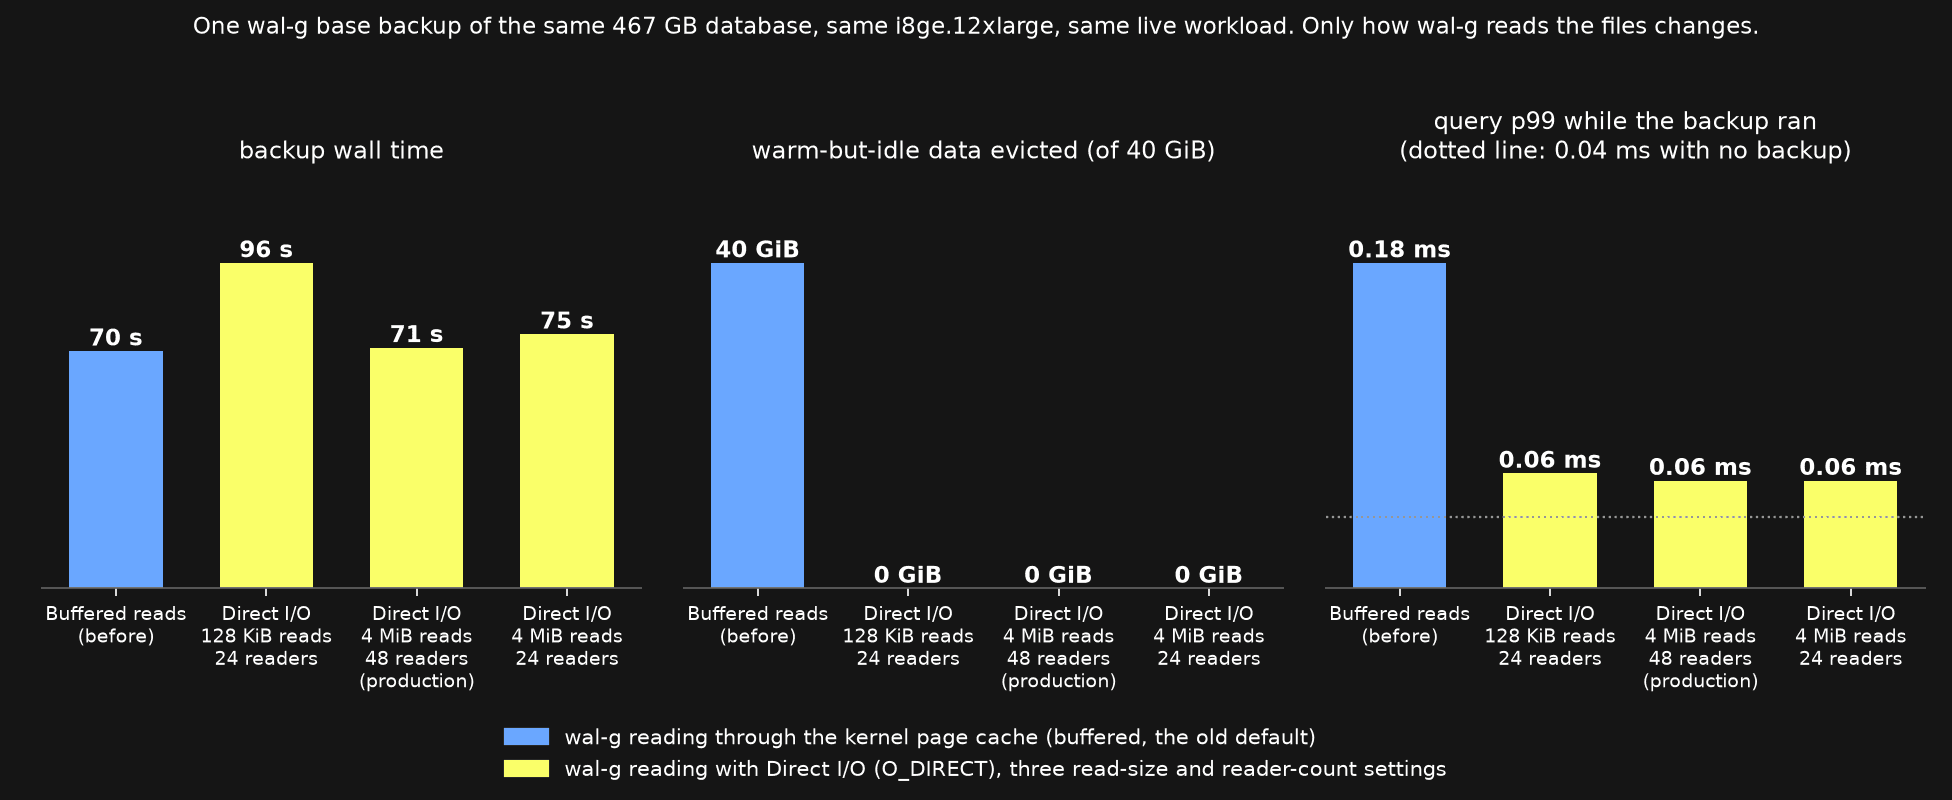
Four wal-g configurations tested on the same i8ge.12xlarge instance with a 467 GB database and an ongoing read workload. A (red): buffered reads, 24 parallel disk readers. B (orange): Direct I/O with 128 KiB reads, 24 readers. C (green): Direct I/O with 4 MiB reads, 48 readers. D (blue): Direct I/O with 4 MiB reads, 24 readers. Only the backup I/O mode, read size, and reader count vary between runs.
Backups share the box with the database
On ClickHouse Managed Postgres, local NVMe is the hot path: Postgres reads and writes its heap, indexes, and WAL there, which is why the service runs on local disks in the first place. Object storage holds base backups and archived WAL, which together give you point-in-time recovery. How the archived WAL gets there without filling the disk is its own story.
On instances with more than one instance-store NVMe, we stripe them together with mdadm --level=0 into /dev/md0 and mount it at /dat. Postgres lives on /dat. The backup agent, wal-g, is pointed at the same directory and at a per-timeline bucket in object storage.
A base backup does not wait for a quiet moment. It reads the entire data directory while the database is live, and every byte comes off the same drives, through the same kernel, as every byte a query reads.
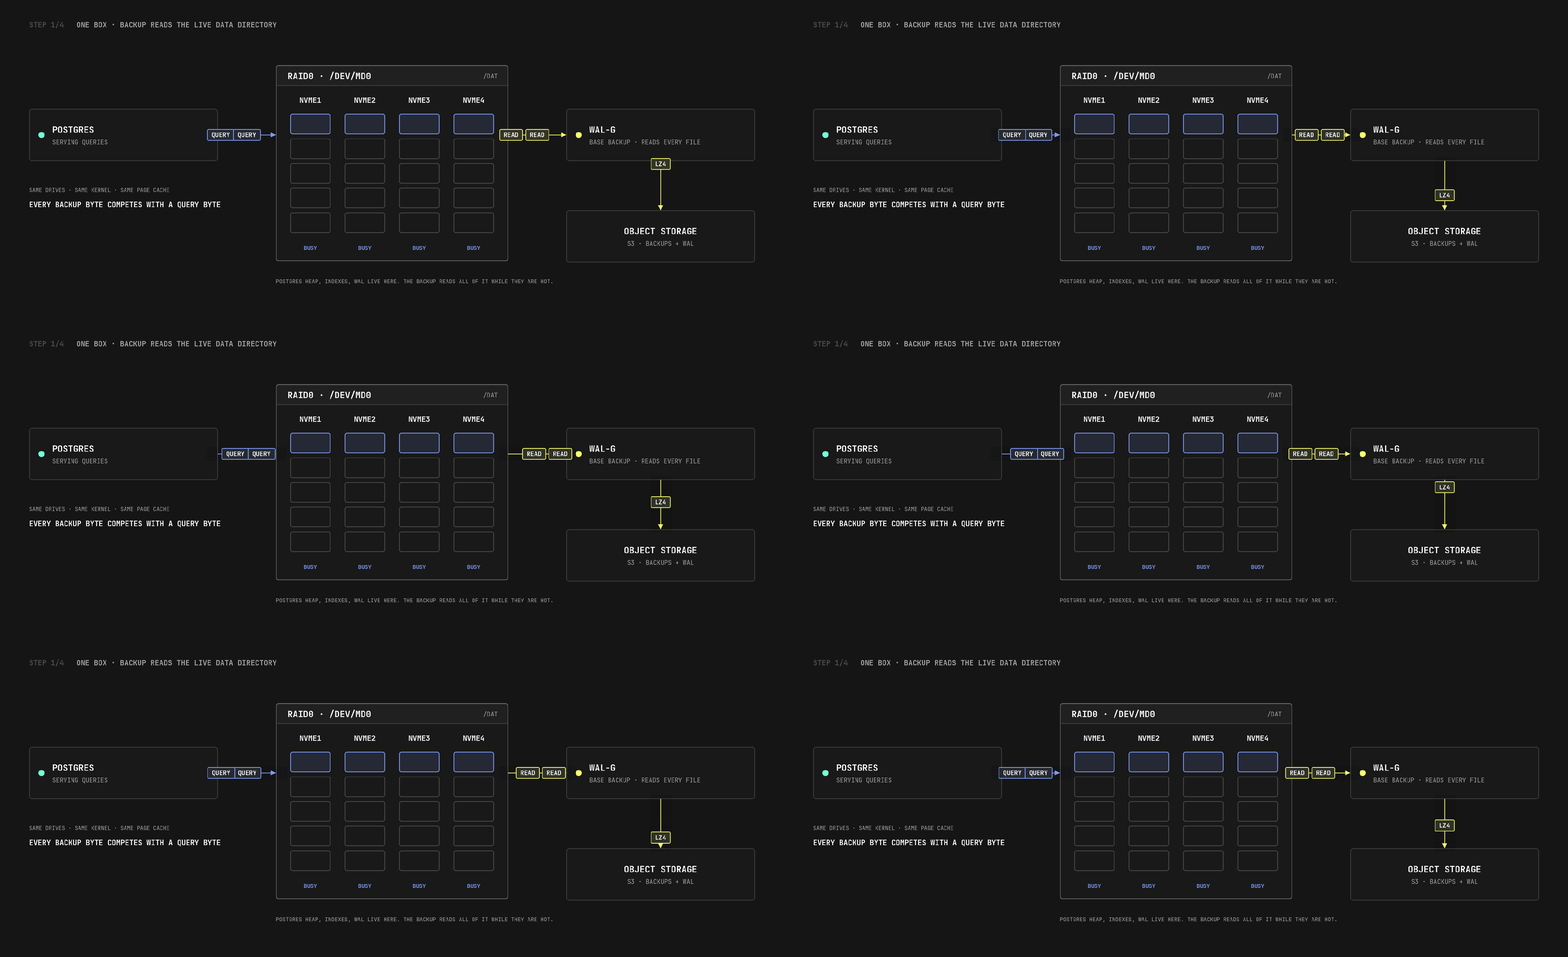
One machine, one set of drives. Queries and the backup read from the same RAID0 array at the same time.
Buffered reads are a silent tax on Postgres
By default, when a process reads a file on Linux, the data goes through the page cache: the kernel keeps a copy in memory in case someone asks for it again soon. That helps almost every program. It hurts a backup, which reads each file once, hands it to the uploader, and never touches it again. The page cache is finite and shared, so as the backup streams hundreds of gigabytes through it, the kernel makes room by evicting data Postgres had in memory.
Postgres has its own cache in shared_buffers, a quarter of RAM on our servers and pinned in huge pages, so those pages are safe. Everything else leans on the OS page cache: relation files that do not fit in shared buffers, recently written WAL, temp files, visibility maps. A double-buffered design assumes the OS side stays warm.
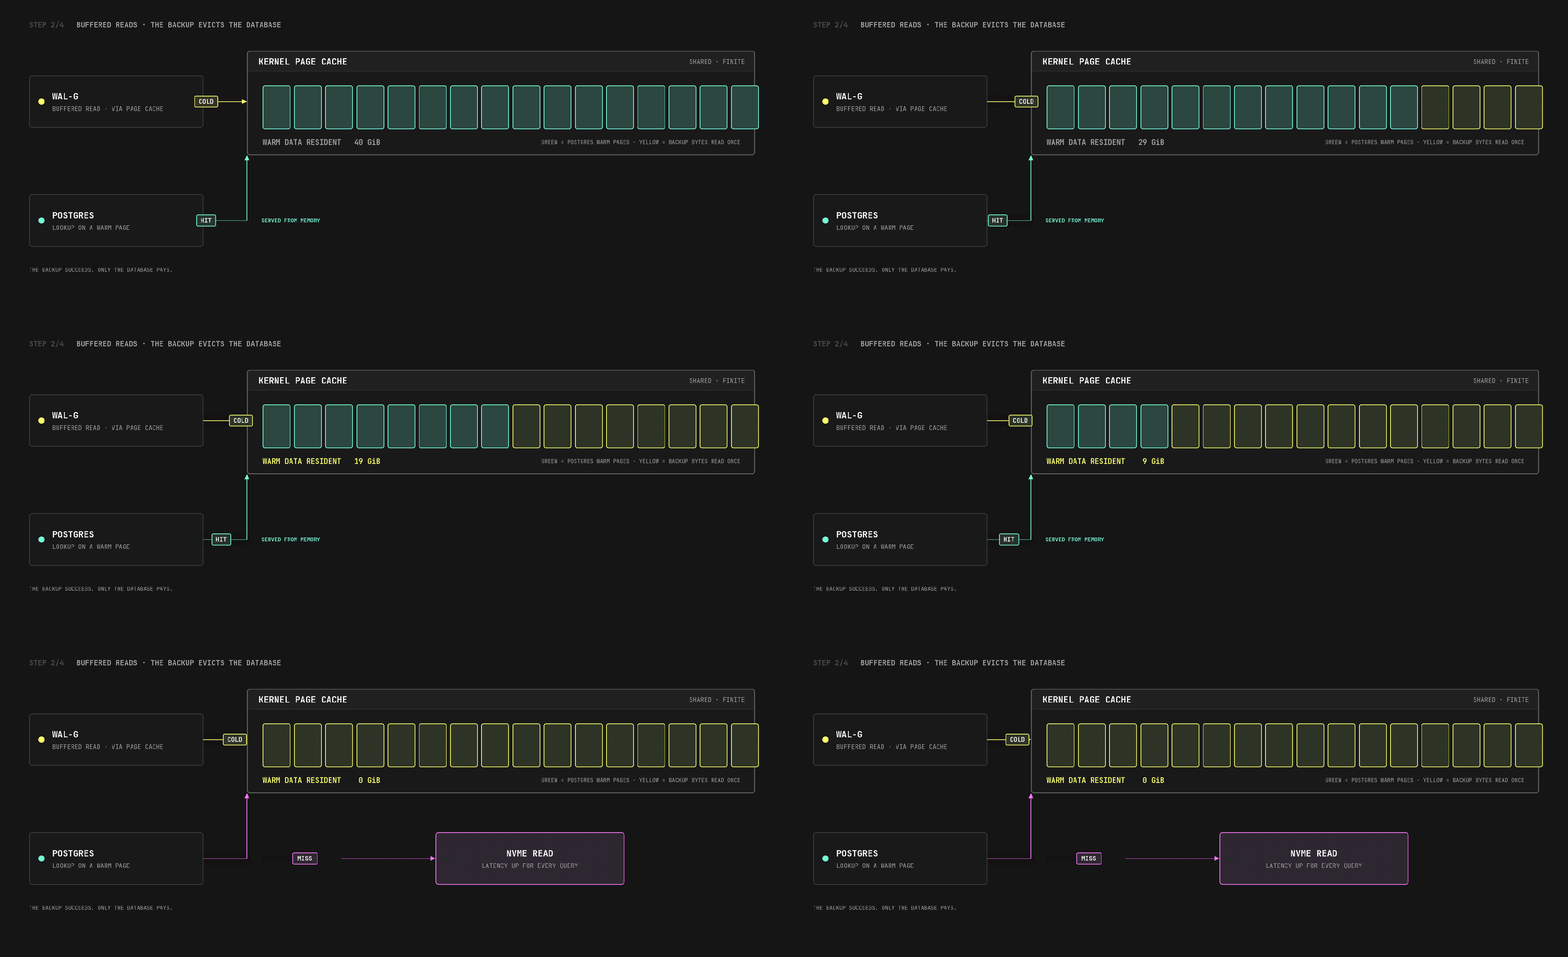
Buffered backup reads fill the page cache with bytes nobody will read again. The pages they replace belonged to the database.
The kernel does protect the busiest pages. Anything being touched constantly sits on its active list and survives a streaming read, so the hottest few gigabytes of a busy table usually stay put. Everything that was warm and idle at that moment goes: the table a report queried an hour ago, the index a nightly job will need, the WAL segments a standby is about to ask for. On our test box, a buffered backup evicted all 40 GiB of a table that had been read into memory minutes earlier and was idle while the backup ran.
There is a second, smaller cost that applies even to the hottest pages: every buffered byte is copied through the kernel into the page cache before the backup process sees it, on the same CPUs and memory bus the queries are using. Both costs are easy to miss. The backup completes, uploads, and shows up in the backup list. Meanwhile queries got slower, and the next report runs cold.
Fix attempt: skip the cache with direct I/O
Direct I/O is a way to read a file while telling the kernel not to cache it. The process opens the file with the O_DIRECT flag, and data moves straight from the block device into the process's own buffer. No copy is left behind in the page cache. In our wal-g configuration this is one line:
WALG_DIRECT_IO=trueWith this set, the backup's reads bypass the page cache entirely and Postgres keeps its warm pages. That fixes the eviction problem and introduces a new one: Direct I/O also gives up kernel readahead. Under buffered I/O, when a process reads a file sequentially, the kernel notices and reads ahead in large chunks, keeping the device queue full. Under O_DIRECT the process gets the bytes it asked for and nothing more.
On a single drive that is manageable. On a RAID0 stripe it is a throughput cliff. RAID0 splits data into chunks, 512 KiB on our arrays, and spreads consecutive chunks across the member drives. A small O_DIRECT read lands inside one chunk, which lives on one drive. The other drives sit idle for that request. Without readahead to batch things up, a backup issuing small direct reads drives one NVMe at a time on a box that has four of them.
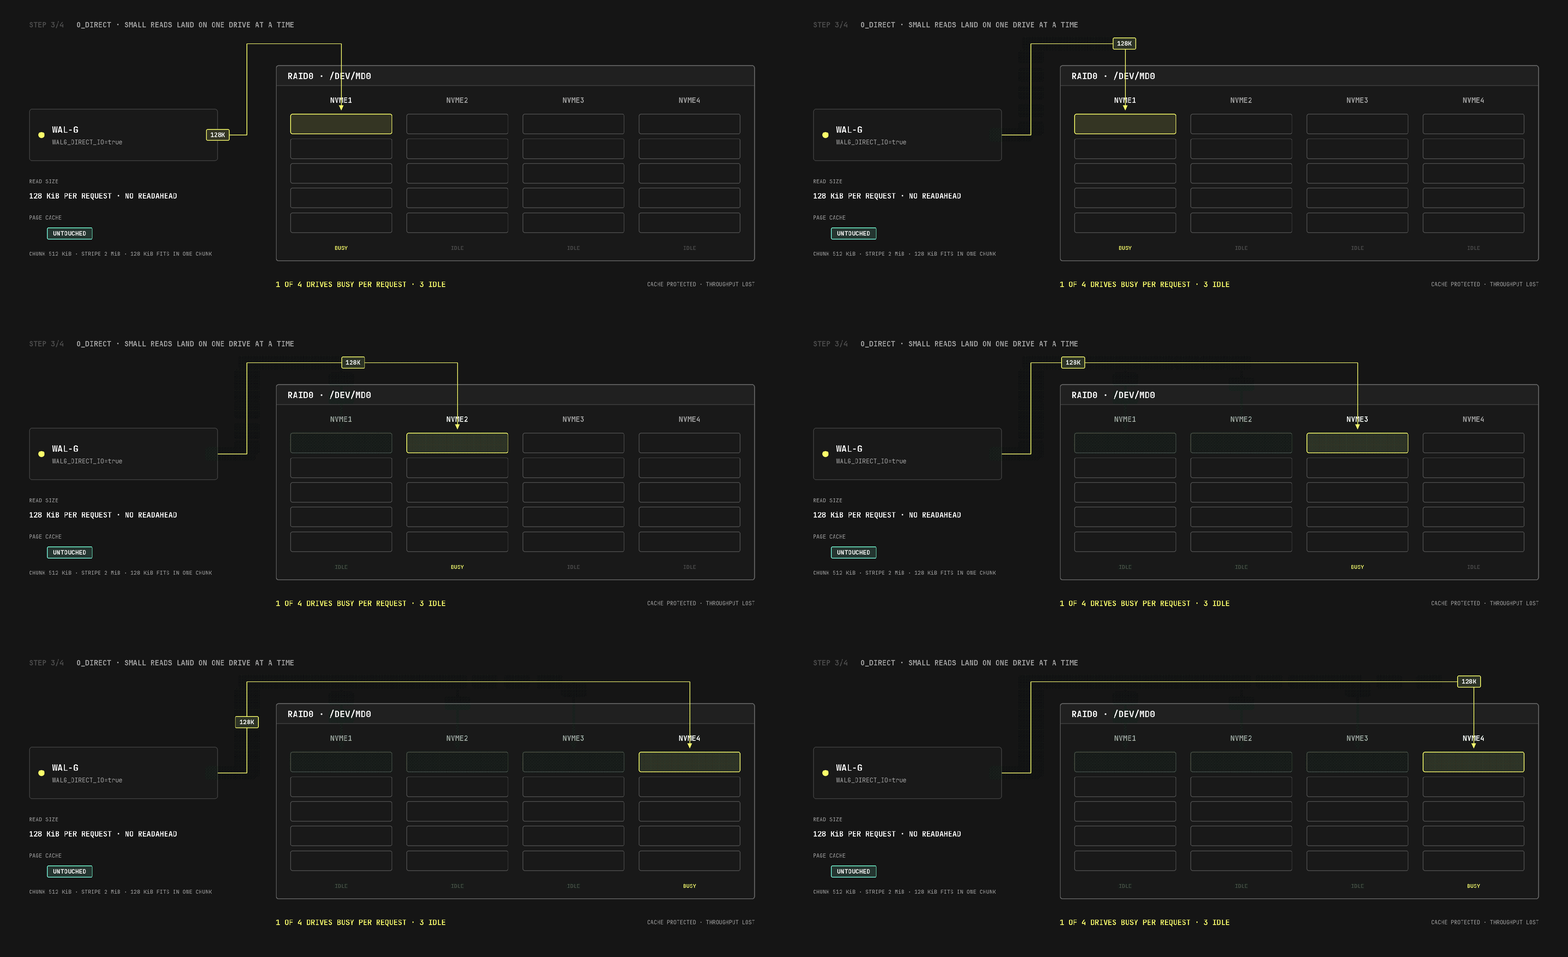
wal-g's default direct read is 32 blocks of 4 KiB, 128 KiB. Each one fits inside a single 512 KiB chunk, so a single request touches one drive.
So the first version of "turn on Direct I/O" protects the page cache and makes the backup slower.
Size the direct I/O read to the stripe
The way out is to make each direct read large enough to span the whole stripe. If one read covers a chunk on every member drive, every drive serves part of it, and the array behaves like the parallel device it is. Here is the relevant piece of our config generator:
DIRECT_IO_BLOCKS_PER_DRIVE = 256
if direct_io
# RAID0 arrays attempt to evenly distribute the data blocks across the block devices.
# Therefore, larger block reads get fan out to more devices and produce higher throughput.
direct_io_block_count = direct_io_drive_count * DIRECT_IO_BLOCKS_PER_DRIVE
lines << "WALG_DIRECT_IO=true"
lines << "WALG_DIRECT_IO_BLOCK_COUNT=#{direct_io_block_count}"
endWALG_DIRECT_IO_BLOCK_COUNT is how many 4 KiB blocks wal-g reads per direct I/O request. We give it 256 blocks per member drive, 1 MiB per drive:
| Drives in RAID0 | WALG_DIRECT_IO_BLOCK_COUNT | Read size |
|---|---|---|
| 1 | 256 | 1 MiB |
| 4 | 1024 | 4 MiB |
| 8 | 2048 | 8 MiB |
The drive count comes from the server's live list of storage devices: on AWS, every instance-store NVMe the server discovered after dropping the EBS boot volume. Four drives in /dev/md0 give 4 MiB reads; one drive gives 1 MiB. A direct read should be at least as wide as the array, because anything smaller leaves part of the stripe idle on every request.
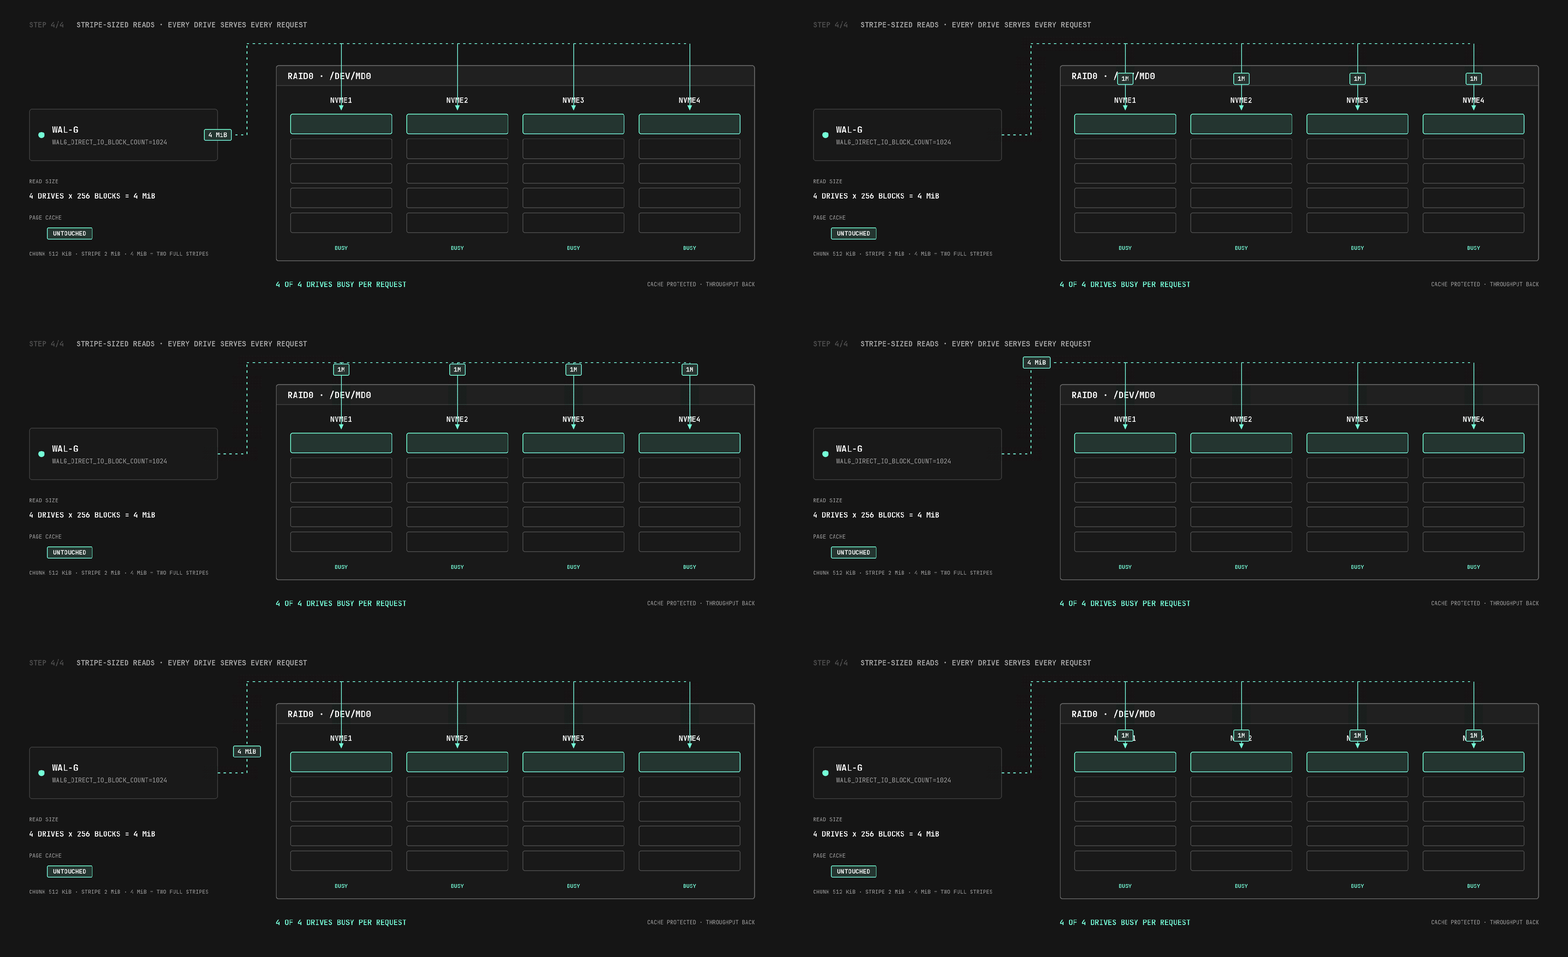
A 4 MiB read covers two full stripes, so every drive serves part of every request and the page cache still stays untouched.
Parallel readers: when half the CPUs is wrong
Read size is one knob. The other is how many readers are issuing those reads at once. WALG_UPLOAD_DISK_CONCURRENCY controls how many parallel disk readers feed wal-g's upload pipeline. The right number depends on whether the bottleneck is CPU or the device, and Direct I/O shifts that balance.
# WALG_UPLOAD_DISK_CONCURRENCY is CPU or Disk bound, hence different thresholds
disk_concurrency =
if direct_io
(dense_nvme || vcpu_count <= 2) ? vcpu_count : (vcpu_count / 2)
else
(vcpu_count / 2).clamp(1, 128)
endUnder buffered I/O, we use half the vCPUs. Readahead keeps the device busy on the kernel's behalf, so a modest number of readers is plenty, and the remaining CPU is left for Postgres. Under Direct I/O there is no readahead. Each reader submits a request, waits for it, and submits the next, so device utilization depends directly on how many readers are in flight. That changes the math in two cases:
-
Dense NVMe families. On AWS we treat i8g, i8ge, i7i, and i7ie as dense NVMe. They carry a lot of local storage relative to compute, and each device only reaches its ceiling with many outstanding requests. Under Direct I/O on these, we use the full vCPU count.
-
Very small boxes. On a 2 vCPU server, half the vCPUs would mean one reader. One synchronous direct reader with no readahead would leave the device mostly idle, so for two vCPUs or fewer we also use the full count.
Everywhere else, a generic NVMe instance with more than two vCPUs, half the vCPUs as readers is the right trade. Doubling it would cost Postgres CPU for little extra backup throughput. More readers in flight means the backup finishes sooner and the database's own reads wait behind more backup requests in the device queues while it runs; the measurements below show both sides.
For an i8ge.12xlarge, 48 vCPU, 384 GiB RAM, four instance-store drives, the generator writes:
| Key | Value | Why |
|---|---|---|
| WALG_COMPRESSION_METHOD | lz4 | cheap CPU, good enough ratio for heap pages |
WALG_UPLOAD_DISK_CONCURRENCY | 48 | dense NVMe under Direct I/O uses the full vCPU count |
| WALG_UPLOAD_CONCURRENCY | 4 | fixed uploader count |
| WALG_UPLOAD_QUEUE | 2 | fixed queue depth |
| WALG_S3_MAX_PART_SIZE | 67108864 (64 MiB) | 5% of RAM budget, clamped to the 64 MiB ceiling |
| WALG_DOWNLOAD_CONCURRENCY | 48 | restore path, one stream per core |
| WALG_DIRECT_IO | true | skip the page cache |
WALG_DIRECT_IO_BLOCK_COUNT | 1024 | 4 drives x 256 blocks, 4 MiB per read |
Workload protection: cgroups plus direct I/O
A backup competes with the database for three things: CPU, memory, and the drives. We put a boundary on each, and Direct I/O is the boundary for the last one.
-
CPU. The backup runs in its own cgroup, started with systemd-run --scope at CPUWeight=25 against the default weight of 100. When the machine is busy, the scheduler gives Postgres four times the CPU share of the backup; when it is idle, the backup can use what is free. Compression is the expensive part, and lz4 keeps it cheap.
-
Memory. wal-g's upload buffers are sized from the machine: peak parts in flight times the part size is held to 5% of RAM, and the process lives in the same bounded slice as the other supporting services we described in our post on process budgets.
-
Page cache and the drives. Direct I/O. Backup reads never enter the page cache, so what Postgres put there stays there, and nothing is copied through the kernel on the way to the compressor.
The CPU saving is measurable. In the runs below, whole-box CPU went from 36% busy to 65% during the buffered backup and to 60% during the stripe-sized Direct I/O backup: about 860 core-seconds of work against about 1,000, roughly 14% less CPU for the same backup.
Seeing it on real hardware
We checked this on a live box: an i8ge.12xlarge in us-east-1, four instance-store NVMe drives in a 512 KiB-chunk RAID0, Postgres 18.6 with shared_buffers = 96GB, upstream wal-g v3.0.9, and a 467 GB pgbench database, larger than the machine's 384 GiB of RAM. Backups upload to S3 in the same region and compress about 9x with lz4.
Two things stand in for real workloads. Sixteen clients run point lookups over a quarter of the accounts table for the whole run, a working set larger than shared_buffers, so part of every lookup is served from the OS page cache. And a separate 40 GiB table is read into the page cache before each run and then left alone, standing in for data that was warm a few minutes ago. fincore reports how much of it is still resident.
Each arm starts from the same state: caches dropped, Postgres restarted, the idle table and the hot index range read into the page cache, five minutes of workload to fill shared_buffers. Then three minutes of baseline, the backup, and three minutes after. The backup runs under CPUWeight=25 in every arm, as in production. Only the wal-g read path changes:
| Arm | wal-g settings |
|---|---|
| A, buffered | page cache reads, 24 disk readers (vCPU/2), the pre-Direct-I/O configuration |
| B, Direct I/O default | WALG_DIRECT_IO=true, wal-g's default 32-block (128 KiB) reads, 24 readers |
| C, production knobs | WALG_DIRECT_IO=true, WALG_DIRECT_IO_BLOCK_COUNT=1024 (4 MiB), 48 readers (dense NVMe rule) |
| D, stripe-sized, fewer readers | as C but 24 readers, the non-dense rule, to separate read size from reader count |
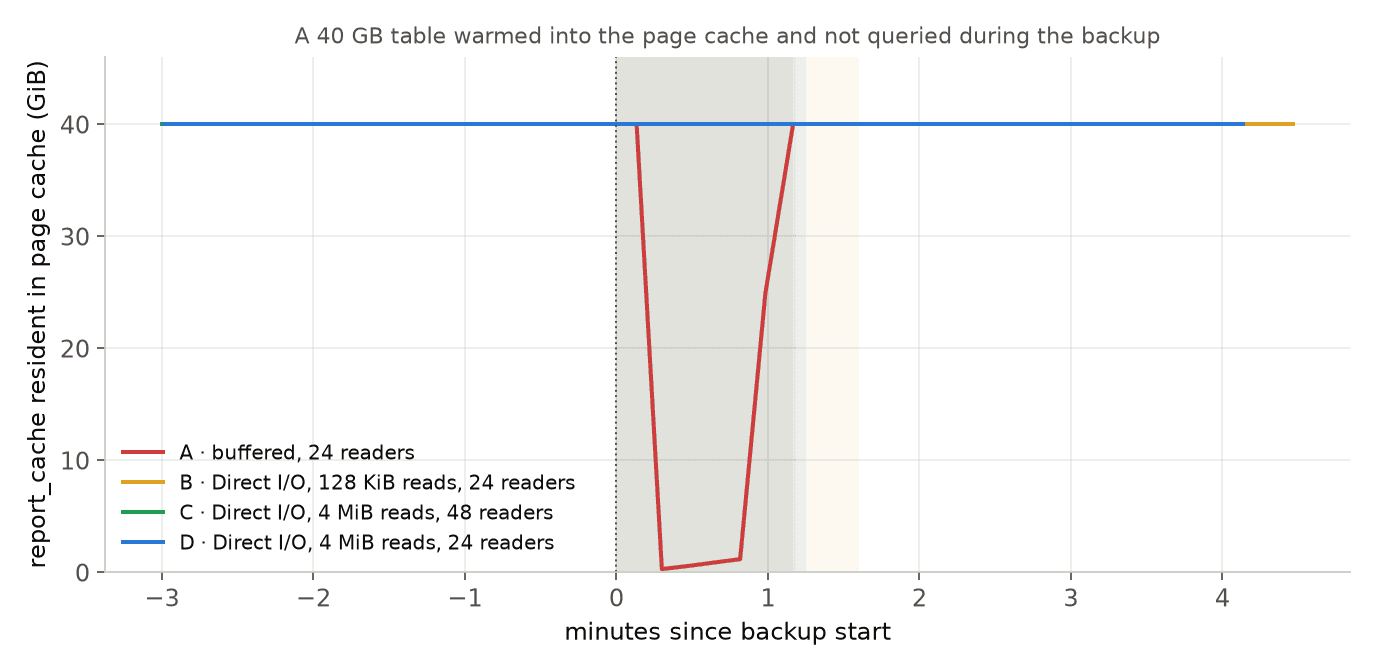
The warm-but-idle table, aligned to the moment the backup starts. With buffered reads the table is gone within twenty seconds of the backup starting. It reappears near the end only because the backup itself reads those files a minute later, and those copies sit on the kernel's use-once list, first in line to be evicted again. The three Direct I/O arms never touch it.
The eviction is total and fast. Twenty seconds into the buffered backup, 0.3 GiB of the 40 GiB table was still in memory. The pages the workload was hammering fared better, because the kernel keeps the busiest pages, though after the buffered backup finished the workload was still reading from disk at four times its baseline rate, and its p99 stayed three times higher for the next two and a half minutes while the cache refilled. In the Direct I/O arms the idle table stays at 40 GiB throughout, and latency returns to baseline the moment the backup ends.
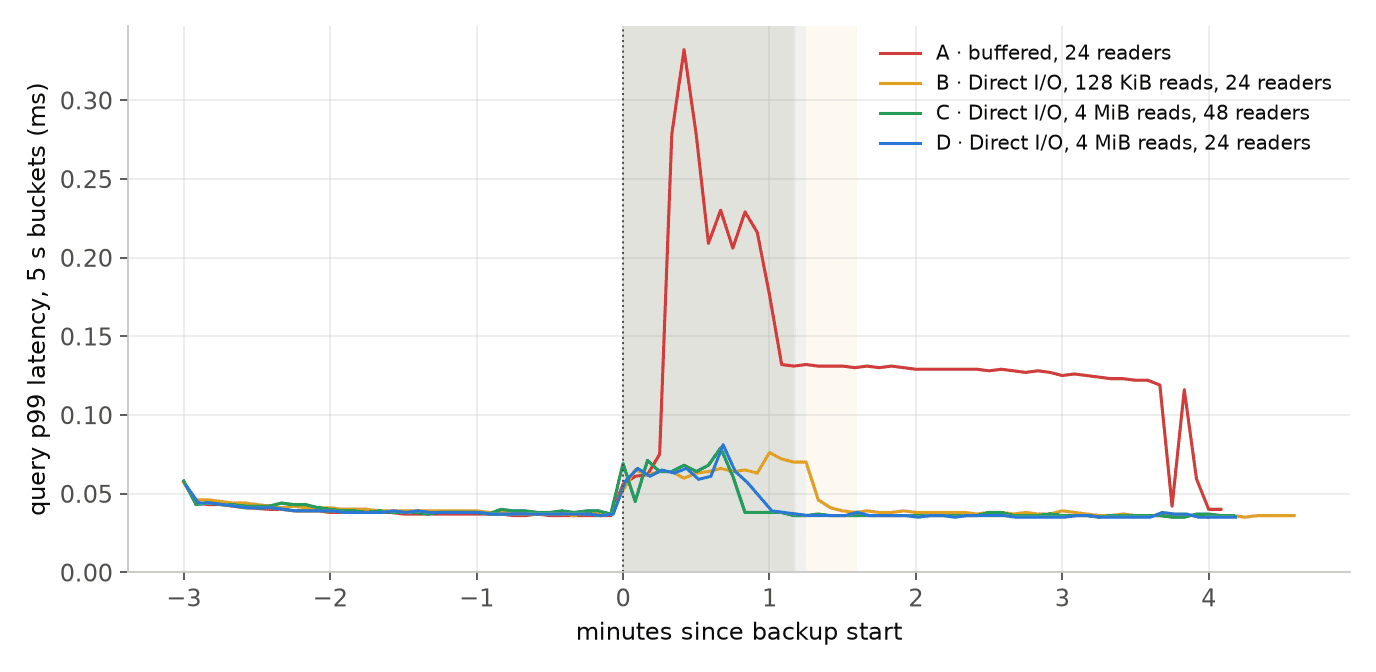
p99 latency of the point lookups in 5 second buckets. The buffered backup takes p99 from 0.04 ms to a peak of 0.33 ms and leaves it at 0.13 ms for minutes afterwards. The Direct I/O backups hold it near 0.06 ms while they run and hand it straight back.
Every backup costs the database something while it runs, because it reads from the same drives and compresses on the same CPUs. Buffered reads pushed p99 to 4.7 times baseline during the backup and left a long tail of cold reads afterwards. Direct I/O reads pushed it to 1.5 times baseline and left nothing behind. The buffered arm also used more CPU (65% busy against 60%), so the extra latency comes from page cache churn and the cold reads that follow it.
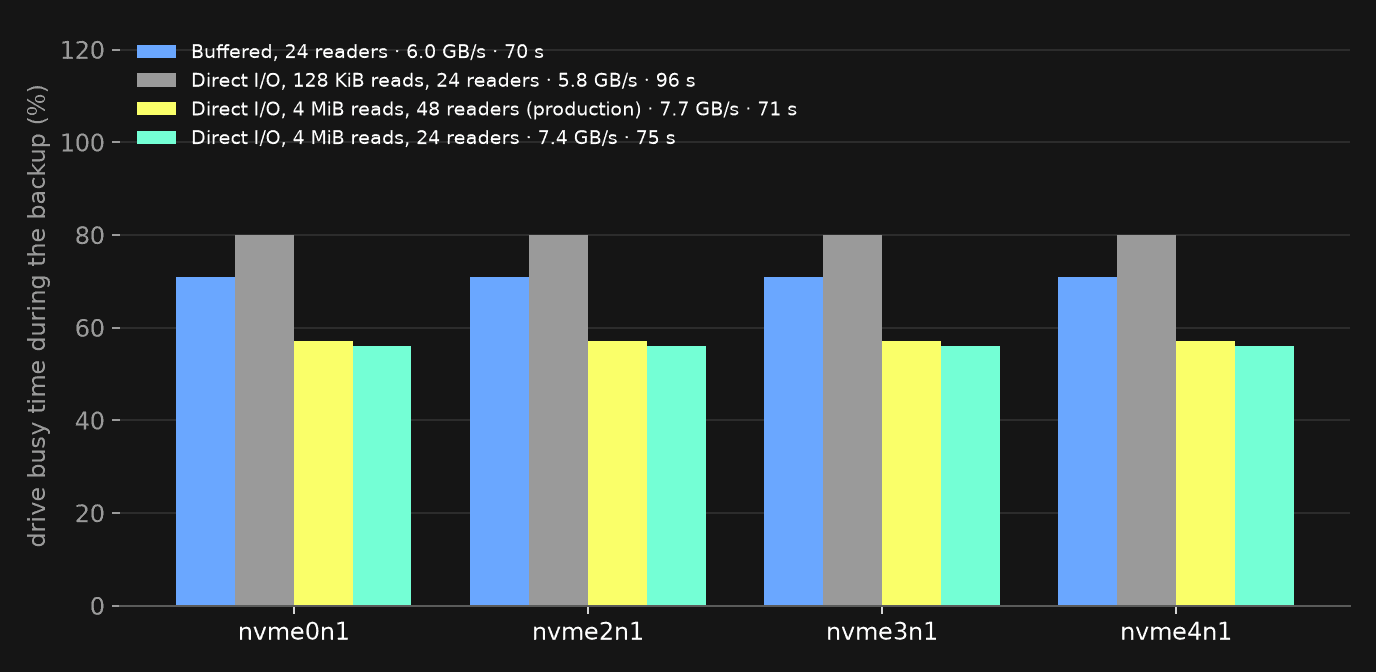
How busy each of the four NVMe drives was for the duration of the backup, with the array read rate and wall time per arm. Small direct reads keep the drives the busiest while moving the least data. Stripe-sized reads move more data per unit of busy time, so the array has more headroom left for the database.
With 24 readers in flight, even 128 KiB direct reads keep all four drives busy; the single-drive picture in the diagram above is one reader's view. The cost of small reads shows up as efficiency: the small-read arm pushes 5.8 GB/s at 80% busy time, while the 4 MiB arms push 7.4 to 7.7 GB/s at 56%. Fewer, larger requests get more out of each drive and leave more of its time free for queries. The backup took 96 seconds with default reads, 71 with stripe-sized reads and 48 readers, and 75 with 24 readers. On this box the read size did most of the work, and the dense-NVMe rule buys a few seconds of backup time for a few more readers in the queue.
| Arm | Backup wall time | Read from disk | Idle table evicted | Queries/s during backup | Query p99 during backup |
|---|---|---|---|---|---|
| A, buffered | 70 s | 6.0 GB/s | 40 GiB | 469k | 0.18 ms |
| B, Direct I/O default | 96 s | 5.8 GB/s | 0 GiB | 542k | 0.06 ms |
| C, production knobs | 71 s | 7.7 GB/s | 0 GiB | 544k | 0.06 ms |
| D, stripe-sized, 24 readers | 75 s | 7.4 GB/s | 0 GiB | 555k | 0.06 ms |
| No backup running | 581k | 0.04 ms |
The stripe effect on its own
The arms above run through wal-g's whole pipeline, with compression and an upload behind the reads. To see the RAID0 fan-out by itself we also ran fio against the array with synchronous reads, the way wal-g's Direct I/O reader issues them, varying only the read size and the number of readers.
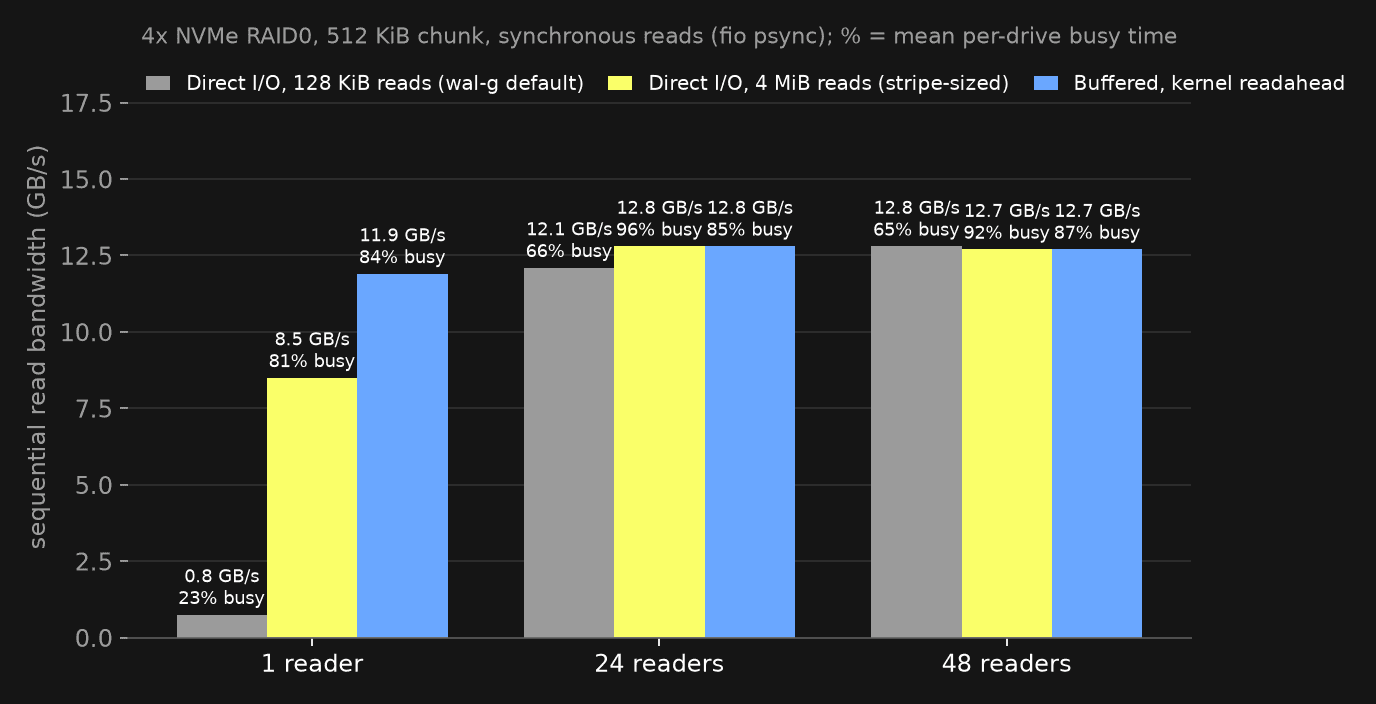
Sequential read bandwidth from the array. A single 128 KiB direct reader gets 0.8 GB/s with each drive busy about a quarter of the time. The same reader at 4 MiB gets 8.5 GB/s with every drive busy.
One reader tells the story the diagrams describe: 128 KiB direct reads touch one drive at a time and reach 0.8 GB/s, while 4 MiB reads span the stripe and reach 8.5 GB/s from the same drives. Buffered reads land near the top too, because kernel readahead does the batching for them. With 24 or 48 readers in flight, even small reads saturate the array, at the cost of many more requests and a busier device queue. A larger read size lets a modest number of readers do the job, which is the trade the reader-count rule makes.
How this lands in production
All of this is generated per server. The config generator takes the server's vCPU count, memory, drive count, and whether it is on a dense NVMe family, and writes the result to /etc/postgresql/wal-g.env next to the bucket prefix. The backup and restore tooling reads that file.
Direct I/O support arrived in a wal-g release and reached our fleet when we rotated the machine image that carries wal-g, alongside the other backup improvements we shipped this year. Servers built from the new image get the Direct I/O lines in their generated config. The backup schedule and the restore path did not change.
There are two feature flags as escape hatches. One turns off the Direct I/O lines and falls back to buffered reads with vCPU/2 readers. The other falls back further to wal-g's defaults. Both exist because a read path this close to the database deserves a way to back out quickly if a kernel, driver, or instance type behaves unexpectedly.
What's next: backing up only what changed
Every run above is a full backup. It reads all 467 GB and uploads 54 GB of compressed output whether one row changed since yesterday or a billion did. For a multi-terabyte database that is the largest line in the cost of keeping backups. We are prototyping incremental backups now: read the data directory, find the pages that changed since the last backup, upload only those, so a day's backup costs the size of a day's changes.
The read path in this post carries over unchanged. An incremental backup still reads a live data directory to find what changed, off the same drives, beside the same queries. Direct I/O, stripe-sized reads, and the cgroup weights let it do that without the database noticing, whether the upload is 54 GB or 500 MB.
The takeaway
The hard part of a backup happens locally: reading every byte of a live data directory off the drives Postgres is serving from. Buffered reads push the database's warm pages out of the page cache. Direct I/O skips the cache and, because it also skips readahead, loses throughput on RAID0. Stripe-sized reads scaled to the drive count, and reader counts that account for dense NVMe, put the throughput back.
The result is a backup that leaves the page cache to Postgres, keeps every drive in the array busy, and finishes as fast as the buffered backup it replaced. Every ClickHouse Managed Postgres server ships with this by default. Provision a Postgres and see it in action: ClickHouse Managed Postgres
Get started with ClickHouse Managed Postgres today
Interested in seeing how ClickHouse Managed Postgres works on your data? Get started with ClickHouse Cloud in minutes and receive $300 in free credits.
Sign up