50.3k
50.3k
A faster way to start a Datadog migration
Migrating an observability platform can involve much more than changing where your data is stored. Datadog agents and SDKs may already be deployed across thousands of applications, hosts, virtual machines, and Kubernetes pods. Replacing all of that instrumentation before evaluating another backend creates a substantial project at the start of a migration.
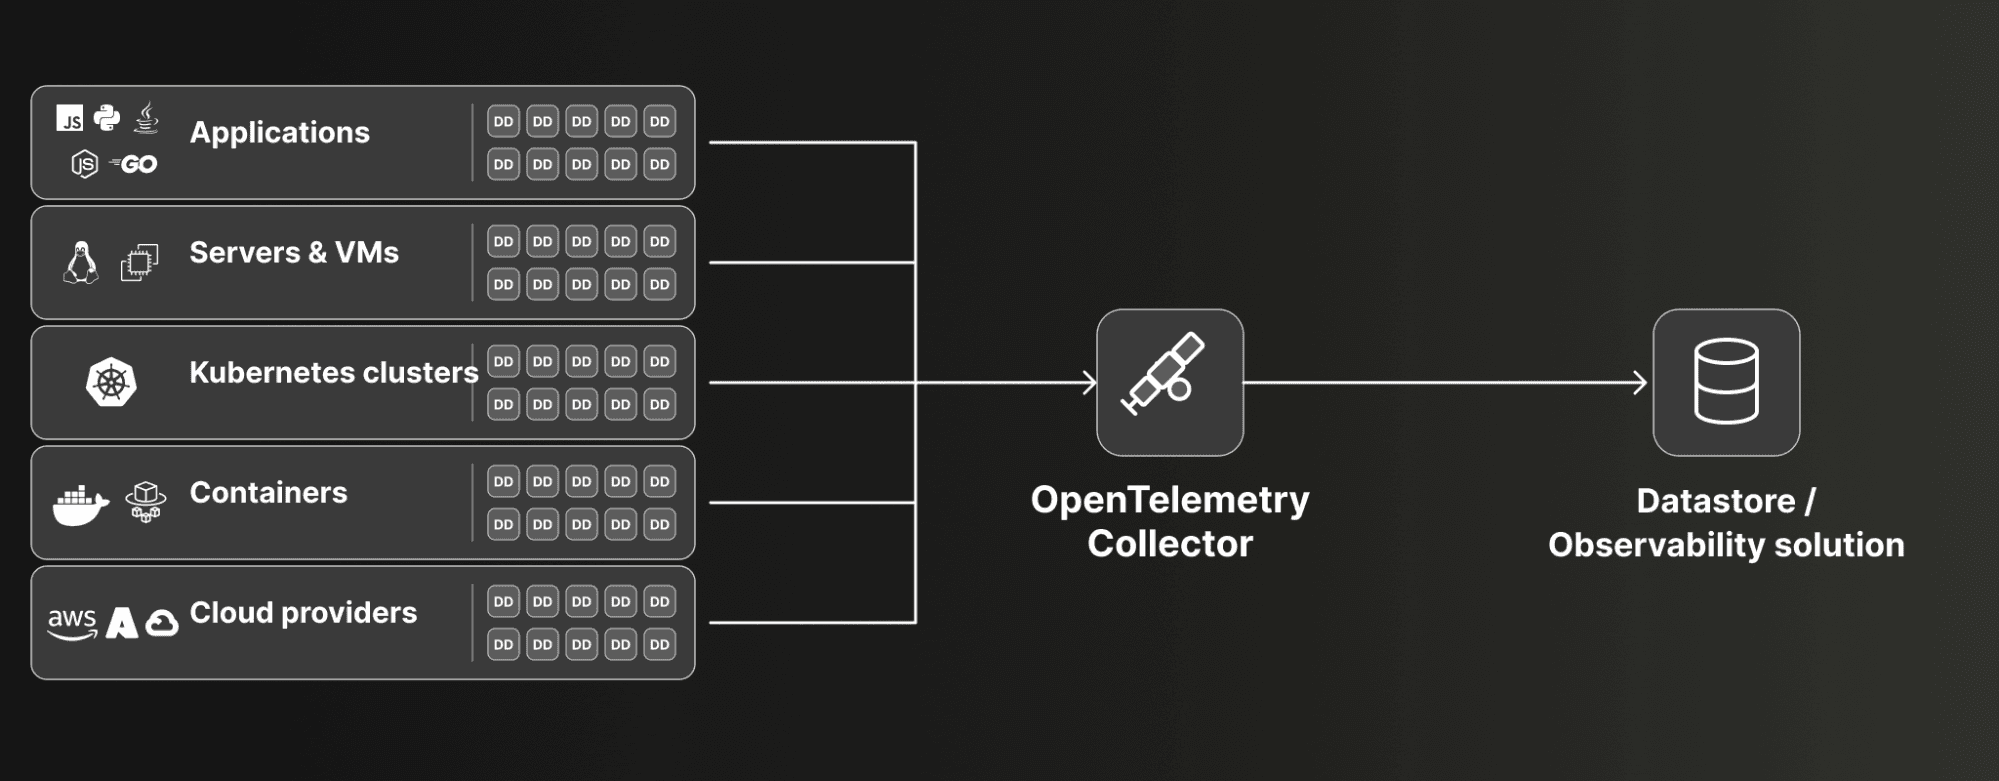
With recent improvements to the Datadog receiver for the OpenTelemetry Collector, applications can keep their existing Datadog SDKs, while deployed agents can be reconfigured to send telemetry to the receiver using Datadog’s native protocols. The receiver translates logs, traces, and metrics into the OpenTelemetry data model and passes them through the standard Collector pipeline.
Once in that pipeline, the telemetry can be filtered, transformed, batched, and exported to any supported destination. Teams can keep the collection infrastructure they already operate while evaluating another observability backend or beginning a wider migration.
In this post, we’ll look at the improvements to the Datadog receiver and how they simplify migration to destinations supported by the OpenTelemetry Collector, using ClickStack as a worked example.
Why teams move telemetry out of Datadog
For many teams, the reason to move observability data out of Datadog is cost. Log and trace volumes rise as applications grow and more services are instrumented. At scale, teams are left choosing between higher spend and retaining less of the telemetry they produce.
Cost constraints then shape what is available during an investigation. Teams may sample traces, leave logs unindexed, roll up metrics, or shorten retention. Each of these controls reduces the context that engineers can query when they need to understand what happened.
ClickStack provides one example of how a different storage architecture changes this calculation. It is the out-of-the-box, open-source observability platform built on ClickHouse, combining an OpenTelemetry-native ingestion pipeline with a purpose-built interface for logs, metrics, and traces. It provides search, dashboards, alerting, trace exploration, and AI-assisted investigations. For large log and tracing workloads, ClickStack can be over 100x more cost-efficient than Datadog. This allows teams to set retention according to their operational requirements and keep the events they may need later.
Full-fidelity telemetry is especially useful for agentic investigations. An agent cannot reason about an event that was discarded before the investigation began. It also needs sufficient history to compare a current incident with earlier failures, behavioral changes, and longer-running patterns.
Clever’s migration illustrates the difference. Its 400 services and 200 AWS Lambda functions generate around 150 TB of uncompressed logs each month. With Datadog, Clever indexed 10% of those logs and retained them for three days. After moving the workload to ClickHouse Cloud, it indexed all of its logs, increased retention to 60 days, and achieved a 10x compression ratio. Its engineers gained 200 times more searchable log data with no increase in cost.
“With ClickHouse, we see a compression ratio of 10x... These logs are easily accessible to all engineers; they don't have to think about whether to go to Grafana, Athena, Datadog, or whatnot. And all of this came at a 0% increase in cost.”
Jake Gutierrez, Senior Software Engineer at Clever
The hidden cost of changing observability platforms
While the economics may be compelling, reaching them can look daunting. A large organization may have hundreds of applications instrumented with Datadog SDKs and thousands of Datadog agents deployed across hosts, Kubernetes clusters, and virtual machines. Replacing this with instrumentation and an OpenTelemetry-based collection layer can become a substantial project of its own.
This involves more than replacing one agent with another. Teams may need to deploy and configure OpenTelemetry Collectors, update application instrumentation, recreate log processing and routing rules, and verify that fields and correlations survive the change. Application and infrastructure teams often work to different release schedules, making a coordinated migration difficult to complete quickly.
For teams already committed to standardizing on OpenTelemetry, this work is worthwhile. For others, it may be too much to take on alongside a platform migration. Teams should also be able to evaluate a new observability platform before making that commitment. Separating the collection-layer migration from the platform migration lets them evaluate the platform quickly, then decide independently whether to adopt OpenTelemetry or continue using their existing collection infrastructure.
Keep your Datadog agents while you evaluate a new stack
In a typical OpenTelemetry deployment, telemetry is sent to an OpenTelemetry Collector before it is stored in the target data store or observability solution. The Collector receives data from agent-mode Collectors, such as those collecting Kubernetes metrics and logs, or OpenTelemetry SDKs instrumenting applications. The collector applies any required filtering or transformations, batches events, and sends these to the target destination.
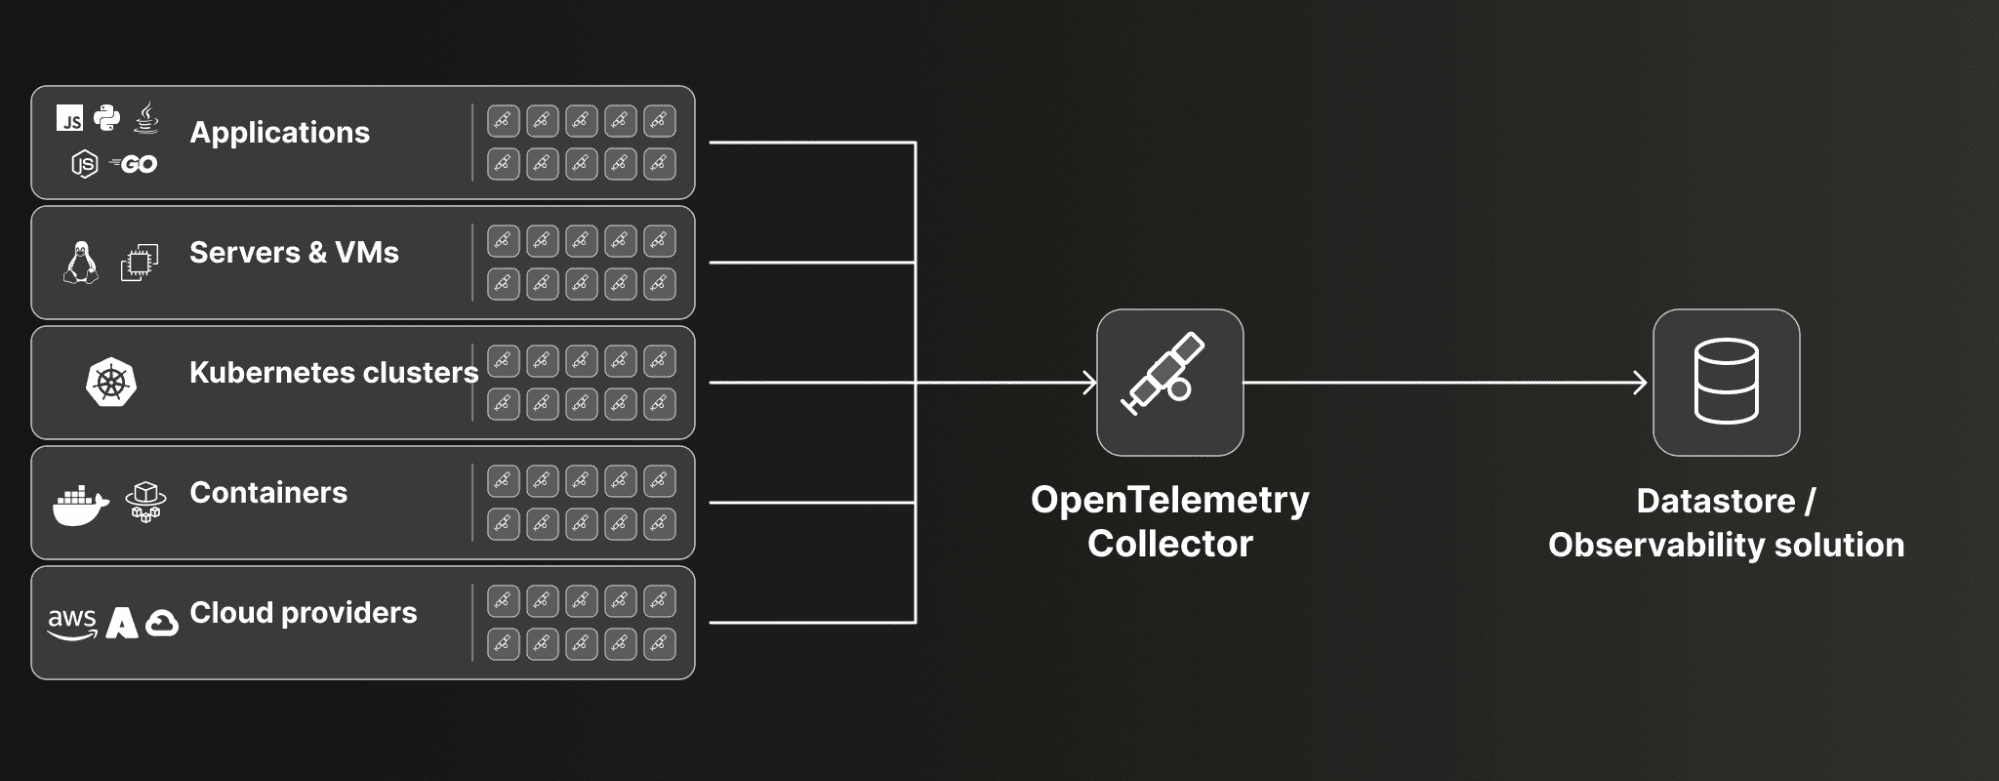
Collectors can be deployed in different ways. An agent-mode Collector can run close to an application or host, while centralized gateway Collectors receive data from many agents over OTLP. At larger scales, this gateway layer provides a central place to manage processing, routing, and batching.
The Datadog receiver adds another input to this architecture. The receiver has been part of the OpenTelemetry Collector Contrib distribution for some time and exposes an endpoint that understands the protocols used by Datadog agents and SDKs. It converts the incoming Datadog payloads into the OpenTelemetry data model, after which they pass through the normal Collector pipeline.
Existing Datadog agents can therefore be reconfigured to send logs and traces to the receiver running on a centralized OpenTelemetry Collector. Applications can keep their existing Datadog SDKs, and the agents already deployed across the infrastructure remain in place.
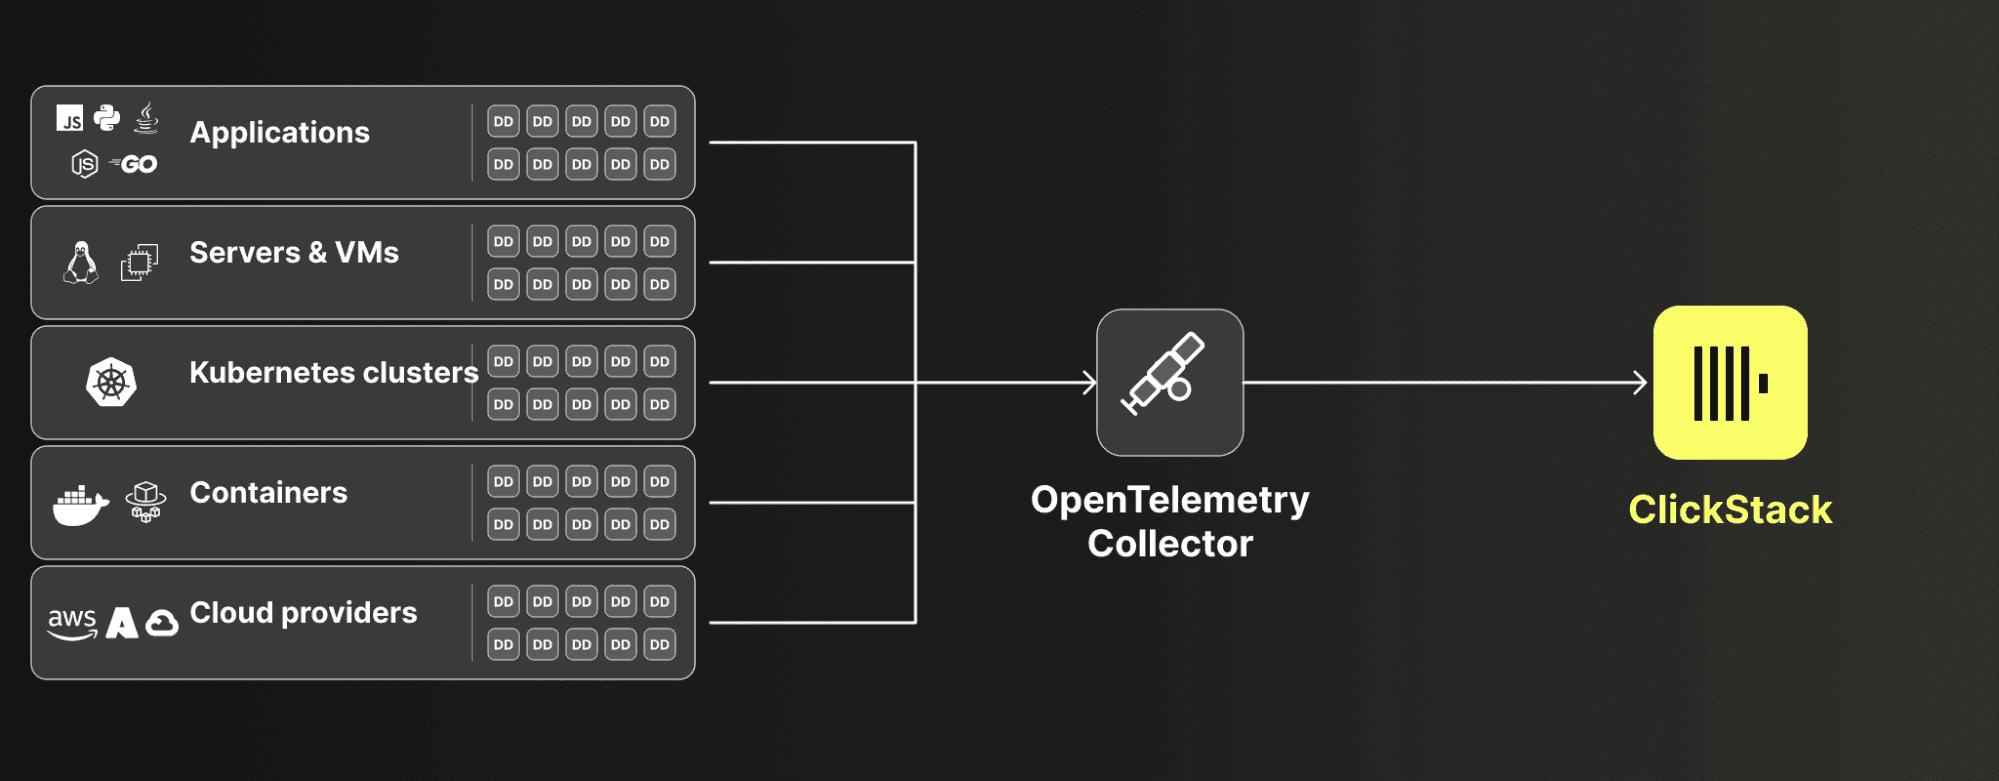
Once Datadog telemetry enters the Collector pipeline, it can be processed and exported to any supported destination. Teams can keep their existing Datadog agents and SDKs while changing the storage and analysis backend. This can remain their collection path or support an incremental move to OpenTelemetry instrumentation over time.
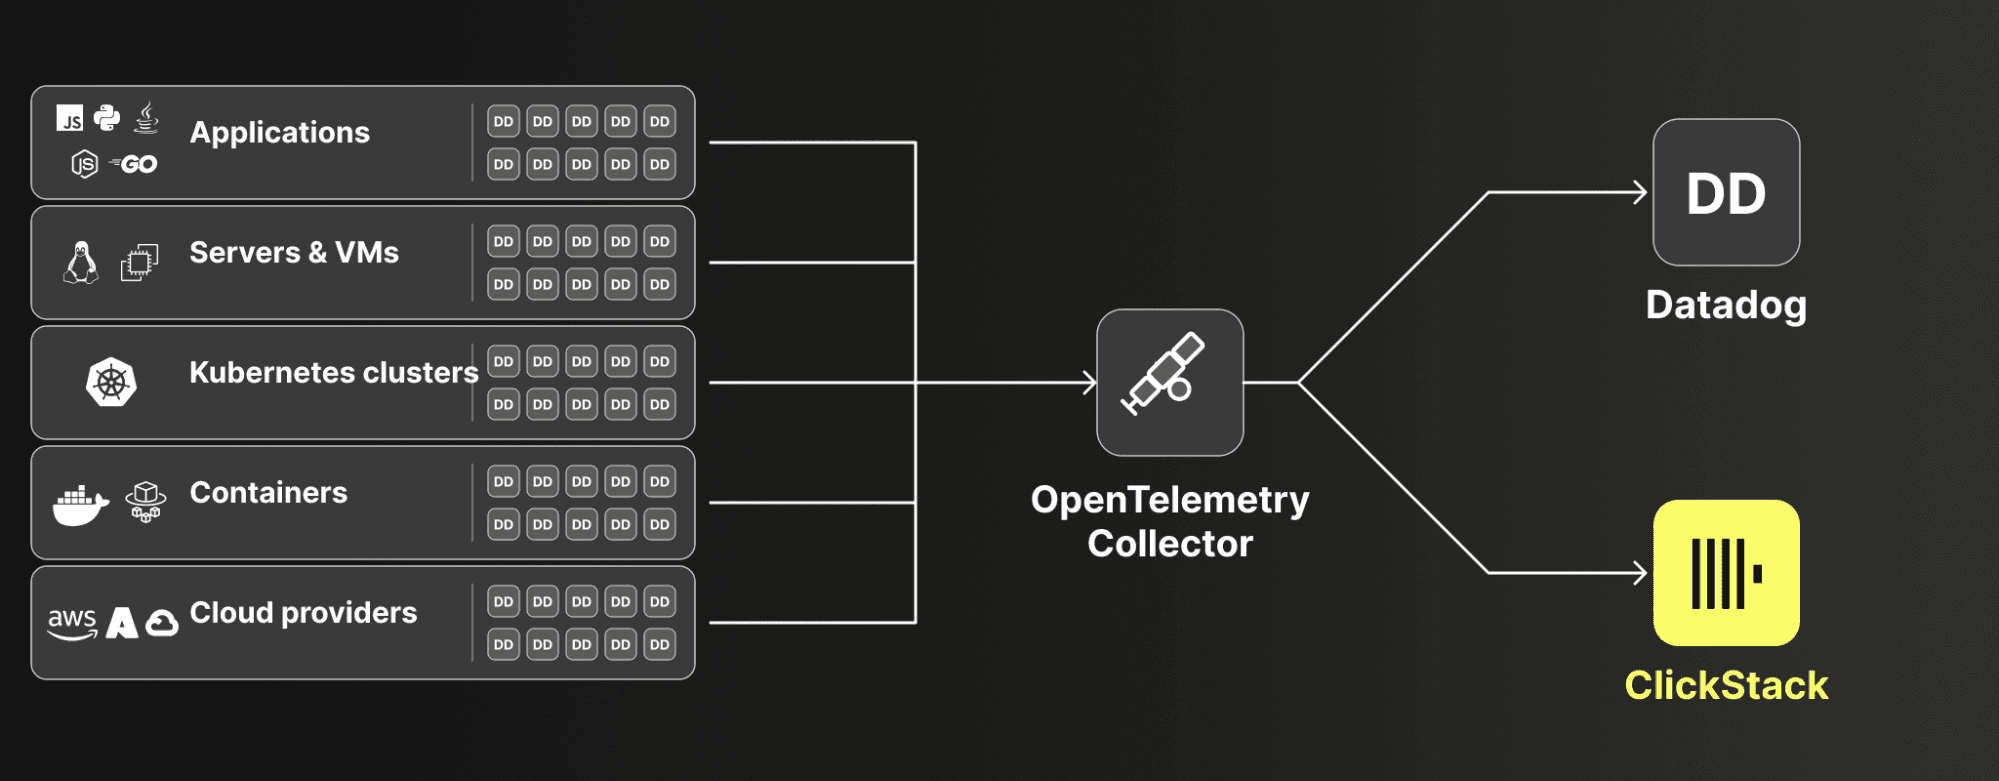
The same setup makes evaluation easier. A Collector pipeline can use multiple exporters, allowing teams to send the same telemetry to their existing platform and a new destination, such as ClickStack, in parallel. They can compare both platforms using the same data before deciding whether to migrate.
Worked example with ClickStack
In the example below, we use ClickStack to show how telemetry from existing Datadog agents and SDKs can be migrated to another observability backend.
For this, we use the ClickStack distribution of the OpenTelemetry Collector, published as clickhouse/clickhouse-otel-collector. We maintain this distribution with defaults optimized for ClickHouse, and it includes the Datadog receiver configured to listen on port 8126.
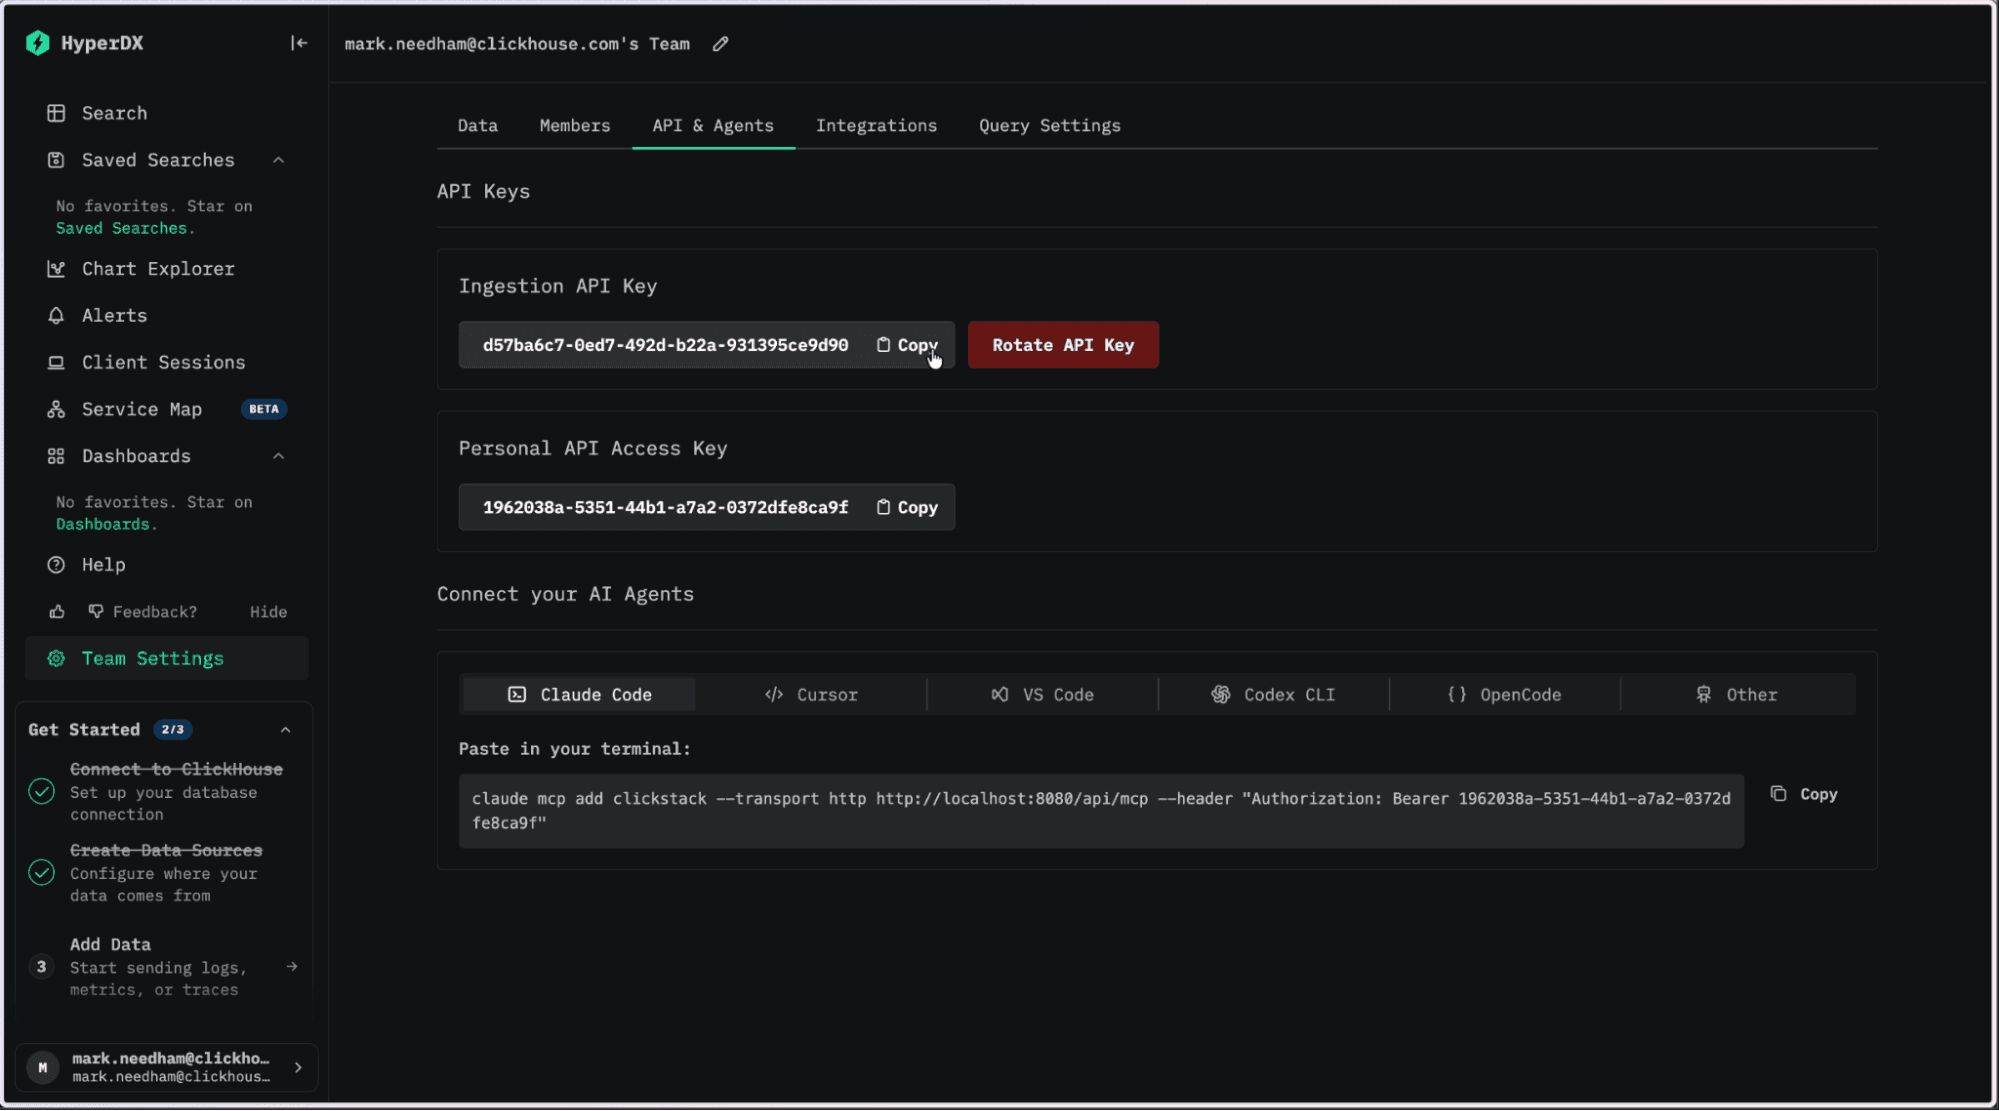
ClickStack secures ingestion using the ingestion API key provided in the HyperDX interface. We pass this value to the Datadog agent/SDK as its API key, allowing the ClickStack Collector to authenticate incoming telemetry before accepting it.
The following example shows how to start the Collector, configure the Datadog agent, and send logs and traces into ClickStack.
This demo will use the Hacker News demo app. If you want to follow along, you’ll need to clone the datadog-instrumentation branch:
git clone --branch datadog-instrumentation https://github.com/ClickHouse/hn-news-analyzer.gitYou’ll then need to follow the instructions in the README to run the app.
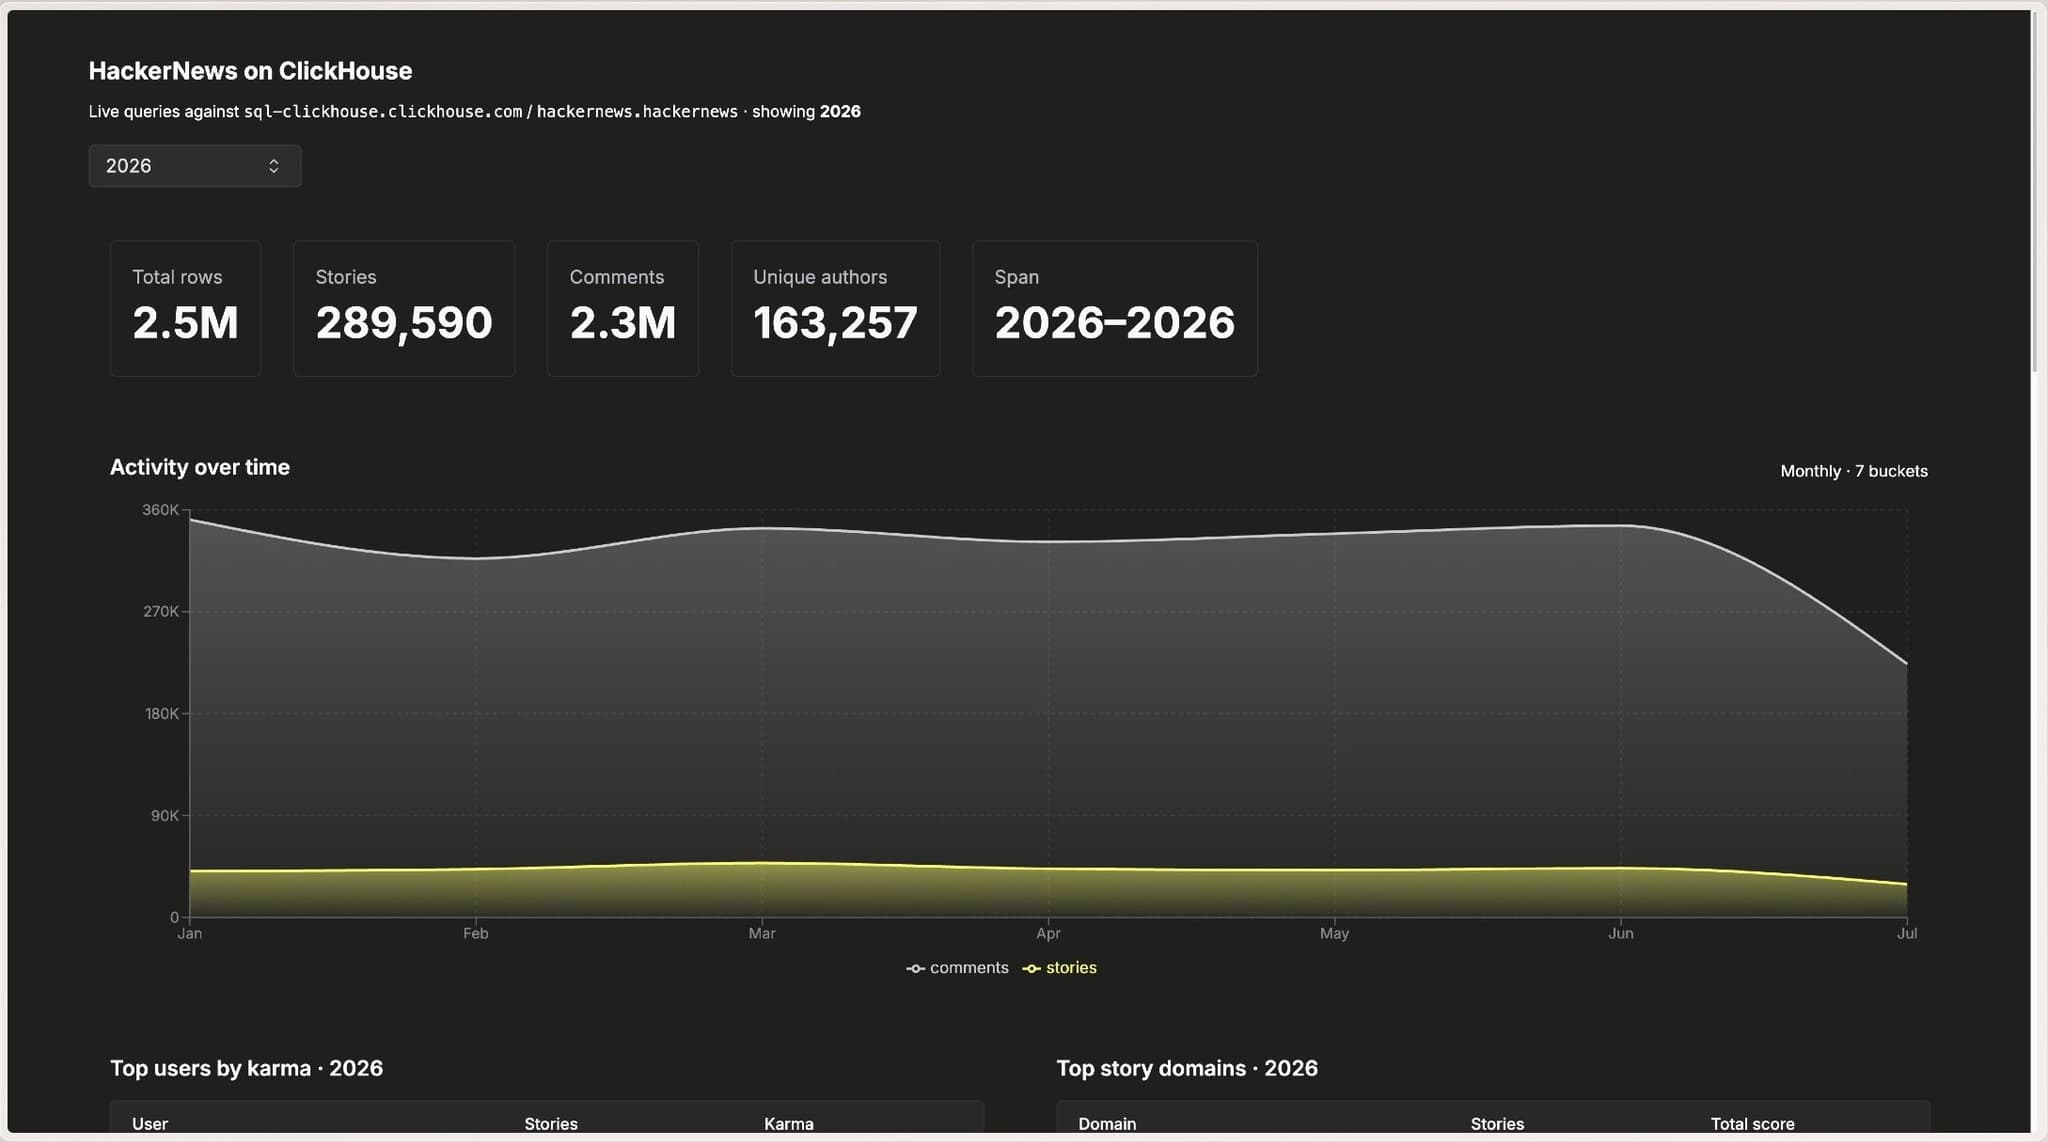
A screenshot of the HackerNews app
Once you’ve done that, launch ClickStack, using the all-in-one image. This image includes both ClickHouse, the ClickStack UI (HyperDX), and the ClickStack distribution of the Open Telemetry collector:
docker run --name clickstack \
-p 8080:8080 \
-p 8123:8123 \
-p 4317:4317 \
-p 4318:4318 \
-p 127.0.0.1:18126:8126 \
-e ENABLE_DATADOG_RECEIVER=true \
clickhouse/clickstack-all-in-one:latestHere, we map port 8126 on the Collector container to port 18126 on the host. The Datadog receiver is therefore available at http://127.0.0.1:18126. We also need to enable the Datadog receiver with the environment variable ENABLE_DATADOG_RECEIVER.
Next, we’ll install the Datadog agent. On a Mac, you can do this by running the following command:
DD_SITE="datadoghq.com" bash -c "$(curl -L https://install.datadoghq.com/scripts/install_mac_os.sh)"Once that’s downloaded, we’ll update /opt/datadog-agent/etc/datadog.yaml to send traces and logs to the ClickStack OTel collector.
api_key: "<YOUR_CLICKSTACK_INGESTION_KEY>"
# Metrics destination
dd_url: "http://127.0.0.1:18126"
# ClickStack currently supports the Datadog v2 metrics intake.
use_v3_api:
series:
enabled: false
# Trace destination
apm_config:
enabled: true
apm_dd_url: "http://127.0.0.1:18126"
# Log destination
logs_enabled: true
logs_config:
logs_dd_url: "http://127.0.0.1:18126"
force_use_http: true
# These require Datadog's backend, which we aren't using, so we disable them.
remote_updates: false
remote_configuration:
enabled: falseWe can get the API key by navigating to the ClickStack UI, selecting our user in the bottom-left corner, going to Team Settings > API and Agents, and copying the Ingestion API Key.
Once we’ve updated that config, we’ll need to restart the Datadog agent:
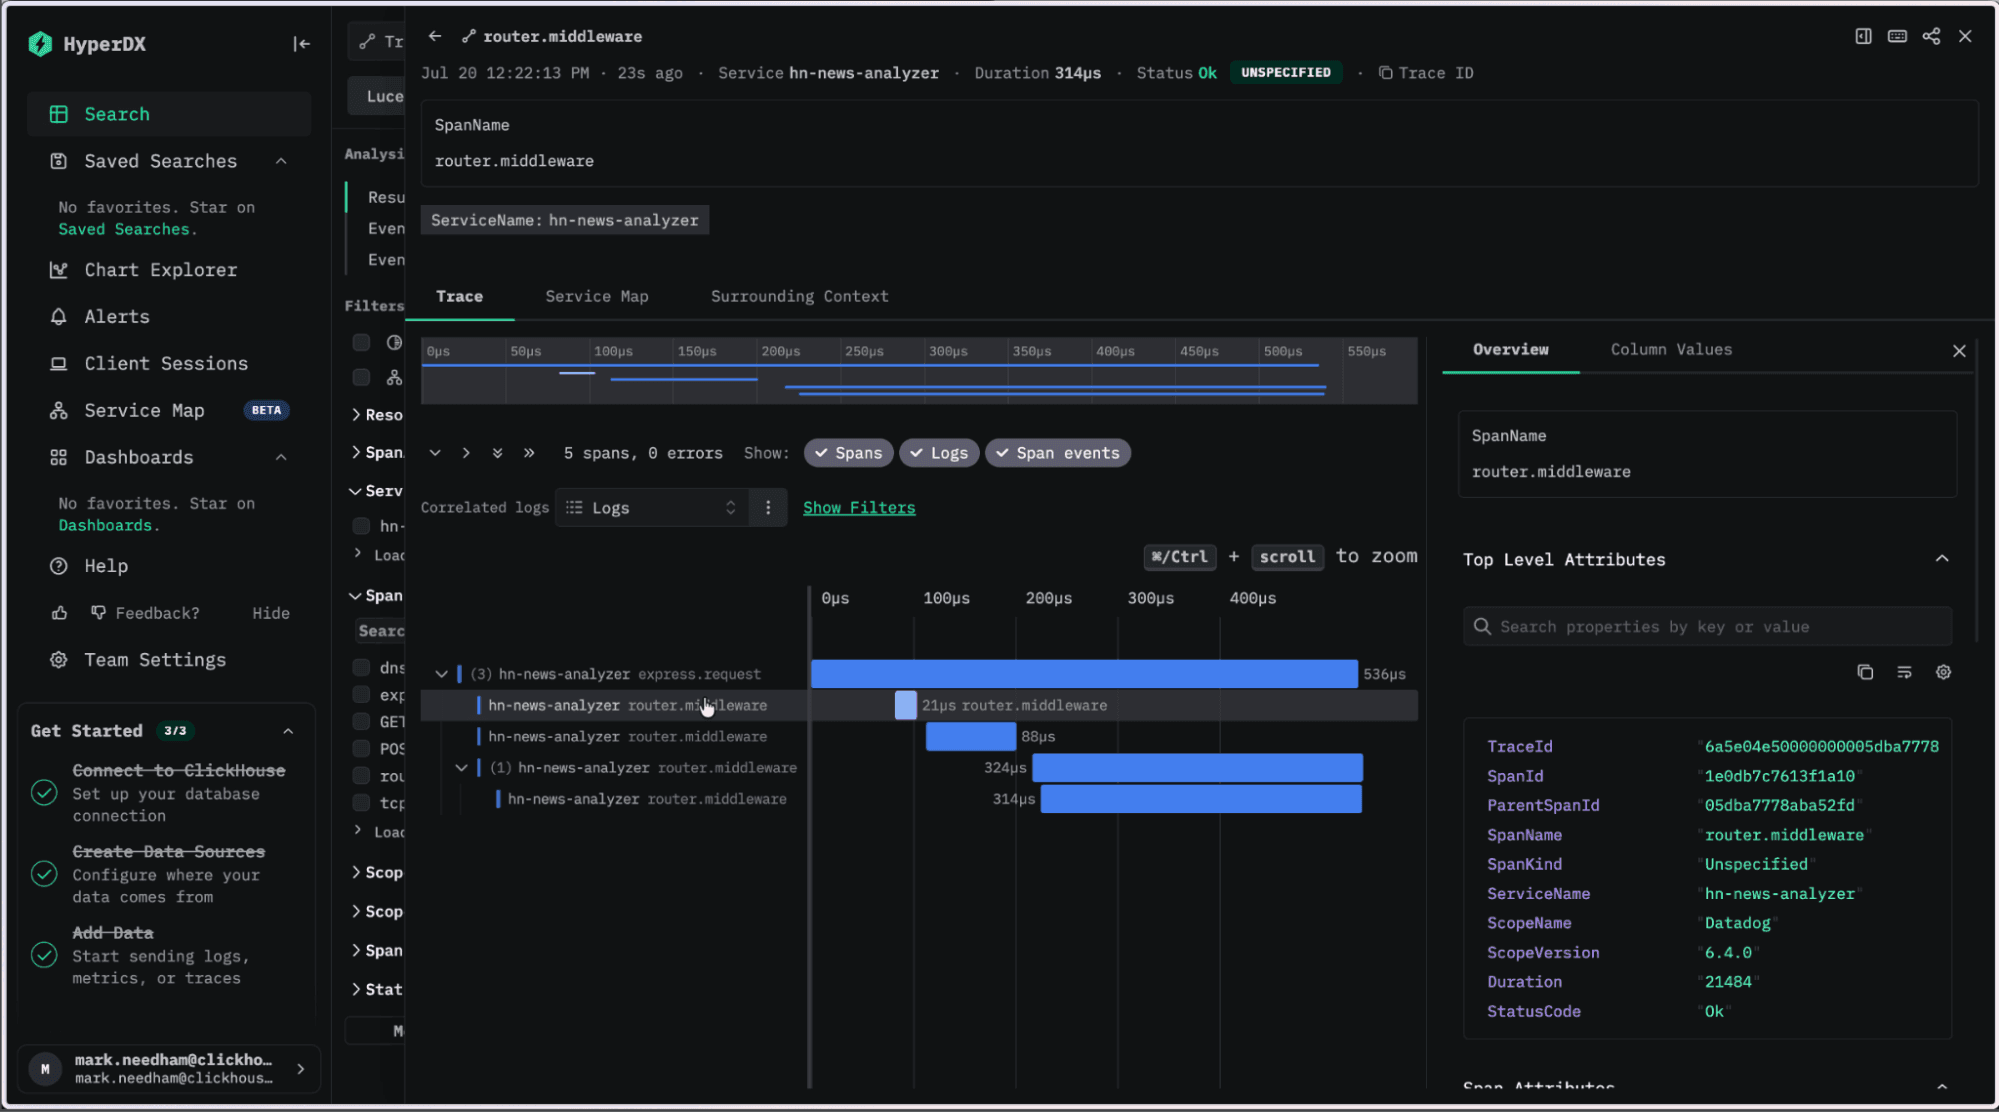
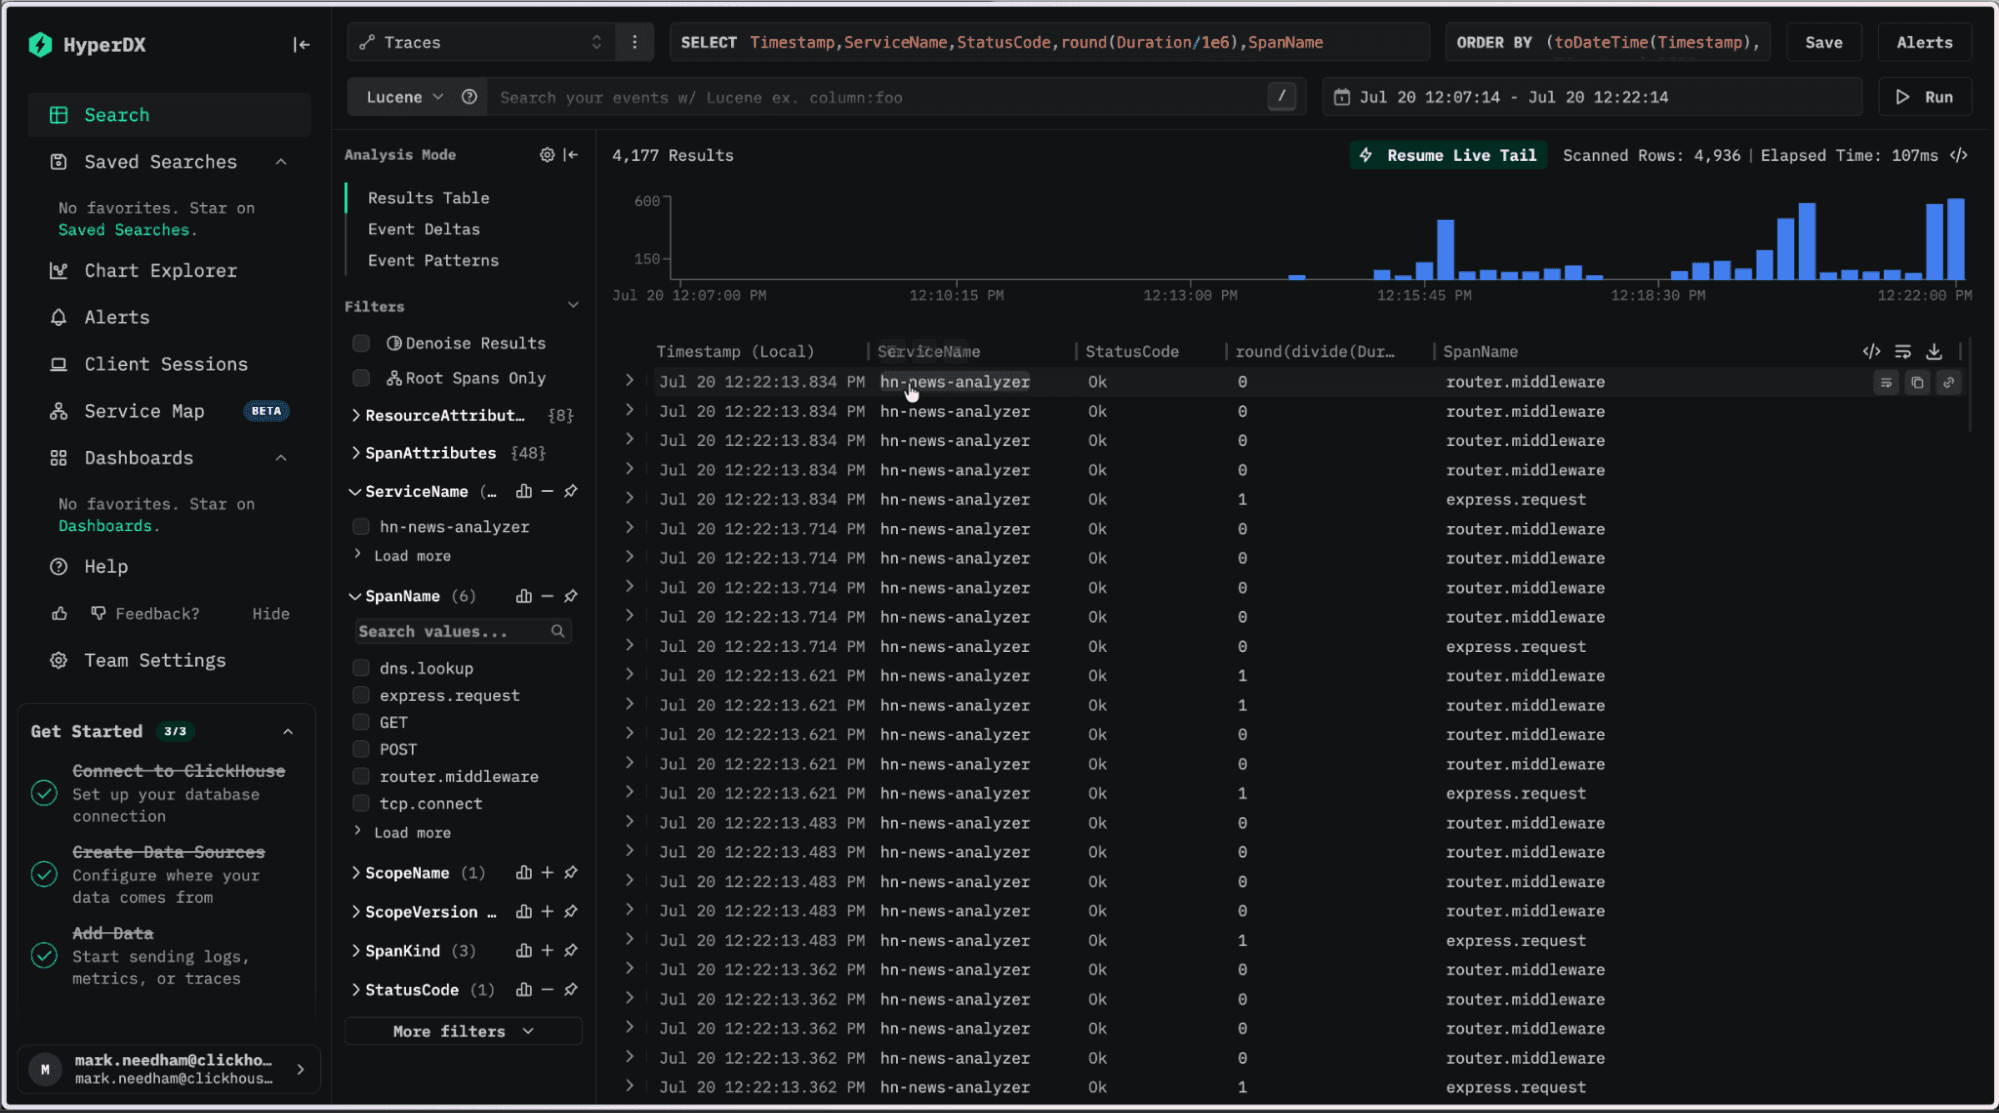
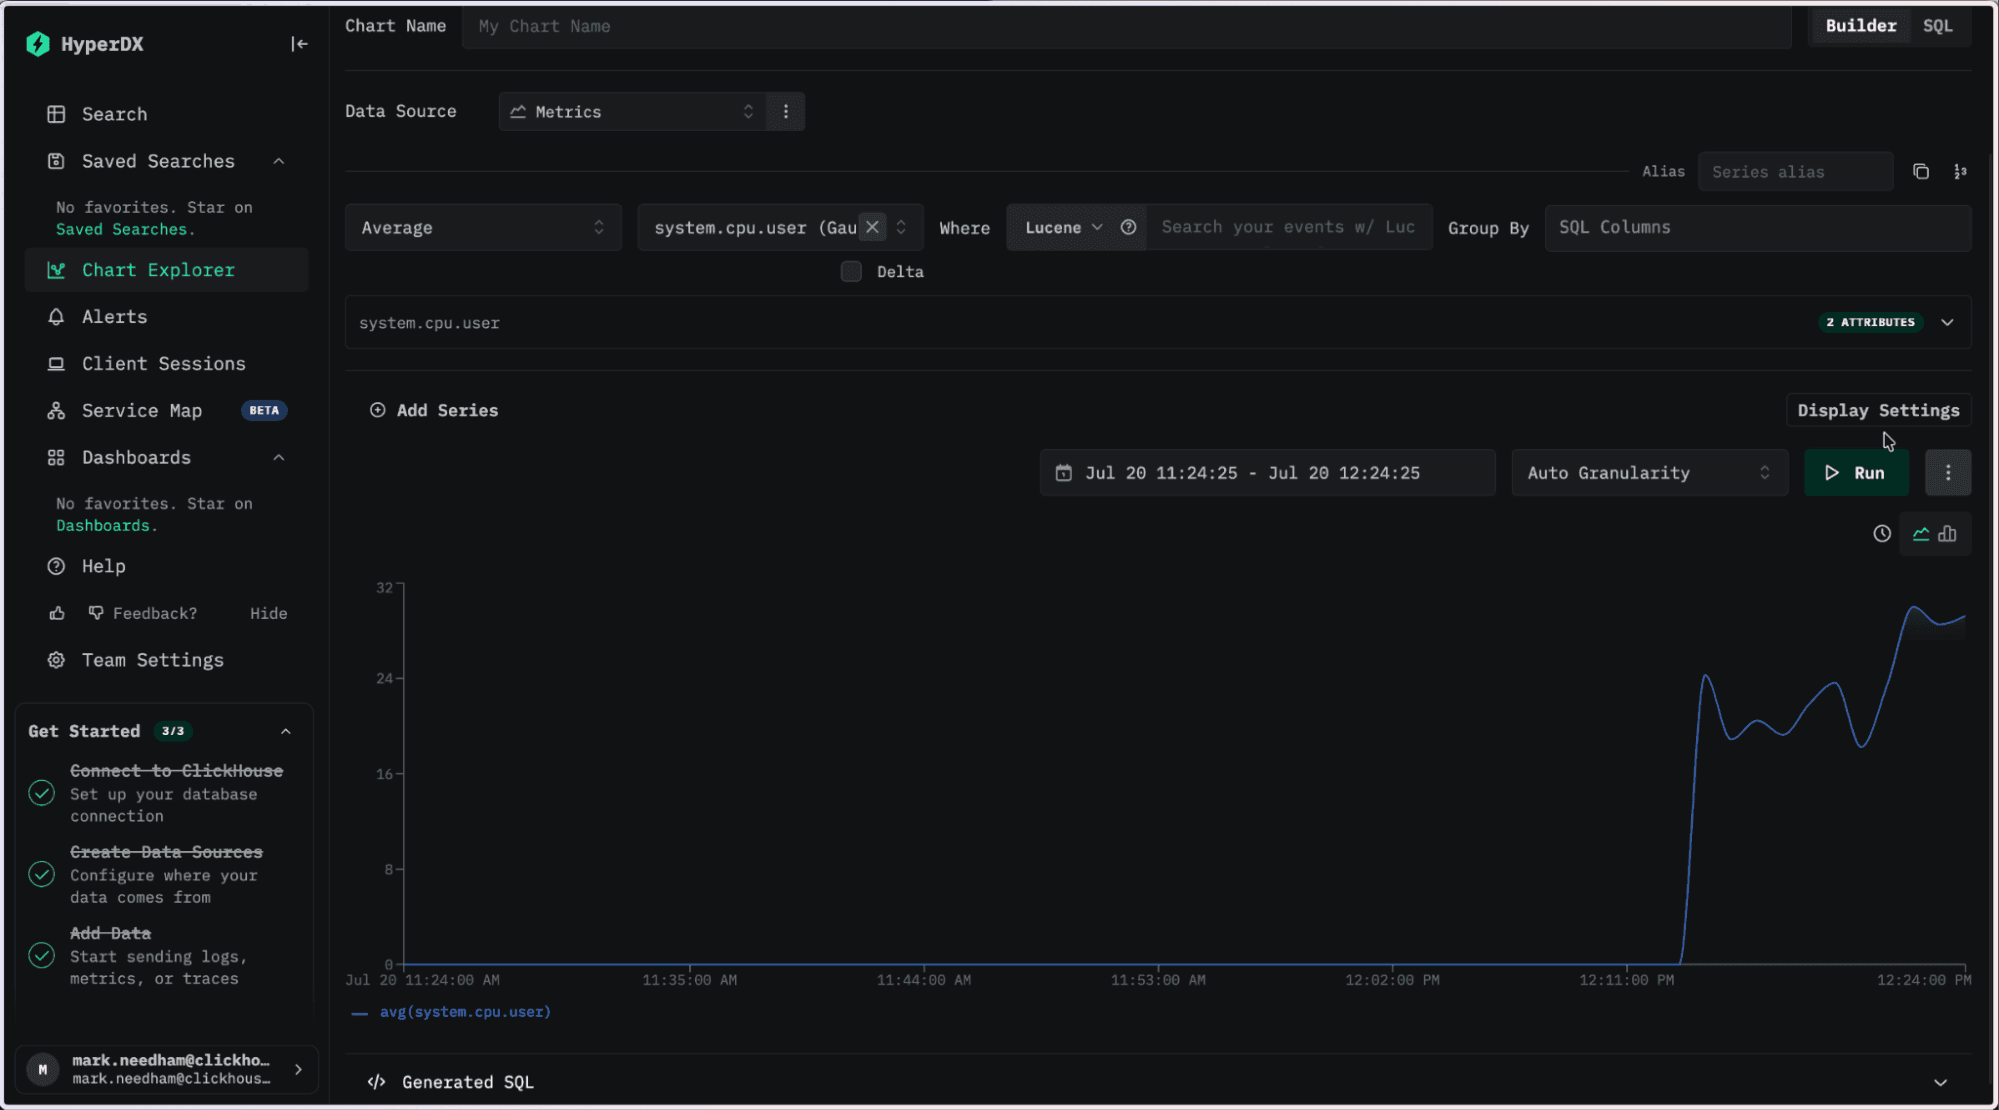
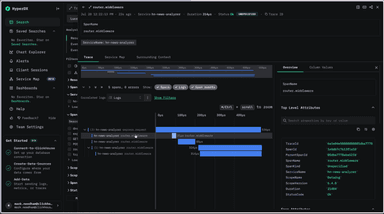
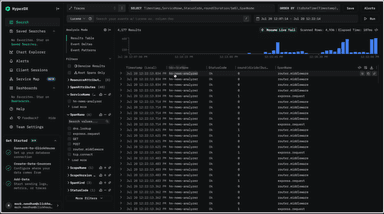
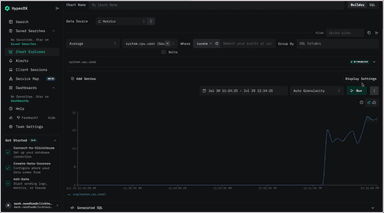
sudo launchctl kickstart -k system/com.datadoghq.agenWe can then navigate back to the ClickStack UI and explore traces, logs, and metrics captured by the Datadog agent.
Contributing improvements
When we evaluated the existing receiver against real Datadog migration workloads, we found several gaps that affected logs and traces. Most of the work focused on translating Datadog payloads into the correct OpenTelemetry representation so that downstream systems could interpret, correlate, and query the data without needing Datadog-specific logic.
The improvements included:
- Correct OpenTelemetry log records. Previously, fields were written as string attributes, and the log timestamp was not set, causing records to appear at the Unix epoch. The receiver now converts Datadog’s millisecond timestamps to nanoseconds and populates the OpenTelemetry timestamp, observed timestamp, body, severity, and resource fields.
- Resource attributes and severity. Datadog statuses such as
info,warn, anderrornow map to the corresponding OpenTelemetrySeverityNumberandSeverityText. Hostnames, service names, environments, and known container, cloud, and Kubernetes tags are promoted to standard resource attributes. Logs are then grouped by their resource. - Trace and log correlation. The
dd.trace_idanddd.span_idfields now populate the OpenTelemetry record’s actual trace and span identifiers. The receiver also reconstructs full 128-bit trace IDs from Datadog’s split representation. This behavior is enabled by default, allowing Datadog-sourced logs and spans to correlate with services instrumented using OpenTelemetry. - Structured JSON logs. Datadog agents forward application JSON logs as an opaque string because JSON preprocessing normally happens in the Datadog backend. The receiver now provides a
decode_json_messageoption, enabled by default, that performs this processing in the Collector. It extracts the body, timestamp, severity, trace identifiers, resource fields, and remaining log attributes. - Compatibility with current Datadog agents. Datadog Agent 7.59 and later compresses HTTP payloads with Zstandard by default. The receiver now supports Zstandard alongside gzip, allowing current agents to connect without their payloads being rejected.
Together, these changes allow a Datadog agent to send correlated, OpenTelemetry-native logs, metrics and traces to an OpenTelemetry Collector.
We have included the updated receiver in the ClickStack OpenTelemetry Collector distribution. All of these improvements were also contributed to the upstream OpenTelemetry Collector Contrib project, making them available to anyone using the standard Contrib distribution.
What you can migrate today
The Datadog receiver remains an alpha component in OpenTelemetry Collector Contrib and is thus also marked as experimental in the ClickStack Collector distribution - requiring a feature flag to enable it. There is still work to do before we recommend it as the basis for large-scale production migrations.
We have tested the updated receiver extensively with log and trace workloads and are comfortable recommending it for evaluating ClickStack, while metrics require further testing and development. The receiver currently supports Datadog’s v1 and v2 metrics intake endpoints. Agent deployments using newer protocol versions must be configured explicitly to send metrics through a supported endpoint. We plan to continue improving this coverage through the upstream OpenTelemetry project.
For now, the receiver provides a quick way to evaluate ClickStack or another observability platform when your applications already use Datadog SDKs or your infrastructure runs Datadog agents. A Collector pipeline can send the same logs and traces to Datadog and the platform being evaluated, allowing both telemetry pipelines to run in parallel. Teams can validate how their data is represented and queried in the new platform while their existing Datadog pipeline remains in place, then decide whether to proceed with a wider migration. If the evaluation demonstrates clear benefits, the same architecture can support a gradual migration, keeping existing Datadog instrumentation in place while services move to OpenTelemetry over time.
Conclusion
With these improvements, we believe the Datadog receiver is ready for broader use across observability platforms. We’re pleased to make it available in ClickStack’s distribution of the OpenTelemetry Collector, and we’ve contributed the changes upstream for anyone using the standard Contrib distribution.
Get started today
Interested in seeing how ClickHouse works on your data? Get started with ClickHouse Cloud in minutes and receive $300 in free credits.
Sign up