Why ClickStack #
So you're already using ClickHouse to power real-time analytics, and you're in good company. ClickHouse has quickly become the go-to database for both external-and internal-facing analytics, powering some of the largest user-facing analytics workloads. Traditional data warehouses just can't keep up with the kind of concurrency and low-latency queries that modern apps demand, which is why so many companies have turned to ClickHouse.
However, the same things that make ClickHouse great for analytics - fast scans, high compression, the ability to crunch huge volumes of data, and handling high-cardinality workloads - also make it perfect for logs, traces, and metrics. Add in its open source license, interoperability, and native support for OpenTelemetry (plus the ability to store your own wide events), and you've got a solid foundation for observability.
This idea, that observability and analytics shouldn't live on separate islands, isn't just ours. As Sierra's Arup Malakar put it in their recent blog,
"It would be really cool if we no longer thought of observability and analytics as two different islands, but just one data problem, powered by a really good compute engine like ClickHouse. At the end of the day, it’s all data, and we just need a way to access it."
Arup Malakar, Sierra
With our recent release of ClickStack, unifying your real-time analytics and observability has never been easier. Just instrument your app with a ClickStack SDK, or any of the OpenTelemetry SDKs, and you can immediately start correlating application data with errors, performance metrics, and issues - all in the same place.
In this post, we’ll give a practical example of how easy this is by instrumenting ClickPy - a ClickHouse-powered NextJS application with over 1.8 trillion rows that receives over 1.5 million queries a week.
Download ClickStack #
No setup headaches - run the world’s fastest and most scalable open source observability stack, in seconds.
ClickPy #
ClickPy, a project we've been running for a few years now, allows users to explore downloads for PyPI, the central package repository for the Python ecosystem. PyPI sees nearly 2 billion downloads every day, making it a rich source of metadata about which libraries developers rely on.
The dataset has grown massively. After a couple of years in production, the main table now stores nearly 1.8 trillion rows, representing real-world Python package downloads at scale from 2016. Despite the size, queries remain sub-second - showing off ClickHouse’s ability to handle high-volume, highly concurrent workloads without breaking a sweat.
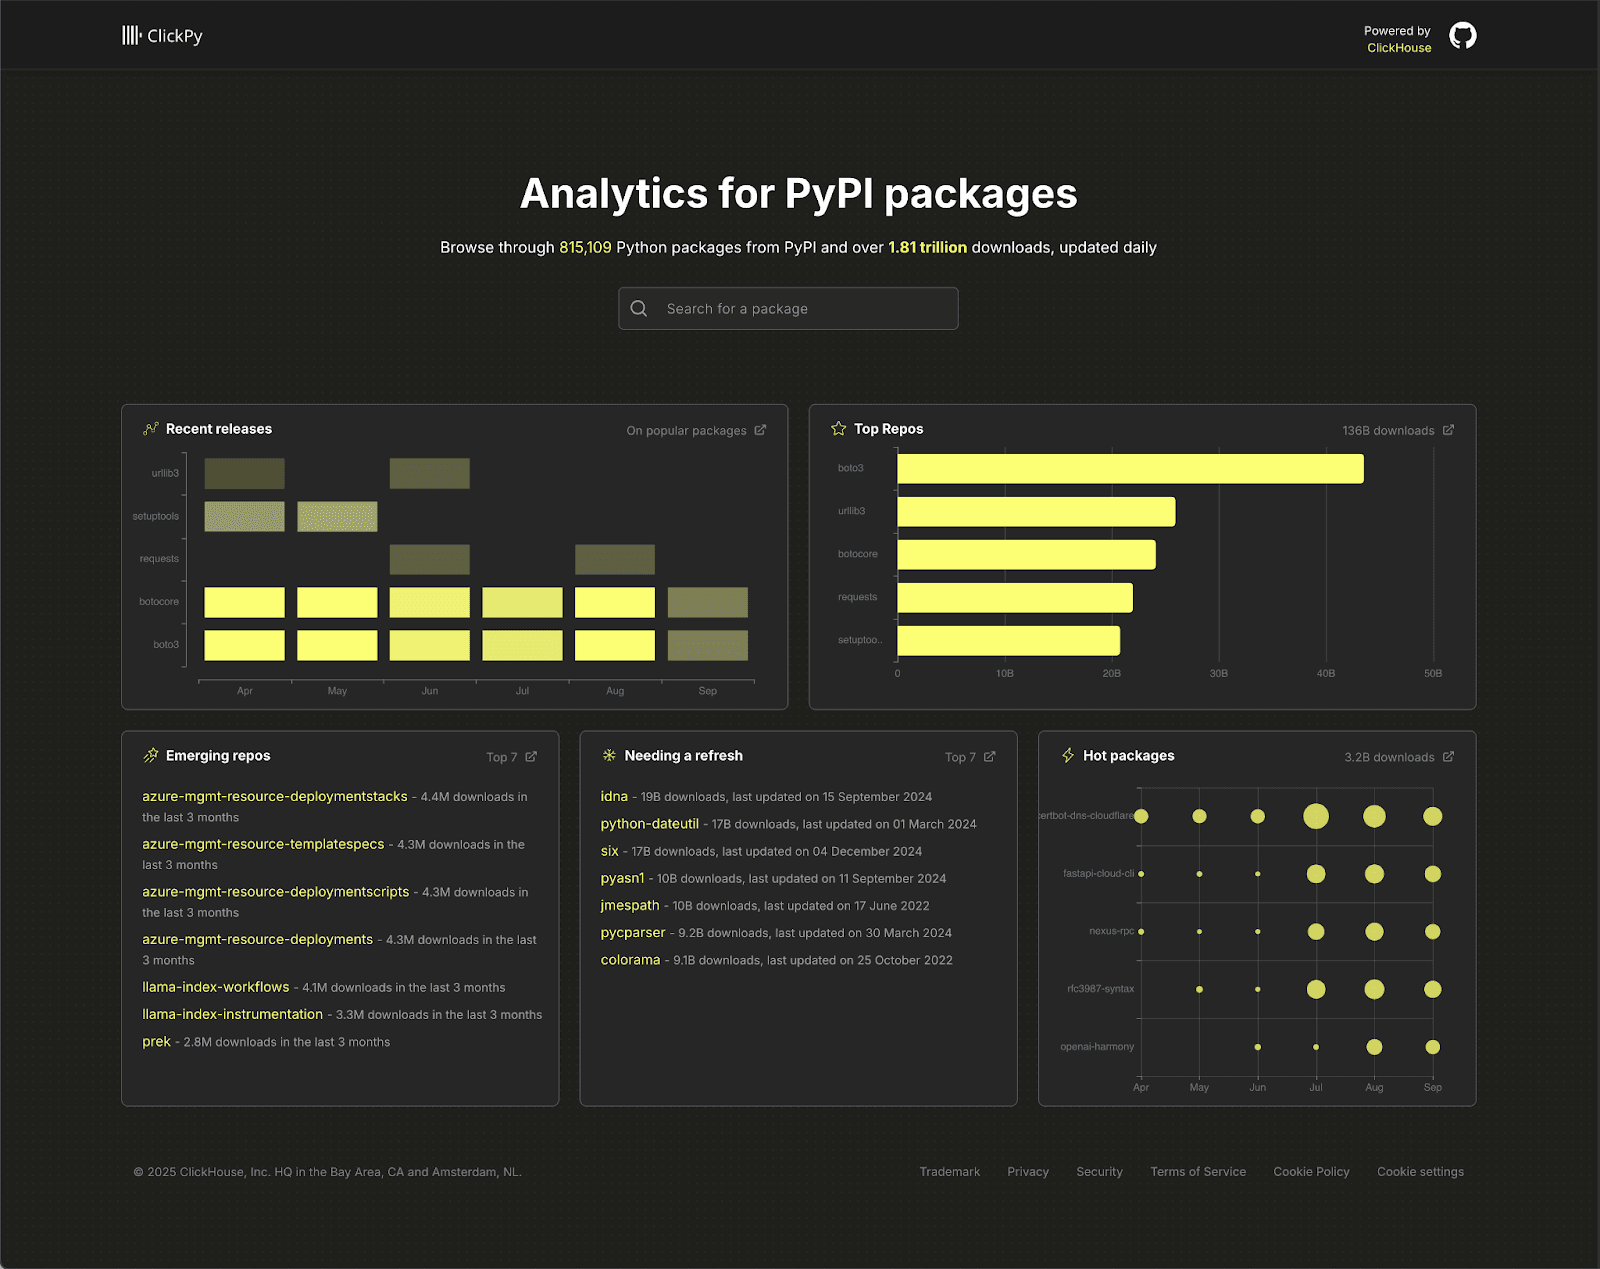
For a deep dive into ClickPy, and how it works under the hood, we recommend the blog post we published when we hit the 1 trillion row mark last year
The app is a straightforward React + Next.js frontend with a few pages, Apache ECharts for charts, and ClickHouse queries served by Node.js via the official client. It uses a hybrid SSR/CSR model: initial loads are fast because data is fetched from ClickHouse on the server and passed as props, while charts render client-side for interactivity and responsiveness. Thanks to materialized views and smart table selection, performance holds up even at trillions of rows - delivering quick first loads, responsive charts, and smooth real-time exploration. This simplicity makes the app easy to instrument, yet with enough moving parts to surface real issues and serve as a decent example; we wanted to see whether performance improvements were possible and if certain package properties caused slower dashboard loads.
Instrumenting NextJS with OTel and ClickStack #
ClickStack brings three pieces together: ClickHouse for the database, HyperDX for the UI, and OpenTelemetry for data collection. That’s it. Together, they give you a complete observability stack without the overhead of juggling multiple tools.
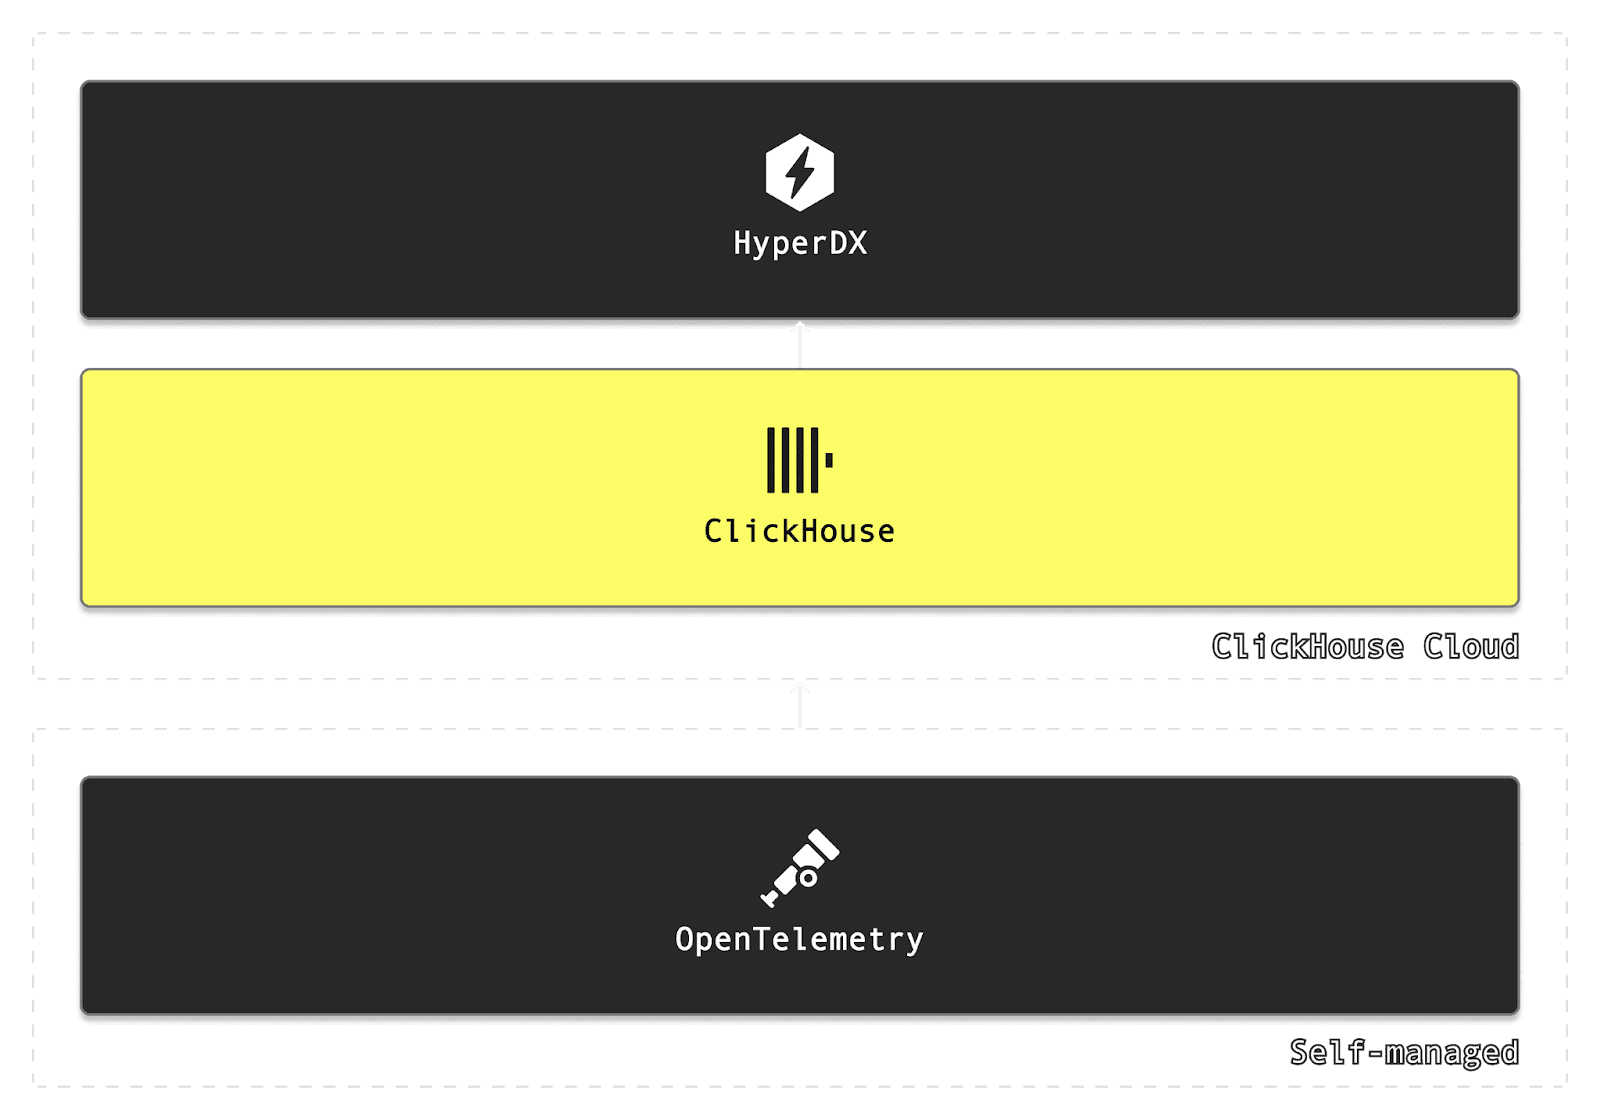
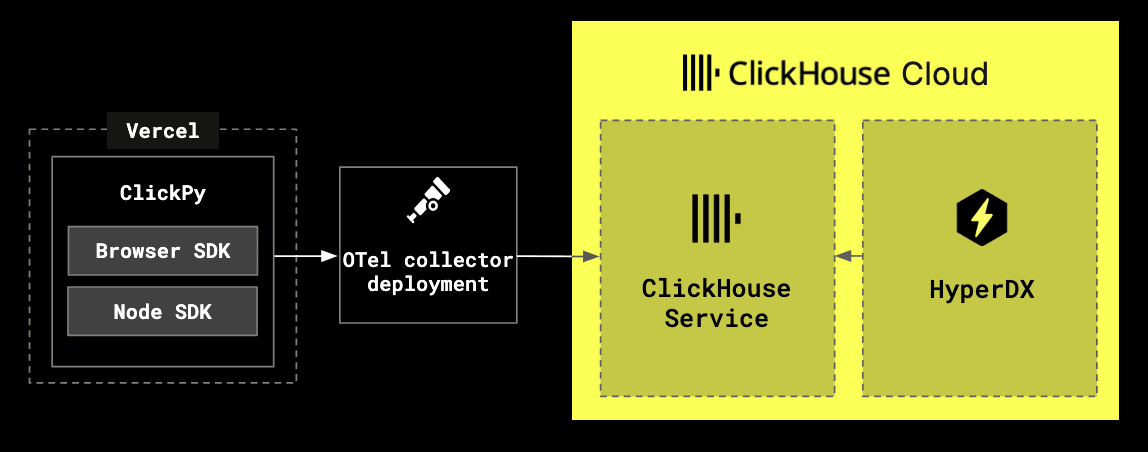
For our purposes with ClickPy, we’re mainly interested in collecting sessions and traces from the application. While sessions allow the user’s browser experience to be replayed, traces can come from both sides of the app - the Node.js server-side code we host on Vercel, and the React frontend running in the browser.
We have a couple of options for instrumentation. We could wire things up directly with the vanilla OpenTelemetry SDKs, but ClickStack also provides its own SDKs that improve the developer experience. For example, the Node.js SDK includes built-in exception capturing and ships with sensible defaults, making it easy to get up and running with just a few lines of code. On the frontend, the ClickStack JavaScript SDK makes it straightforward to start capturing traces in the browser, which we can correlate with the backend - in addition to user sessions, allowing us to visualize and replay the user experience.
Deploying ClickStack #
The fastest way for users to deploy ClickStack locally is to use the all-in-one image, which includes ClickHouse, HyperDX and the OTel collector endpoint:
docker run -p 8080:8080 -p 4317:4317 -p 4318:4318 docker.hyperdx.io/hyperdx/hyperdx-all-in-one
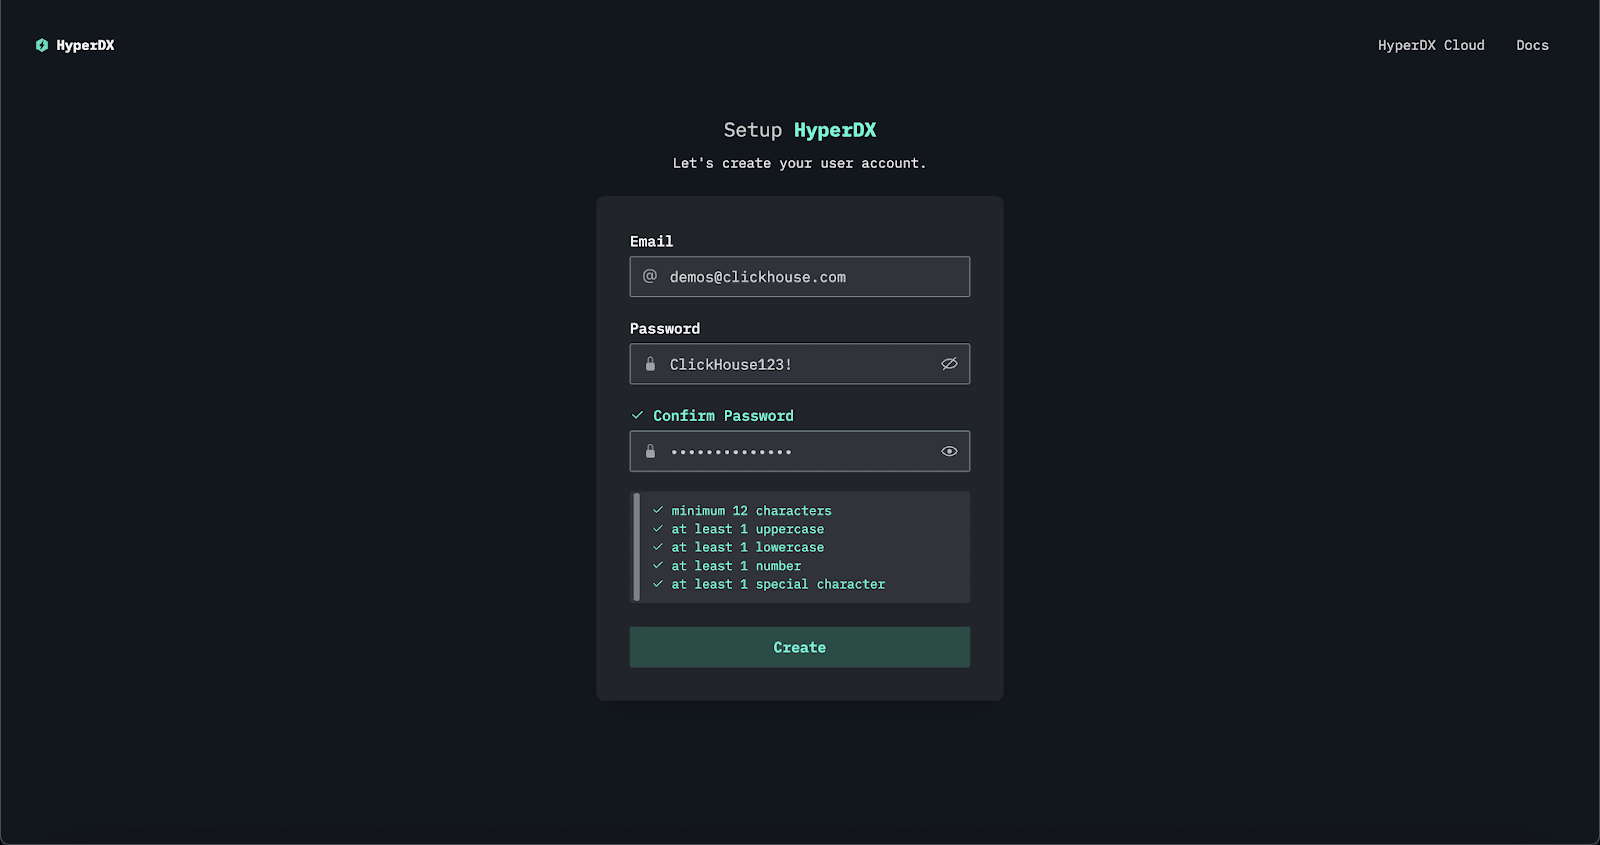
This exposes HyperDX locally on port 8080. Navigate to the UI at http://localhost and create a user. All sources will be automatically created.
ClickHouse Cloud #
For ClickHouse Cloud users, HyperDX is available in private preview and can be enabled on request. HyperDX can in turn be launched for any service - users will not need to create a user, with authentication handled automatically.
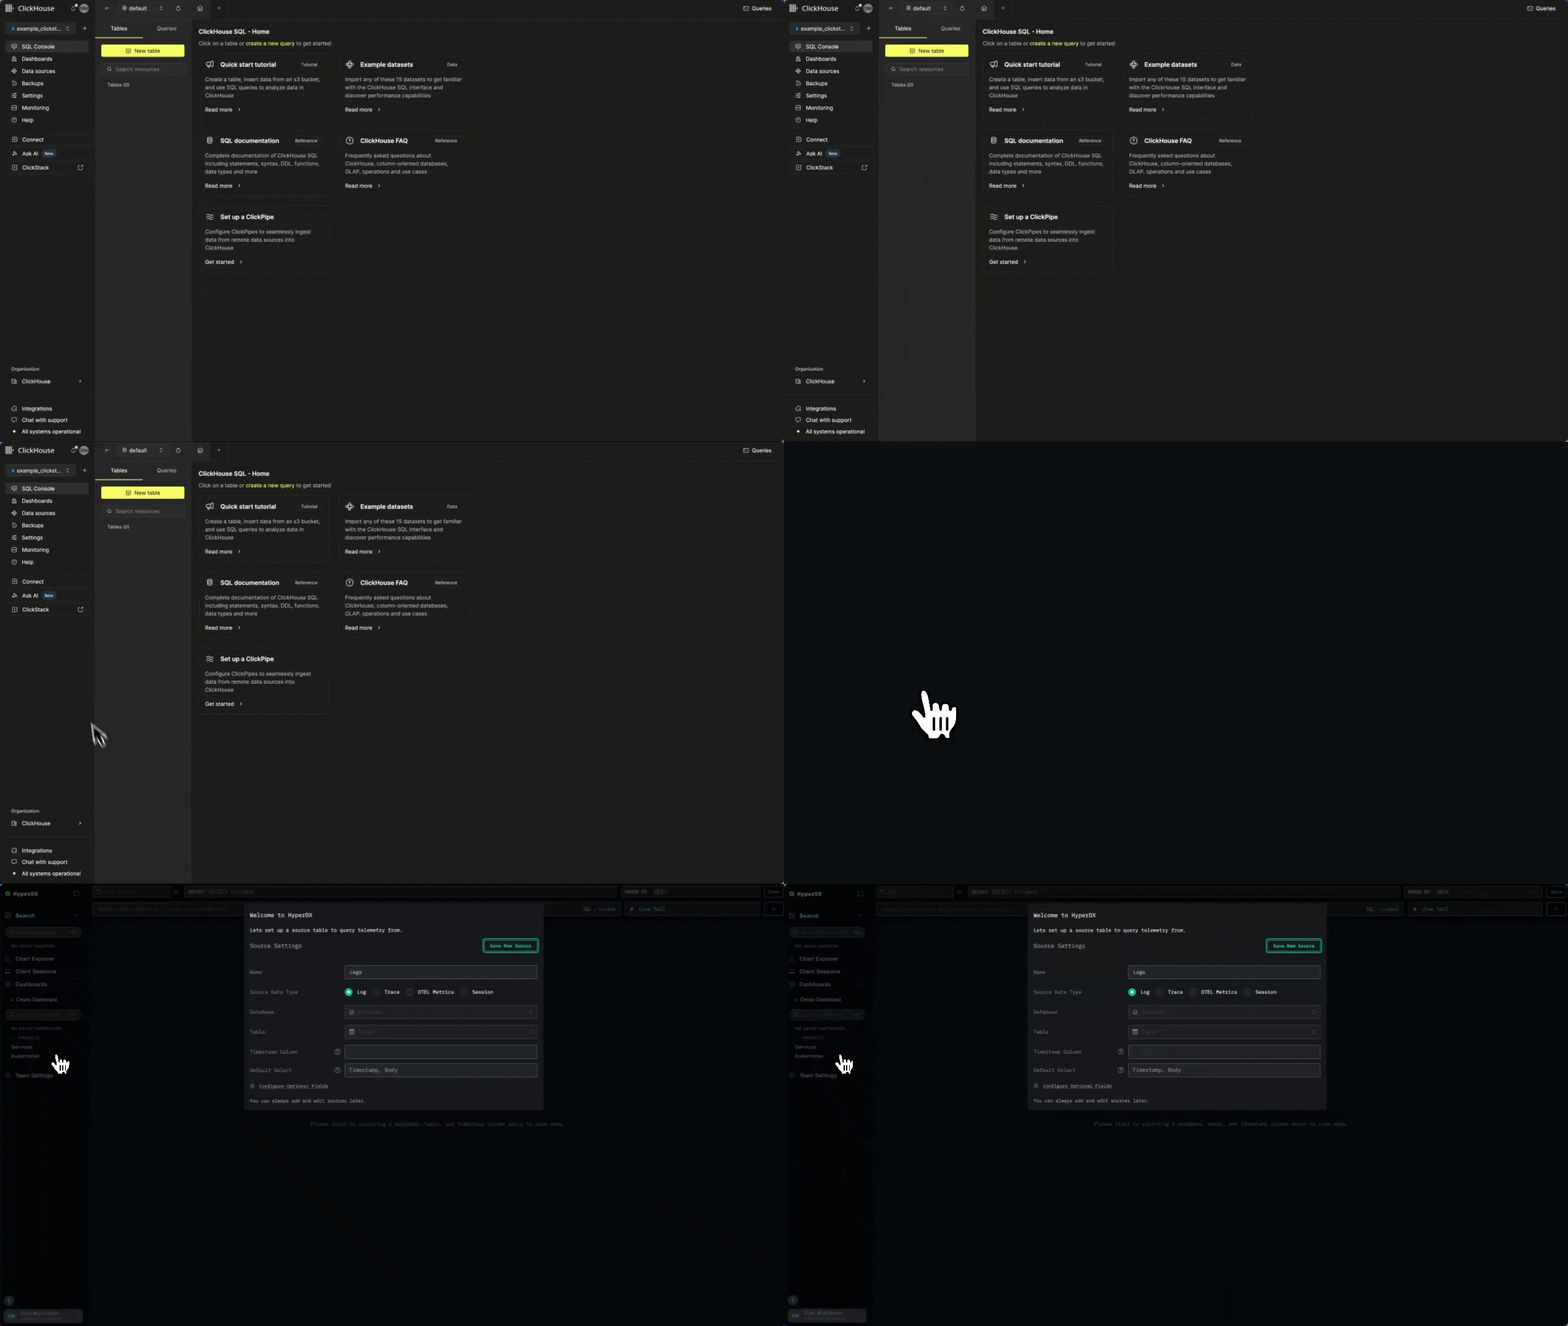
At the time of writing, an ingestion endpoint is not provided in Cloud, so users will need to run an OTel collector locally to handle ingestion. The following commands should get you started:
curl -O https://raw.githubusercontent.com/ClickHouse/clickhouse-docs/refs/heads/main/docs/use-cases/observability/clickstack/deployment/_snippets/otel-cloud-config.yaml

# modify to your cloud endpoint
export CLICKHOUSE_ENDPOINT=
export CLICKHOUSE_PASSWORD=
# optionally modify
export CLICKHOUSE_DATABASE=default

# osx
docker run --rm -it \
  -p 4317:4317 -p 4318:4318 \
  -e CLICKHOUSE_ENDPOINT=${CLICKHOUSE_ENDPOINT} \
  -e CLICKHOUSE_USER=default \
  -e CLICKHOUSE_PASSWORD=${CLICKHOUSE_PASSWORD} \
  -e CLICKHOUSE_DATABASE=${CLICKHOUSE_DATABASE} \
  --user 0:0 \
  -v "$(pwd)/otel-cloud-config.yaml":/etc/otel/config.yaml \
  -v /var/log:/var/log:ro \
  -v /private/var/log:/private/var/log:ro \
  otel/opentelemetry-collector-contrib:latest \
  --config /etc/otel/config.yaml
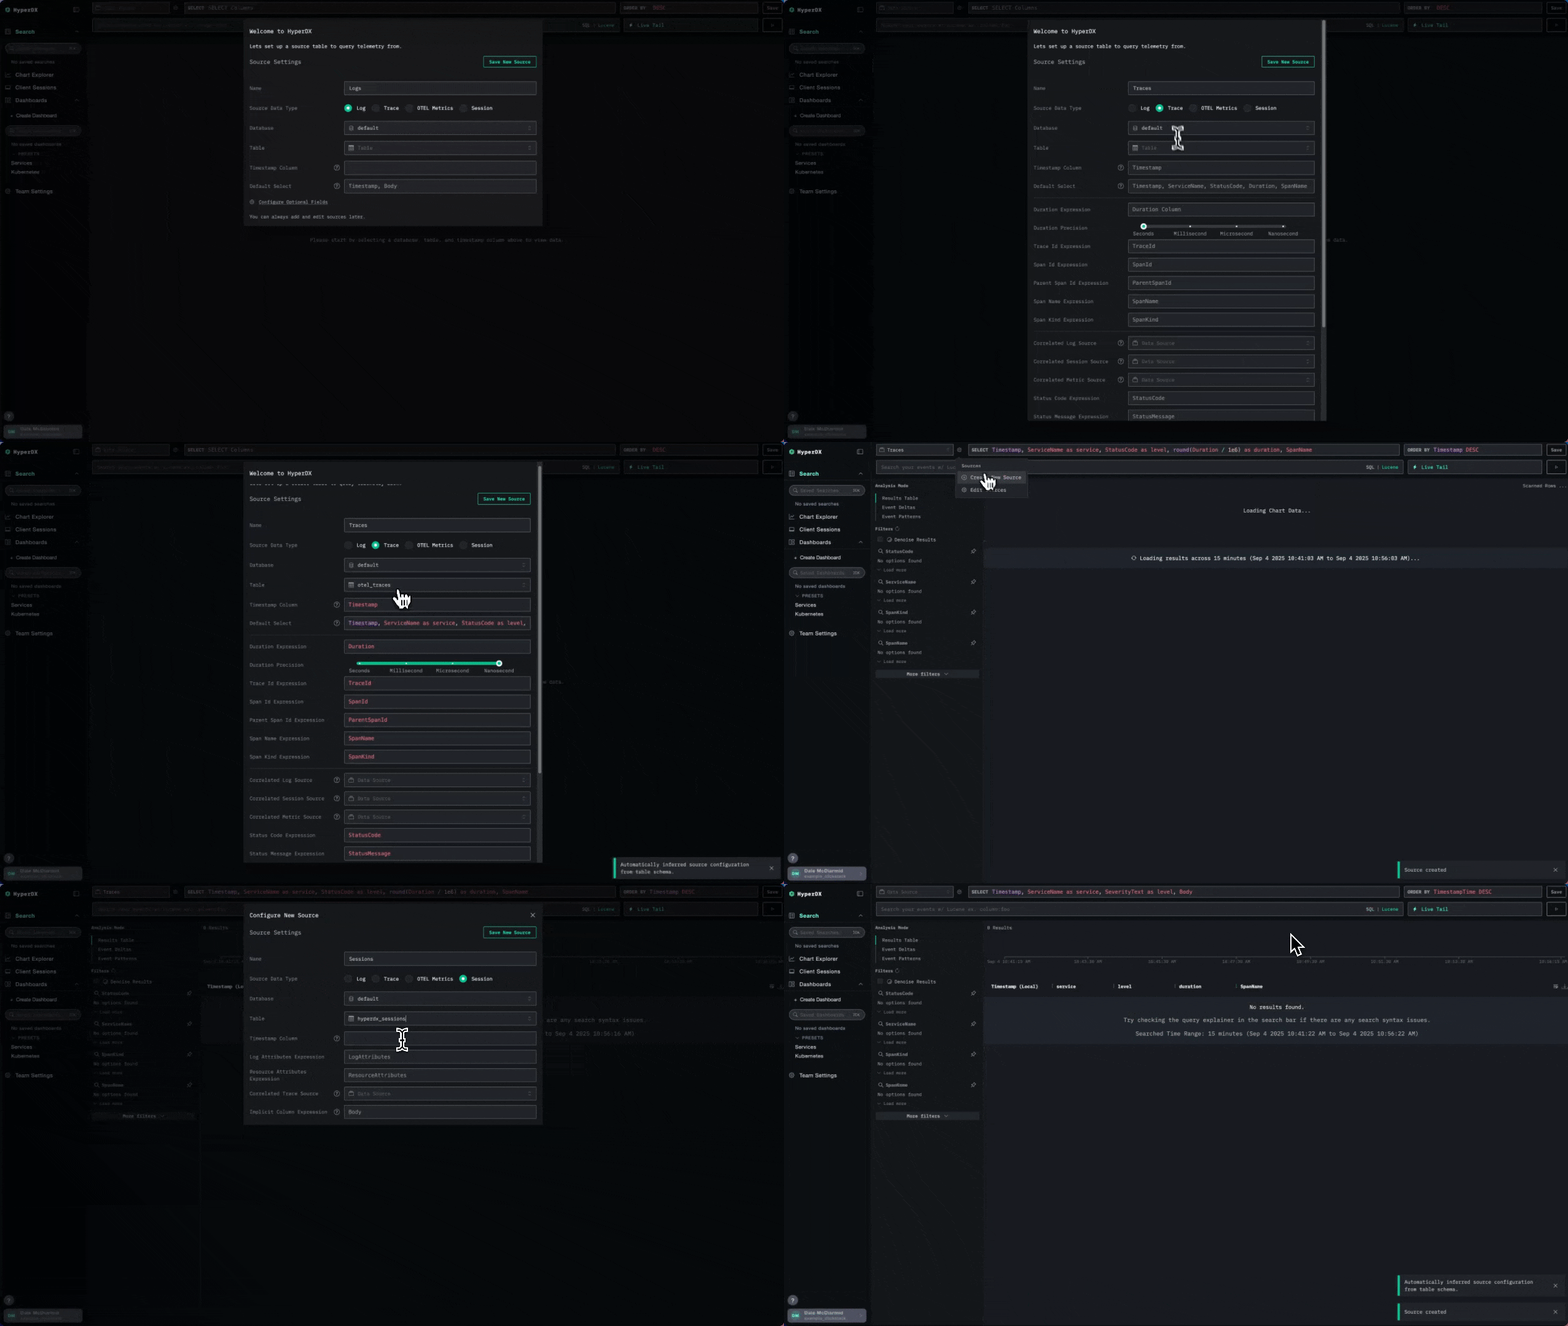
Once the collector is deployed, return to the HyperDX UI to create a trace and session source.
Instrumenting the browser #
Our Next.js application has both client and server-side components. For the client side, we’ll use the ClickStack Browser SDK. While you could use the vanilla OpenTelemetry SDK (fully compatible with ClickStack), the ClickStack JavaScript SDK brings one big advantage: session replay, alongside built-in features like console and network capture of HTTP requests, which can be enabled with a simple flag.
Instrumentation only takes a few lines of code. First, install the package:
npm install @hyperdx/browser
Next, we need to initialize the SDK in a place that’s guaranteed to load when your app starts. In our case, ClickPy shows a cookie consent banner before anything else - added in layout.js. This is a perfect place to add the initialization:
import HyperDX from '@hyperdx/browser';

HyperDX.init({
 url: process.env.NEXT_PUBLIC_OTEL_EXPORTER_OTLP_ENDPOINT || 'http://localhost:4318',
 apiKey: process.env.NEXT_PUBLIC_HYPERDX_API_KEY || '',
 service: 'clickpy-frontend',
 tracePropagationTargets: [
   /localhost:\d+/i,
   new RegExp(process.env.NEXT_PUBLIC_DOMAIN || 'localhost', 'i')
 ],
 consoleCapture: true,
 advancedNetworkCapture: true,
});
A couple of things to notice here:
- Service name - spans from the browser are tagged as
clickpy-frontend, making it easy to tell them apart from spans generated by the server. - OTLP endpoint – By default, we send traces to a local OpenTelemetry collector (localhost). When deploying on platforms such as Vercel, we set this via the
NEXT_PUBLIC_OTEL_EXPORTER_OTLP_ENDPOINTenvironment variable. - API key – Not needed if you’re not using authentication with a local collector, but required if you’re using a public endpoint and deploying ClickPy on the public internet. We handle this with
NEXT_PUBLIC_HYPERDX_API_KEY. - Console + network capture – With
consoleCaptureandadvancedNetworkCaptureenabled, the SDK automatically records console logs and request/response details (including headers and bodies). - Trace propagation – This is where the magic happens. By defining
tracePropagationTargets, we ensure that browser-initiated requests to our server include thetraceparentheader. That means spans generated in the browser are linked to spans generated on the server for the same trace - this gives us a full distributed trace across frontend and backend.
An OpenTelemetry span is a timed operation that represents a unit of work, like an HTTP request or database query, captured with its context and metadata. A trace is the collection of spans that together show the end-to-end journey of a request or workflow across services. With trace propagation, spans from both client and server (for example, when a user filters on a package page) are linked into the same trace, giving you a fully connected view of the interaction. In our case, a trace is when the user opens or filters on a Python package on the dashboard page, with a span representing units of work such as queries to ClickHouse.
With just this setup, every ClickPy page load, user interaction, and network call in the browser now feeds directly into ClickStack, ready to be correlated with server-side traces and logs.
Instrumenting the NodeJS server #
On the server side, we again have a few options: use vanilla OpenTelemetry for Node.js, Vercel’s Next.js-friendly SDK, or the ClickStack Node.js SDK (fully OTel-compatible with some helpful defaults). Since ClickPy runs on Vercel, the latter two make the most sense.
In this example, we’ll use the ClickStack SDK because it provides out-of-the-box HTTP request and response capture. That’s especially useful for ClickPy, since our server components send queries to ClickHouse over HTTP - meaning the request body contains the SQL queries we want to observe and analyze.
We again need to install the relevant package:
npm add @hyperdx/node-opentelemetry
Since we're using an older version of NextJS (14), we also need to enable the instrumentation hook. This just requires us to enable the appropriate flag in our [next.config.js](next.config.js) file:
Note that later versions of NextJS (>=15) can skip this step.
/** @type {import('next').NextConfig} */
const nextConfig = {
  experimental: {
    instrumentationHook: true,
  },
};

module.exports = nextConfig;
With this enabled, we can initialize our instrumentation by creating an instrumentation.js at the project root (or /src if that’s your layout), with a register function to initialize our SDK, which NextJS will call on server start.
// instrumentation.js
export async function register() {
  if (process.env.NEXT_RUNTIME === 'nodejs') {
    const { initSDK } = await import('@hyperdx/node-opentelemetry');
    initSDK({
      service: 'clickpy',
      // Auto-instruments Next.js + HTTP and captures headers/bodies
      advancedNetworkCapture: true,
      // You can add more instrumentations here if you need them later:
    });
  }
}
The service parameter ensures server-side spans are tagged with the service name clickpy, making it clear they originated from the backend. With advancedNetworkCapture enabled, we also capture full HTTP requests and responses, including the ClickHouse SQL queries, giving us deeper visibility into performance.
Further SDK configuration is handled entirely through environment variables. We set four key variables, either directly in the shell or in a .env.local file:
OTEL_EXPORTER_OTLP_ENDPOINT=http://localhost:4318
HYPERDX_API_KEY=38a8701c-3d72-49f8-8d96-aedaf77d0d55
OTEL_INSTRUMENTATION_HTTP_CAPTURE_HEADERS_CLIENT_REQUEST=accept-encoding,host,traceparent,user-agent
OTEL_INSTRUMENTATION_HTTP_CAPTURE_HEADERS_SERVER_REQUEST=accept-encoding,host,traceparent,user-agent
Again, we specify the configuration for the OTLP endpoint and the optional API key. The two header-capture variables specify which request headers are recorded for client and server calls, ensuring useful context like traceparent is preserved while sensitive headers such as authorization are excluded. Other options are available here, should users also need to mask request or response bodies or limit response header capture.
Extending the instrumentation #
The SDKs provide rich instrumentation out of the box, but sometimes you need more detail. In our case, we want to link queries directly to their visual components on the dashboard. Each component has a name and parameters, so we'll capture these as well. We also want to record the full timing of each ClickHouse request, along with the number of rows returned and any query settings. The easiest way to do this is by creating a custom span at the point each query is issued, closing it when the query completes. Since all queries in ClickPy flow through a single query function, shown below, this is straightforward to implement.
async function query(query_name, query, query_params) {
    const results = await clickhouse.query({
        query: query,
        query_params: query_params,
        format: 'JSONEachRow',
        clickhouse_settings: getQueryCustomSettings(query_name)
    })
    let query_link = `${process.env.NEXT_PUBLIC_QUERY_LINK_HOST || process.env.CLICKHOUSE_HOST}?query=${base64Encode(query)}`
    if (query_params != undefined) {
        const prefixedParams = Object.fromEntries(
            Object.entries(query_params)
                .filter(([, value]) => value !== undefined)
                .map(([key, value]) => [`param_${key}`, Array.isArray(value) ? `['${value.join("','")}']` : value])
        );
        query_link = `${query_link}&tab=results&${Object.entries(prefixedParams).map(([name, value]) => `${encodeURIComponent(name)}=${encodeURIComponent(value)}`).join('&')}`
    }
    return Promise.all([Promise.resolve(query_link), results.json()]);
}
To create a custom span, we call startSpan on the current OpenTelemetry trace when the query method begins, then close it with end() once the ClickHouse query finishes and before the function returns. In between, we capture statistics such as the query response time as span attributes. The most relevant parts of the code are below, with the full function here:
xport async function query(query_name, query, query_params) {
  const span = tracer.startSpan(query_name, {
    attributes: {
      'db.system': 'clickhouse',
      // Add a short/obfuscated statement if you want. Full SQL can be large/PII.
      // 'db.statement': truncate(query),
      'db.parameters': truncate(safeJson(query_params ?? {})), // ← your params
    },
  });

  try {
    const start = performance.now();
    // run the query inside the span's context
    const results = await context.with(trace.setSpan(context.active(), span), () =>
      clickhouse.query({
        query,
        query_params,
        format: 'JSONEachRow',
        clickhouse_settings: getQueryCustomSettings(query_name),
      })
    );

    const data = await results.json(); // materialize rows to count
    const end = performance.now();
    // annotate outcome
    if (span.isRecording()) {
      span.setAttribute('db.response_time_ms', Math.round(end - start));
      span.setAttribute('db.rows_returned', Array.isArray(data) ? data.length : 0);
      // attach useful customs
      span.setAttribute('clickhouse.settings', truncate(safeJson(getQueryCustomSettings(query_name))));
    }

    span.setStatus({ code: SpanStatusCode.UNSET });
    span.end();
    return Promise.all([Promise.resolve(query_link), Promise.resolve(data)]);
  } catch (err) {
    if (span.isRecording()) {
      span.recordException(err);
      span.setStatus({ code: SpanStatusCode.ERROR, message: err?.message });
    }
    span.end();
    throw err;
  }
}
The result of this instrumentation is an additional span for each ClickHouse query, created as a sibling to the auto-captured ClickHouse.query span that records the HTTP request and payload.
Analyzing the data #
With ClickPy instrumented, we can now collect and explore observability data. The app itself is deployed on Vercel and available publicly at clickpy.clickhouse.com. Deploying in Vercel requires us to set the environment variables we outlined earlier.
To receive telemetry, we run an OpenTelemetry Collector endpoint over SSL. Data from the public instance of ClickPy is ingested into the otel_clickpy database in our public demo cluster at sql.clickhouse.com - feel free to explore it with your own SQL queries. You can also visualize this data directly in our public HyperDX instance at play-clickstack.clickhouse.com. Traces are available under the source ClickPy Traces, with session replays under ClickPy Sessions.
For example, if you open ClickPy, navigate to a package, and filter by time, your corresponding session will appear in our public instance of HyperDX. You can replay the session, inspect each user action, and drill down into the traces and spans generated along the way. This gives you both a high-level view of user flows and a detailed breakdown of performance at every step - powerful for debugging, optimization, and understanding real-world usage.
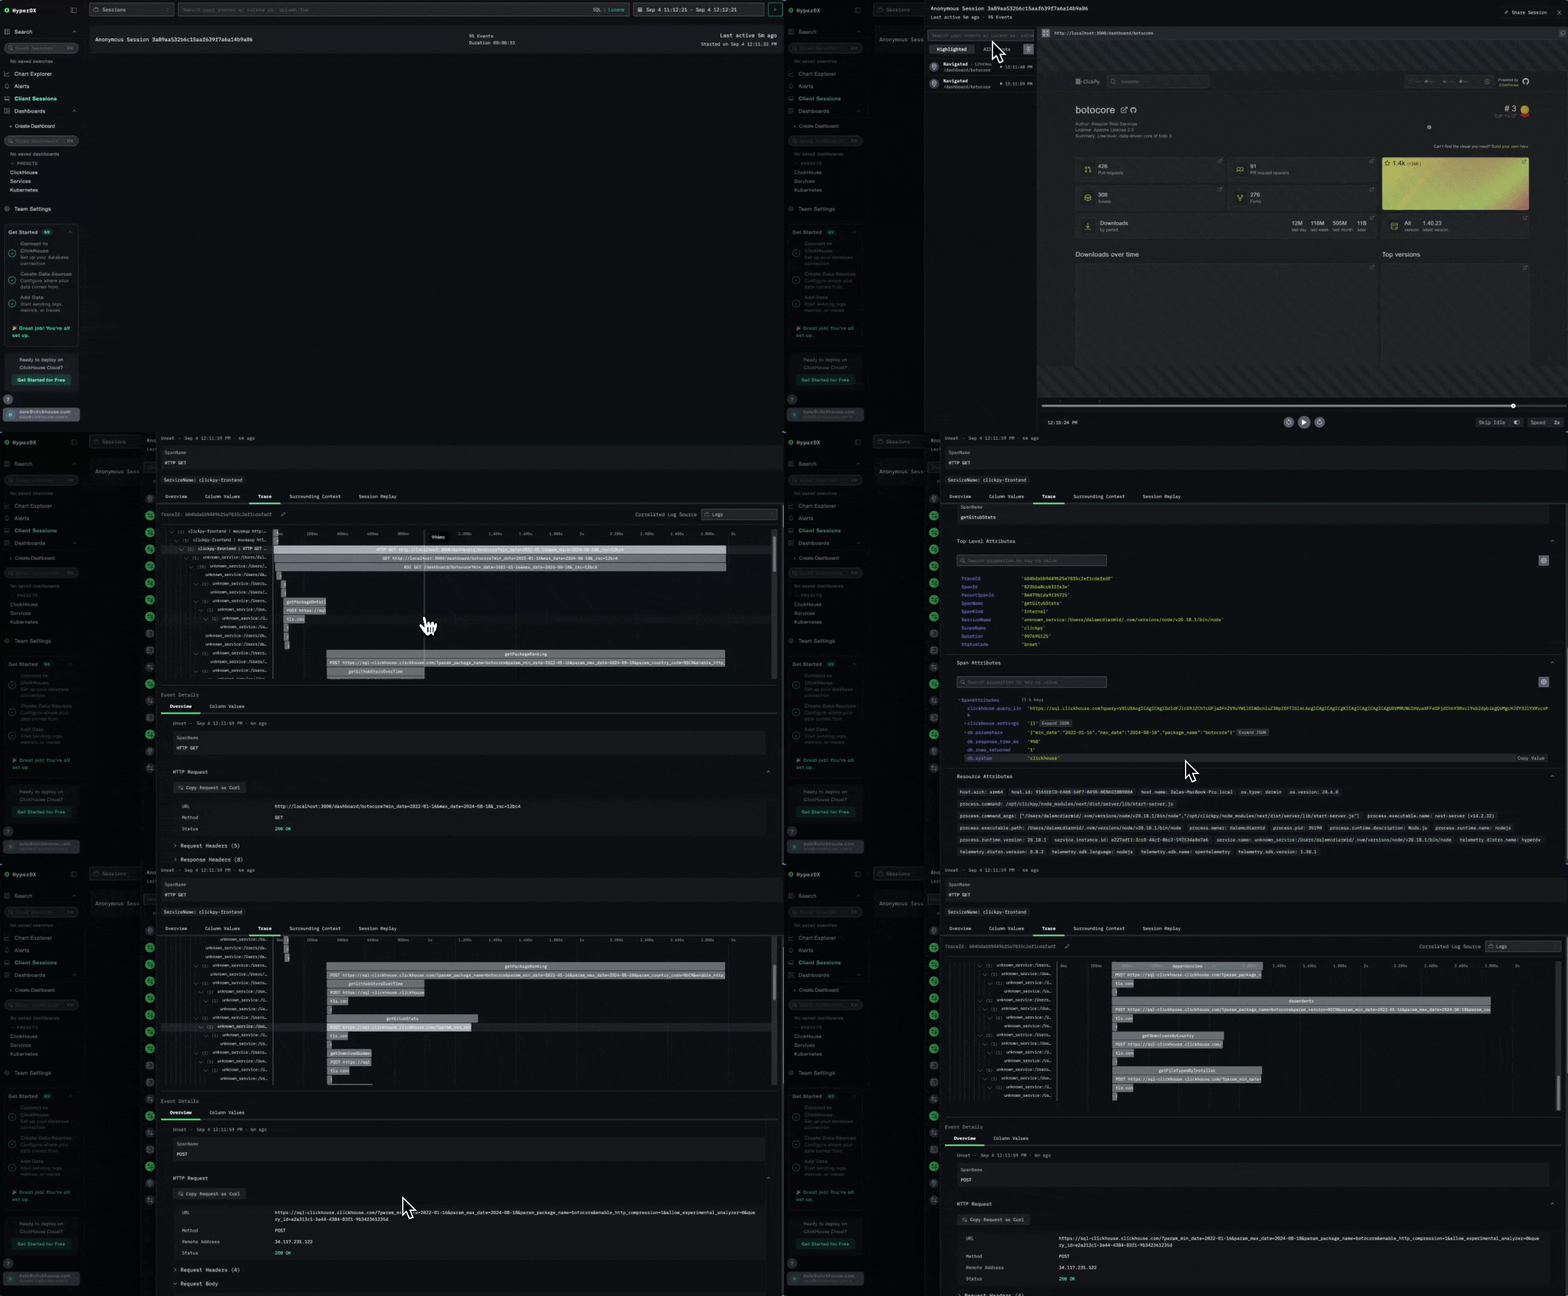
Note how we can introspect each ClickHouse query and see both the associated visualization as well as the query issued thanks to our custom instrumentation:
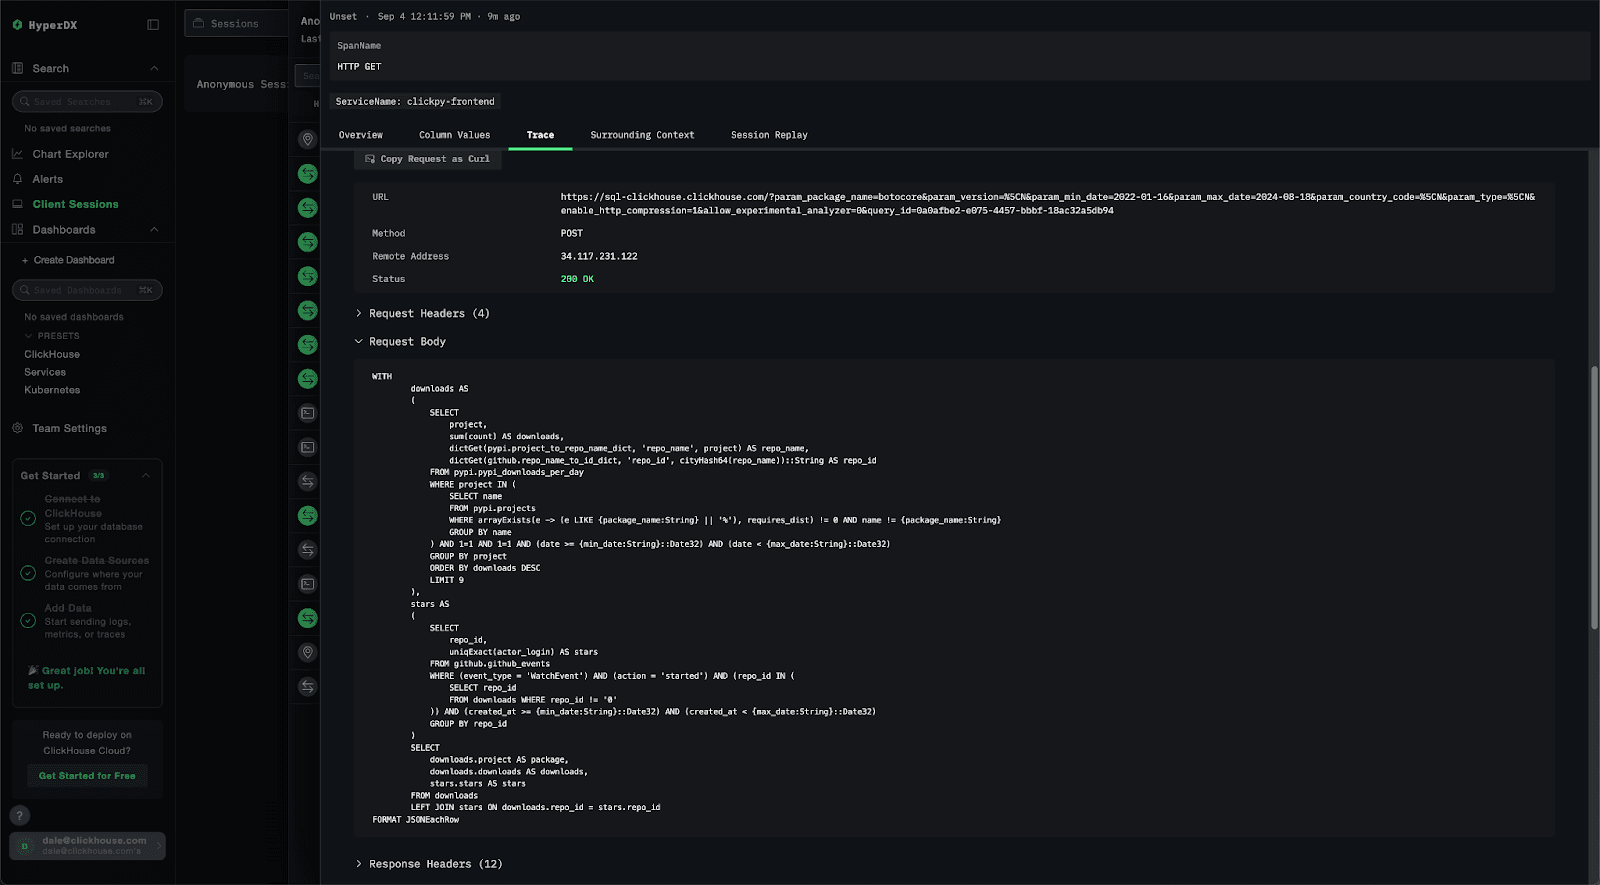
While session replays help us debug individual user issues, we can also step back and take a higher-level view of the data to spot patterns and identify ways to improve overall application performance.
One of ClickStack's advantages is its flexibility: it supports schema-on-write (via the JSON type in ClickHouse) and schema-on-read. The latter means we can parse values out of raw strings at query time using ClickHouse's built-in string functions, which are handy when we don't pre-process everything at insert.
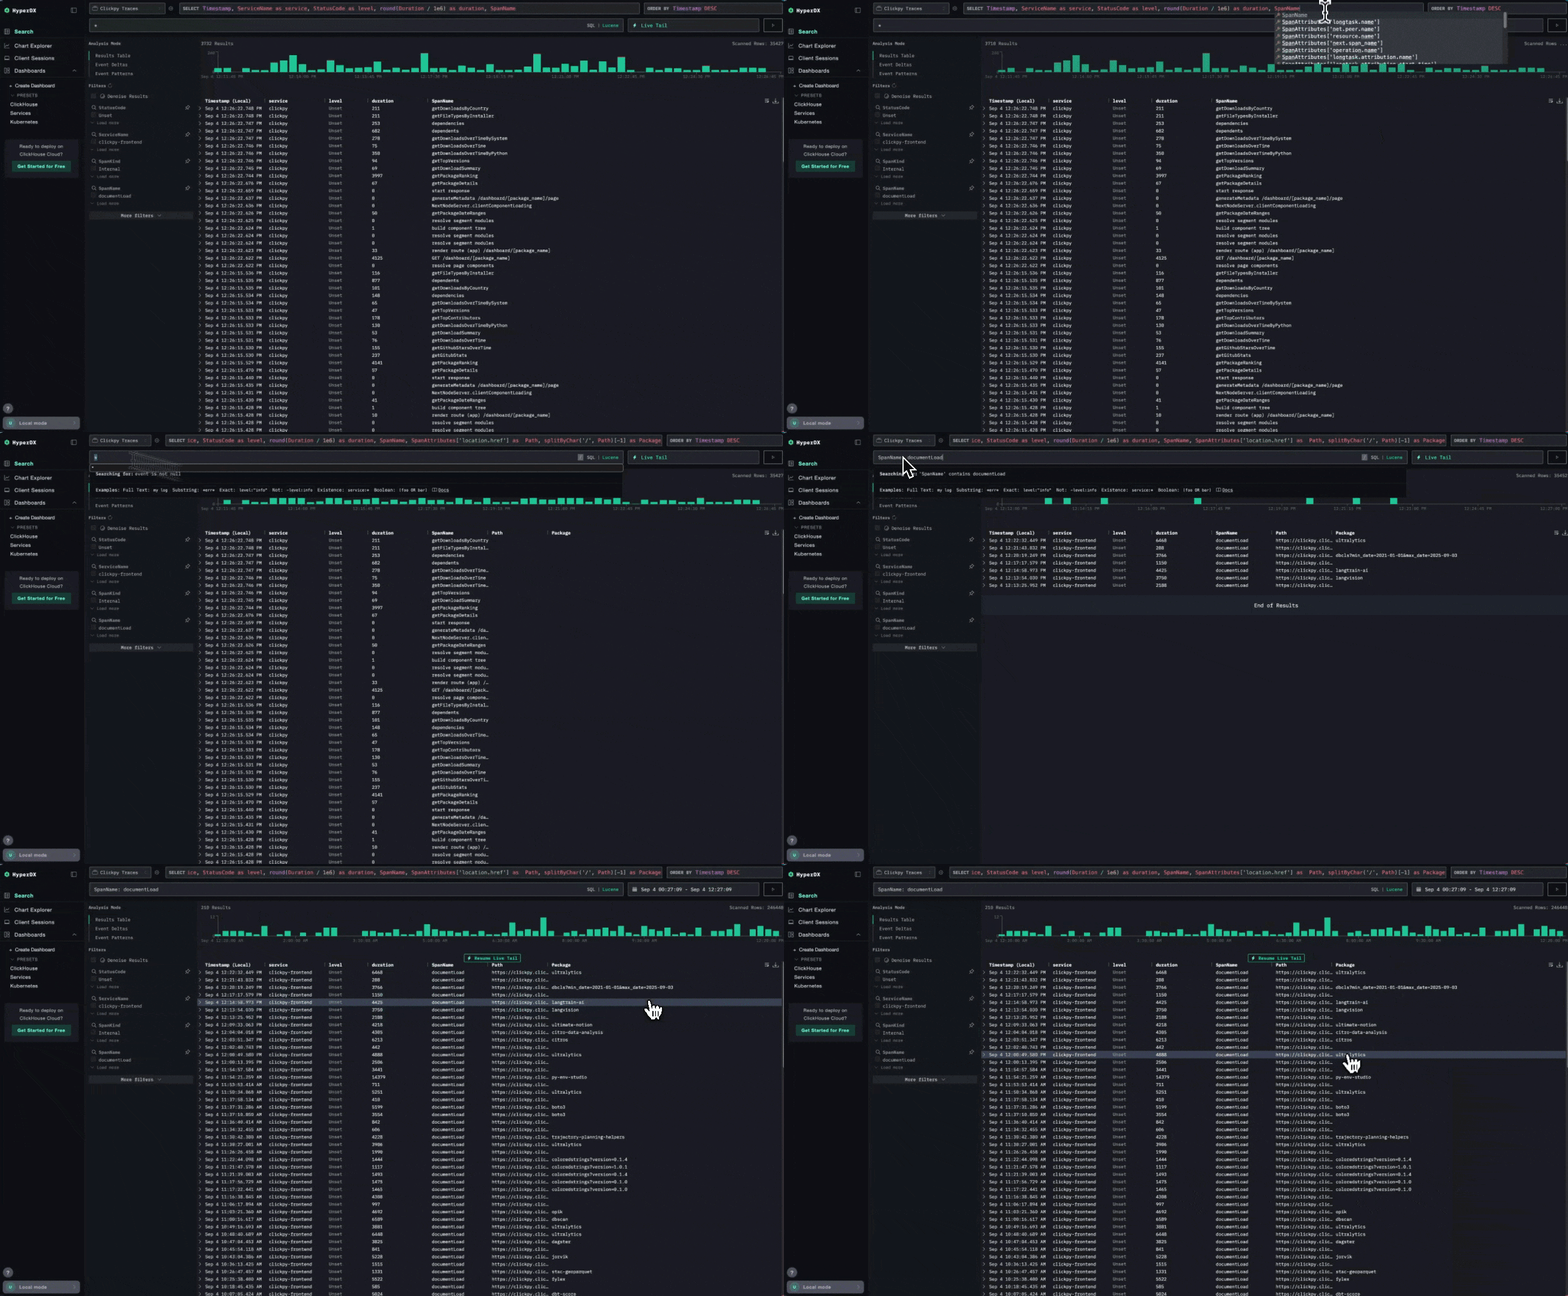
Every time a user navigates to a package page, it triggers a documentLoad span. The location.href attribute on that span contains the package URL. By filtering for SpanName: documentLoad and extracting the package name from location.href, we can see the packages visited by each user. Notice how we can exploit the ClickHouse SQL function splitByChar to parse out the package name from the URL - effectively creating a schema at read time.
By tagging the span for each ClickHouse query with its visualization name, we can easily track and compare the performance of different visualizations over time. Our db.response_time_ms allows us to see the query cost for each visualization type. Below, we plot this over time, grouping by the SpanName (in this case, the visualization name).
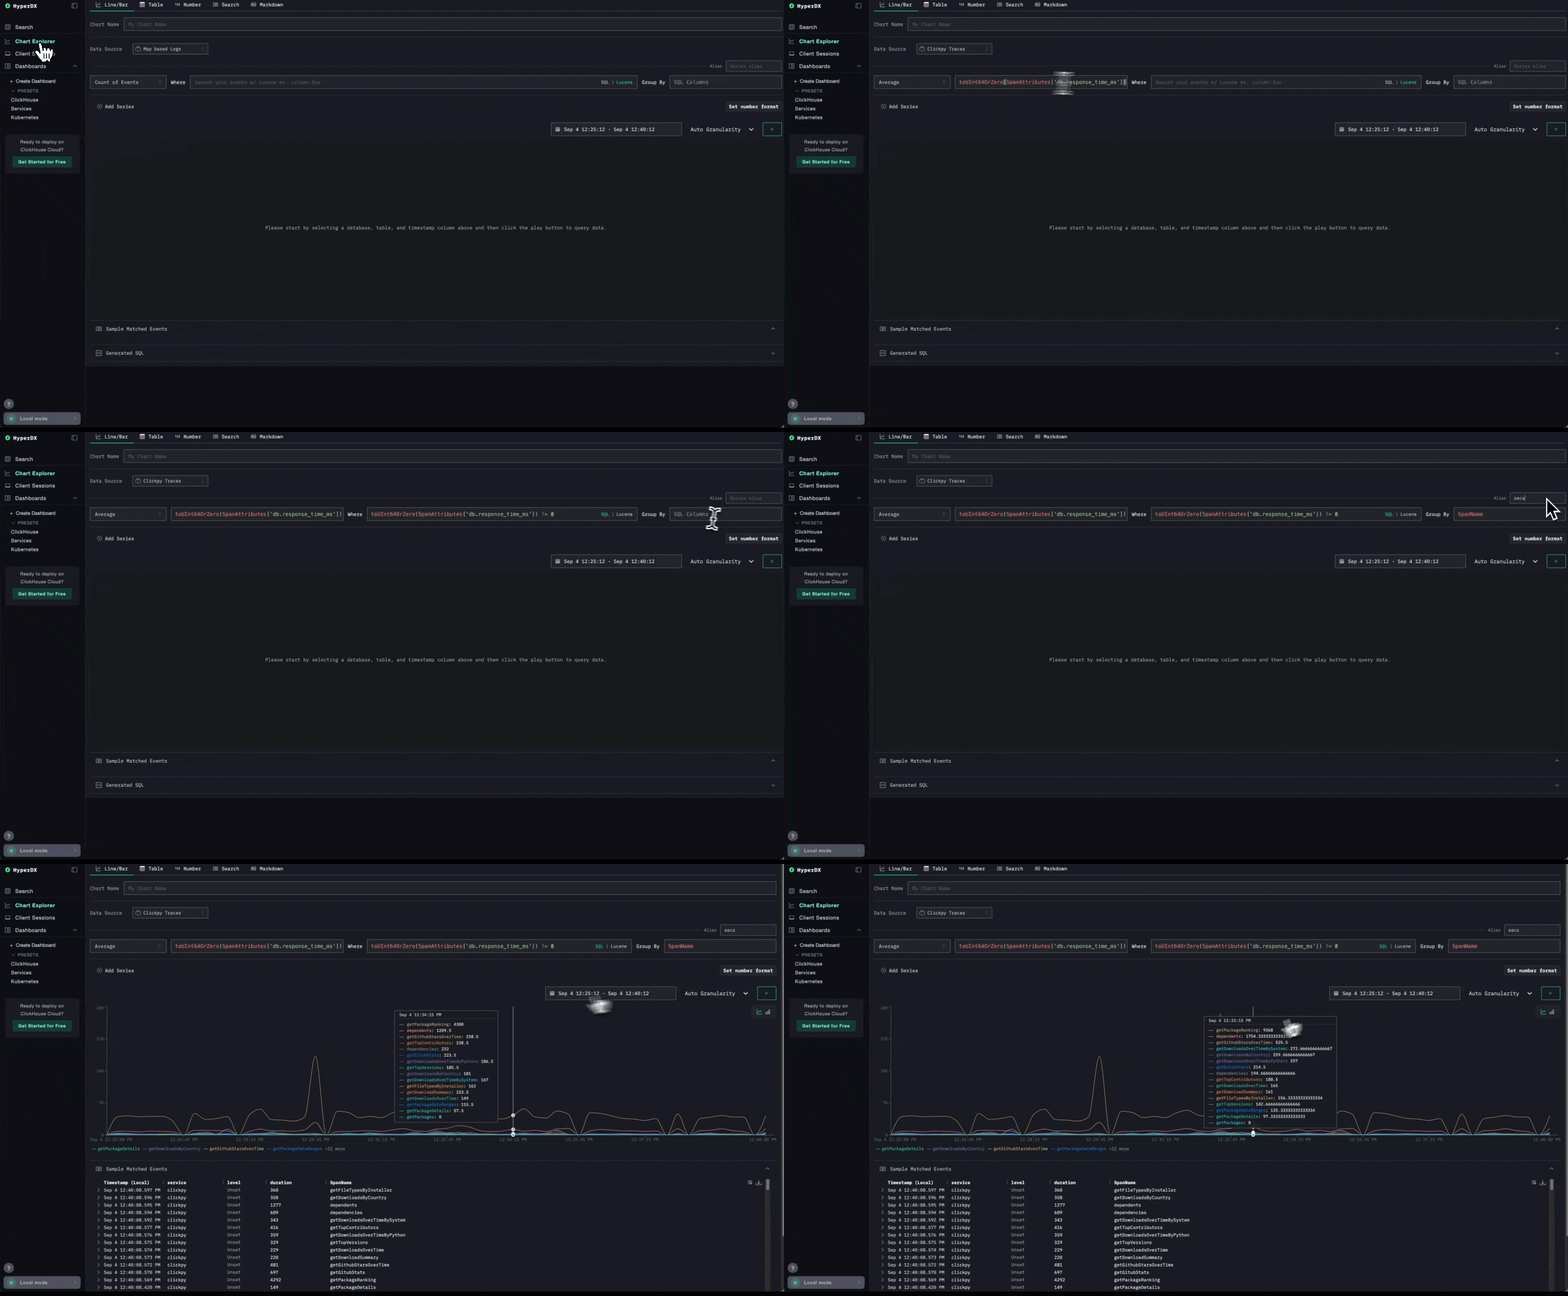
We can immediately see that the getPackageRanking query is the most expensive one, taking over 4s on average. This visualization aims to show how the package ranks relative to its peers for total downloads.
Based on our user experience, we suspected this query was the slowest to run. Although this visual loads asynchronously, empirically showing how dramatic its performance is relative to the components on the page has led to some work to improve its performance.
Looking at the performance over time for each visualization, we also see some dramatic spikes in latency for other visualizations. If we look at the visualization types, they all originate from the landing page for clickpy.clickhouse.com where we show “emerging” and “hot” packages. While this largely correlates with site activity, this has led to a deeper investigation for us to understand the cause of these spikes.
The ClickHouse Cloud service hosts a number of public demos, making diagnosis more challenging as query load can vary. The service also allows users to execute arbitrary SQL queries when exploring public datasets in sql.clickhouse.com. This level of app introspection has initiated a number of optimization efforts as a result.
Correlating observability and application data #
Moving beyond HyperDX as the visualization layer, we can use other visualization tooling to perform more complex analytics using SQL - again using the same observability data. This illustrates the benefit of treating observability data as just another data problem.
In the examples below, we use ClickHouse Cloud’s visualization capabilities; however, the same visualizations could easily be built using tools such as Grafana or Superset.
A simple example: what are the most popular packages users explore in ClickPy?
Again, we extract the package from the location.href column and identify the number of unique visitors in the last 12 hours using the rum.sessionId value.
The above simple example would be achievable with most observability tools. But suppose we wanted to go further and correlate our application data with our observability data.
For example, we have often wondered if ClickPy is appreciably slower for more popular packages. This may seem intuitive as more popular packages = more rows in ClickHouse. However, our use of incremental materialized views should negate this - compute aggregates at insert time and exploit background merges to keep the number of rows per project relatively constant.
Incremental materialized views shift computation from query time to insert time by persisting the results of a SELECT query. As new rows are inserted, the defined SQL query is applied immediately, and the results are written to a target table. Queries against this target are significantly faster since the heavy computation has already been performed. Background merges then consolidates partial aggregates for the same GROUP BY key, ensuring accurate and efficient results over time. For more details, see the documentation
For this, we need a query that asks whether queries for high-download packages (i.e., those contributing more to our ~1.8T rows) load any slower than queries for less frequently downloaded packages. If ClickPy is implemented well, larger packages shouldn’t be noticeably slower.
To answer this, we need to correlate observability data with application data.
First, total downloads per package (via the pypi.pypi_downloads_per_day materialized view) from our application data:
To measure package-level performance in ClickPy, we use the average query response time from ClickHouse i.e., the db.response_time_ms column. The package name is embedded in the span attributes as a JSON string, which we extract using schema-on-read with the JSONExtractString function.
1SELECT
2  JSONExtractString(SpanAttributes['db.parameters'], 'package_name') AS project,
3  avg(toUInt64OrZero(SpanAttributes['db.response_time_ms'])) AS avg_performance
4FROM otel_clickpy.otel_traces
5WHERE JSONExtractString(SpanAttributes['db.parameters'], 'package_name') != ''
6  AND toUInt64OrZero(SpanAttributes['db.response_time_ms']) > 0
7GROUP BY project
8ORDER BY avg_performance DESC
We join these two query result sets using an INNER JOIN, and create a scatter plot in ClickHouse Cloud (downloads on x, average response time on y) to visually check for any correlation between popularity and page/query latency. If our design holds, the trend should be flat rather than increasing linearly from bottom left to right.
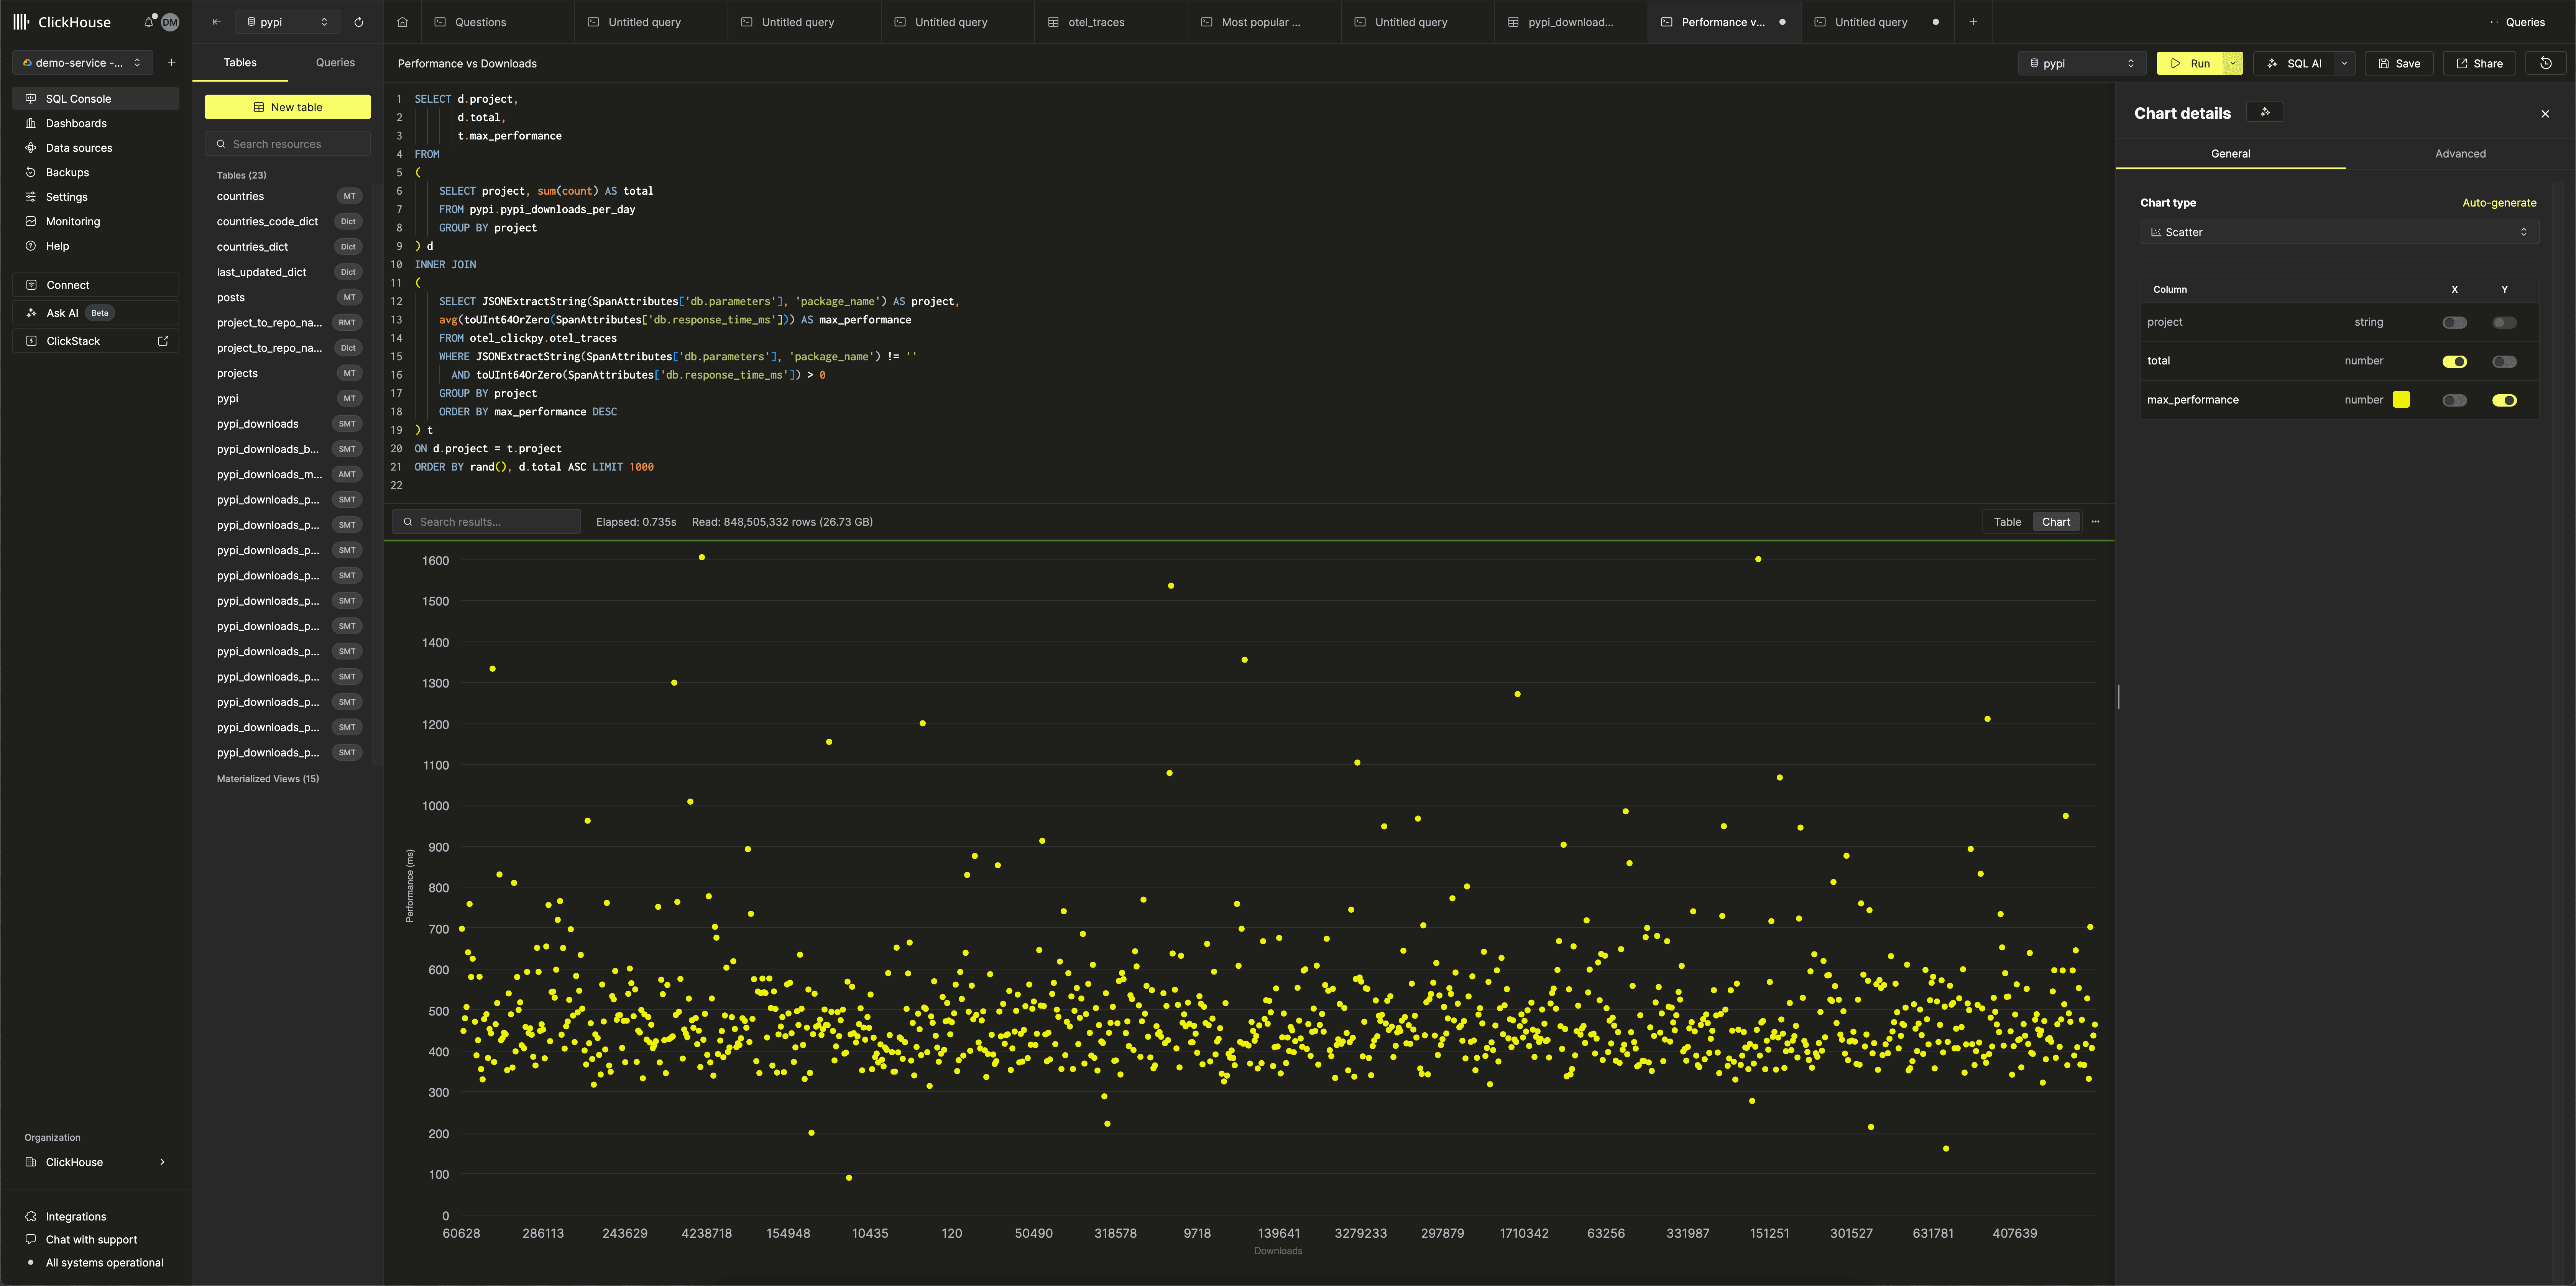
As shown, aside from some anomalies worthy of investigation, we have a fairly flat trend - encouraging that our performance isn’t degrading for larger packages!
As a final step, we can exploit ClickHouse’s statistical functions to test for correlation. The corr function computes the Pearson correlation coefficient between two numeric columns, where 1 indicates a strong positive linear relationship, -1 a strong negative one, and 0 no correlation.
We extend our query to compute the correlation between package downloads (total) and two performance measures: average and maximum response times of the ClickHouse queries.
1SELECT
2    corr(total, max_performance),
3    corr(total, avg_performance)
4FROM
5(
6    SELECT
7        d.project,
8        d.total,
9        t.max_performance,
10        t.avg_performance
11    FROM
12    (
13        SELECT
14            project,
15            sum(count) AS total
16        FROM pypi.pypi_downloads_per_day
17        GROUP BY project
18        ORDER BY total DESC
19        LIMIT 1000
20    ) AS d
21    INNER JOIN
22    (
23        SELECT
24            JSONExtractString(SpanAttributes['db.parameters'], 'package_name') AS project,
25            max(toUInt64OrZero(SpanAttributes['db.response_time_ms'])) AS max_performance,
26            avg(toUInt64OrZero(SpanAttributes['db.response_time_ms'])) AS avg_performance,
27            quantile(0.9)(toUInt64OrZero(SpanAttributes['db.response_time_ms'])) AS p90_performance
28        FROM otel_clickpy.otel_traces
29        WHERE (JSONExtractString(SpanAttributes['db.parameters'], 'package_name') != '') AND (toUInt64OrZero(SpanAttributes['db.response_time_ms']) > 0)
30        GROUP BY project
31        ORDER BY max_performance DESC
32    ) AS t ON d.project = t.project
33    ORDER BY rand(), d.total ASC
34    LIMIT 1000
35)
These results suggest only a weak correlation between downloads and average or maximum response time.
Try ClickStack today #
Deploy the world’s fastest and most scalable open source observability stack, with one command.
Conclusion #
Instrumenting an application with OpenTelemetry and ClickStack takes just a few lines of code, yet immediately unlocks deep visibility into performance and behavior. With traces and session replays flowing into ClickHouse, we can pinpoint slow queries, investigate anomalies, and understand the real-world user experience in real time.
More importantly, ClickStack goes beyond traditional observability: because analytics data and observability data live side by side in the same engine, we can directly correlate application metrics (like package downloads) with performance metrics (like query latency). This unified view turns observability into a data problem—a concept detailed in our observability cost optimization playbook and Mastering Kubernetes Observability guide — and one that ClickStack is uniquely equipped to solve, presenting a powerful New Relic alternative for teams looking to escape per-seat pricing and take control of their data.
While this post has focused on traces, we haven’t explored logs here. In later posts, we’ll show how collecting and correlating logs with traces in ClickStack is just as simple and equally powerful for debugging and insight.


