 51k
Extensive testing and comparison showed that ClickHouse outperformed other solutions like Elasticsearch in three key areas: performance, compatibility, and cost-efficiency for large-scale operations.
- Comparisons
- Observability
ClickHouse Observability vs Elastic Observability
ClickHouse Observability is the turnkey, fully managed observability solution for SREs and their agents, built on open source ClickStack. Investigate high-cardinality logs, metrics, traces, and session replays with the context to find root cause.
- Cut costs. Keep more history. Efficient compression makes full-fidelity telemetry affordable to retain for longer, without sampling or roll-ups.
- Investigate faster, with agents at scale. Fast, concurrent queries and expressive SQL let SREs and agents explore possible causes in parallel across high-cardinality telemetry.
- Built on open source and open standards. Keep your OpenTelemetry instrumentation, use familiar SQL, and connect your preferred agents through MCP.
- Leave the platform to us. Send telemetry to one endpoint. We handle ingestion, schemas, storage, optimization, and scaling.
Why teams moved their observability to ClickHouse

Lower costs. Faster investigations. More context for your agents.
Get the performance and efficiency of ClickHouse for your observability, whether you’re moving from Elasticsearch clusters or Elastic Serverless.
ClickHouse vs Elasticsearch: engine benchmark
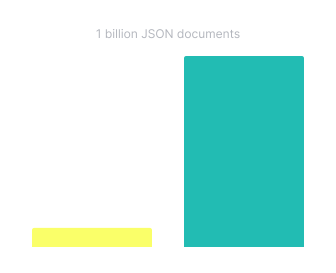
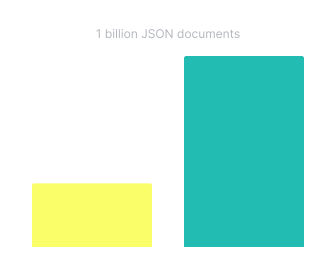
4–6x
Faster queries
20%
Of the storage footprint
ClickHouse 26.3 vs Elasticsearch 9.3.2 on identical single-node hardware. Results vary by workload and configuration. View benchmark.
ClickHouse
7.41 s ClickHouse
 Elasticsearch
30.6 s Elasticsearch
ClickHouse vs Elasticsearch
The engine makes the difference
More work per node. Less infrastructure to manage.
ClickHouse makes it easier to scale vertically on larger machines without JVM heap-sizing tradeoffs, helping reduce node counts and network coordination.
- Faster queries: Vectorized, parallel execution delivers low-latency searches and aggregations, with high concurrency for SREs and agents.
- Higher compression: Columnar storage and specialized codecs reduce storage requirements and query data reads.
- Native object storage: Retain full-fidelity telemetry for longer on low-cost object storage.
That engine efficiency is the foundation of ClickHouse Observability. We handle ingestion, storage, optimization, and scaling, giving SREs and agents more time to investigate.
1 Queries executed

1 Queries executed
Why choose ClickHouse Observability?

Performance at scale
Search logs, aggregate high-cardinality telemetry, and compare historical patterns with the speed SREs and agents need to investigate production.

Lower costs, longer retention
Efficient compression and storage make it affordable to retain raw telemetry for longer, so investigations have the evidence that sampling and short retention can remove.

Unified observability
Connect logs, metrics, traces, and session replays to follow a failing request across services and understand which customers are affected.

Open source and open standards
Powered by open source ClickStack (MIT + Apache 2.0), with OpenTelemetry, SQL, and MCP at its core. Keep your instrumentation and connect the agents and tools your team already uses.
Cost-efficient, volume-based pricing
Price logs and traces by the data you ingest, and metrics by the data points you send. Keep full-fidelity telemetry with a fully managed experience that handles ingestion, storage, optimization, and scaling for you.
Logs, traces, and session replays
Per uncompressed GB ingested
$0.10 / GBGA rate $0.20
Metrics
Per million data points ingested
$0.05 / millionGA rate $0.10
Give agents investigation tools and the full power of SQL
Give your agents more than tools to build dashboards. Purpose-built MCP tools let them search logs, follow traces, and analyze event patterns and deltas.
For deeper analysis, ClickHouse Observability provides expressive SQL with broader join capabilities than Elastic’s ES|QL. Agents can correlate signals, compare historical patterns, and calculate trends using a language they already know.
Turn findings into saved searches, dashboards, and alerts through MCP.
Your agent in
Claude Code
Your agent in
Cursor
Your agent in
Codex
Your agent on
Your framework
ClickHouse Observability
Semantic tools
Search logsFollow tracesEvent patternsEvent deltas
SQL
Investigate in parallel with full context
Fast, concurrent queries let agents explore possible causes in parallel, compare evidence, and reach answers sooner across unsampled logs, metrics, and traces.
ClickHouse’s efficient compression and storage make full-fidelity telemetry affordable to retain for longer - giving agents the context to compare deployments, identify recurring failures, and distinguish regressions from normal behavior.
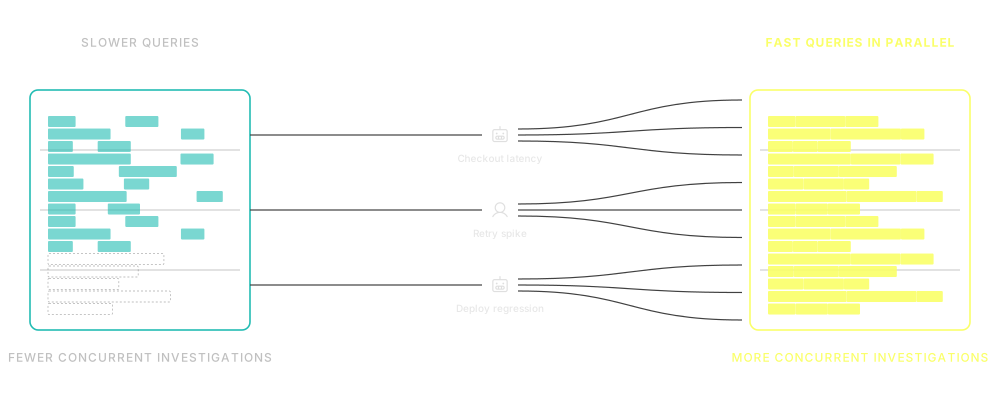
Explore possible causes in parallel. Reach answers sooner.
Advanced controls: self-managed experience
Give agents room to investigate. Keep workloads under control.
For teams using the self-managed experience, apply query limits and usage quotas to the database identities your agents use. Run investigations on dedicated compute while dashboards and alerts use separate compute over the same telemetry. Scale workloads independently without duplicating data.
Self-managed experience
Workload schedulingQuery complexity limitsQuotasSettings constraints
Compute pool
Agent investigations
Compute pool
Dashboards
Compute pool
Alerting
ClickHouse Observability
The open source stacks behind your observability solution
Both stacks combine telemetry collection, a database, and an investigation UI: OpenTelemetry, ClickHouse, and the ClickStack UI for ClickStack; Logstash, Elasticsearch, and Kibana for the Elastic Stack.
Today, both are available through managed observability products, while their underlying engines differ in query execution, compression, and analytical flexibility.




ClickStackManaged deployment: ClickHouse Observability
Elastic StackManaged deployment: Elastic Cloud Hosted / Serverless
How do the ClickHouse and Elasticsearch architectures differ?
Elastic Observability runs on Elasticsearch, a distributed search engine built around Lucene indexes and shards. Each shard adds memory overhead, while distributed queries require coordination across shards whether you run Elasticsearch yourself, on Elastic Cloud Hosted, or on Elastic Cloud Serverless.
ClickHouse Observability runs on ClickHouse, a columnar engine built for compression and parallel SQL analytics. ClickHouse’s original shared-nothing architecture evolved in ClickHouse Cloud to shared storage and independent compute, supporting fast investigations and affordable retention of unsampled telemetry.
ClickHouse ObservabilityPowered by ClickHouse
- Yes
Native S3-backed tables in open source ClickHouse; shared object storage in ClickHouse Cloud.
- Yes
Exact
GROUP BYand distinct counts. - Yes
Fully columnar, with type-specific codecs.
- YesManaged OpenTelemetry endpoint.
- YesSelf-managedClickPipes and custom pipelines.
- Yes
Native
JSONwith typed subcolumns; mixed types per path. - YesClickHouse runs 1,000 concurrent queries per replica by default in Cloud.
- YesSelf-managedLimits adjustable per service.
- Yes
Parallel across cores and replicas, or shards when self-managed.
- Yes
Inner, outer, cross, semi, anti and
ASOFjoins. - YesSelf-managedIncremental and refreshable materialized views in SQL.
- Yes
Native SQL: joins, window functions, subqueries.
- Yes
Lucene-style search in the ClickStack UI.
- Yes
Turnkey or self-managed on ClickHouse Cloud; self-hosted ClickStack.
- Yes
Shared object storage, independent compute in ClickHouse Cloud.
- Yes
Stateless compute over shared storage in ClickHouse Cloud.
- Yes
Queryable on insert or async flush.
- Yes
Async inserts batch small writes.
- Yes
Native text indexes alongside columnar storage.
- Yes
HTTP interface for SQL and ingestion.
- YesSelf-managedIncremental materialized views at insert time.
 Powered by Elasticsearch
- Intermediate—Hosted / self-managedSearchable snapshots need an Enterprise subscription.
- YesServerlessObject storage managed for you.
- Intermediate—
termscounts can be approximate. - Intermediate—
Indexes plus doc values; columnar modes in technical preview.
- Yes
Managed OTLP endpoint, Elastic Agent, Beats, Logstash.
- Intermediate—
Mappings fix each field’s type; conflicts need coercion or mapping changes.
- Intermediate—Elasticsearch search fan-out can exhaust thread pools; depends on shards and replicas.
- Intermediate—ServerlessCapacity managed for you; limits not configurable.
- Yes
Distributed across shards; multicore via ES|QL.
- Intermediate—
ES|QL
LOOKUP JOINonly: a left join on a single-shard lookup index. - Intermediate—
Downsampling for time series; transforms limited to pivot or latest.
- Intermediate—
Elasticsearch SQL restricts nested fields, subqueries and aggregation sorting; ES|QL is separate.
- Yes
Lucene syntax and KQL in Kibana.
- Yes
Elastic Cloud Hosted, Elastic Cloud Serverless, or self-managed.
- YesServerlessStorage separated from indexing and search compute.
- NoHosted / self-managedNode-attached storage; data tiers move shards between nodes.
- YesServerlessStateless compute over shared storage.
- NoHosted / self-managedStateful data nodes.
- Yes
Searchable after index refresh.
- Yes
Single-document and bulk APIs.
- Yes
Lucene inverted indexes.
- Yes
REST APIs for indexing, search, SQL and ES|QL.
- Intermediate—
Ingest pipelines are per document; summaries need transform jobs.

Lower costs, more context
Efficient compression and affordable retention deliver up to 10x cost savings while you keep the telemetry and history investigations need.

Managed from ingestion to scaling
Send telemetry to one endpoint. We handle schemas, storage, optimization, and scaling.

Built for high cardinality
Keep user, trace, and container IDs for detailed investigations across affected requests, services, and customers.

Open and interoperable
Keep OpenTelemetry instrumentation and connect your preferred agents through MCP and SQL.
Migrate your workload from Elastic Observability today
Cut costs, boost performance, and unlock agentic workloads with full-fidelity telemetry and the historical context to resolve failures faster. Leave ingestion, storage, optimization, and scaling to us.

FAQs
Answers about ClickHouse Observability, migration from Elastic, and the options for your team.
01
ClickHouse Observability is the turnkey, fully managed observability solution for SREs and their agents, powered by open source ClickStack. It brings logs, metrics, traces, and session replays together, with ingestion, schemas, storage, optimization, and scaling managed for you.
Elastic Observability is built around Elasticsearch and Kibana, whether you run Elasticsearch yourself, use Elastic Cloud Hosted, or use Elastic Cloud Serverless. ClickHouse Observability uses ClickHouse's columnar engine for fast searches, high-cardinality aggregations, and deep SQL analysis. Efficient storage makes longer retention of full-fidelity telemetry affordable, giving investigations more context without sampling or roll-ups.
02
ClickStack is the open source observability stack for SREs and their agents. You deploy and operate it on your own infrastructure, with control over your data, schemas, and retention.
ClickHouse Observability provides a managed experience built on that foundation. You get the familiar ClickStack UI and investigation tools, while we handle ingestion, storage, optimization, and scaling. The turnkey experience previously referred to as ClickStack Cloud is part of ClickHouse Observability.
ClickStack remains open source: ClickHouse and the OpenTelemetry Collector use Apache 2.0 licenses, while the ClickStack UI, based on HyperDX, uses the MIT license. Licensing details
03
ClickHouse Observability is fully managed. We handle ingestion, schemas, the database, storage, and scaling. Just send telemetry to your managed OpenTelemetry endpoint, investigate in the ClickStack UI, or connect your agents through MCP. Pricing is volume-based: on the Scale plan, list prices are $0.20 per uncompressed GB for logs, traces, and session replays and $0.10 per million metric data points. The 50% beta discount reduces these to $0.10 per GB and $0.05 per million data points. Pricing details.
Self-managed ClickHouse Observability, formerly Managed ClickStack, gives you control over database configuration and capacity. You manage your collector, schemas, compute sizing and scaling, and read/write isolation using warehouse services, tuning the deployment as your workload changes. ClickHouse Cloud still operates the underlying infrastructure. You pay for compute and storage resources under standard ClickHouse Cloud pricing, rather than telemetry ingested.
04
ClickHouse combines columnar storage, vectorized execution, and parallel processing to search and aggregate large telemetry datasets efficiently. Queries read the columns they need, while compression reduces storage and data movement. This supports fast investigations across high-cardinality fields such as user IDs, trace IDs, and container IDs.
Elasticsearch's search-oriented architecture carries different indexing and query-execution costs. In our billion-document JSON benchmark, ClickHouse delivered approximately 10x faster aggregations using half the storage. These are engine results for ClickHouse and Elasticsearch, not a benchmark of the two managed services, and they depend on the workload and configuration. Benchmark and methodology
05
ClickHouse's compression and efficient execution reduce the compute and storage needed for observability. Open source ClickStack can reduce infrastructure costs by up to 4x compared with self-managed Elasticsearch deployments, depending on the workload. Existing infrastructure comparison
ClickHouse Observability brings the same engine efficiency to a turnkey service, with pricing based on logs and traces ingested and metric data points. Your savings depend on telemetry volume, retention, and usage, and on whether you compare against self-managed infrastructure, Elastic Cloud Hosted, or Elastic Cloud Serverless. The open source infrastructure comparison is not a fixed discount on the managed service. See the pricing page for current rates.
06
ClickHouse Observability brings together three layers:
- Managed OpenTelemetry ingestion: One endpoint for collecting logs, metrics, and traces.
- ClickHouse: The columnar engine for efficient storage, fast searches, and SQL analysis.
- ClickStack UI: A shared interface for log search, trace waterfalls, metrics, session replays, dashboards, and alerts.
ClickHouse manages these layers for you. Agents can access investigation tools through the ClickStack MCP server and use SQL for deeper analysis.
07
Yes. ClickHouse Observability brings these signals together so you can follow a failing request across services, inspect its logs and spans, and understand the customer impact. Retain high-cardinality attributes and historical telemetry to investigate individual requests and compare behavior over time. ClickStack capabilities
08
Yes. OpenTelemetry is the default collection standard. Send logs, metrics, and traces from your existing OpenTelemetry SDKs and collectors to a managed endpoint. ClickHouse handles the ingestion pipeline, schemas, storage, optimization, and scaling.
09
Yes, through open source ClickStack or the self-managed experience. ClickStack is OpenTelemetry-first, but not OpenTelemetry-exclusive. Store timestamped events in ClickHouse using your existing schemas and pipelines, then configure the ClickStack UI's field mappings. Trace correlation and other specialized views require the relevant fields. ClickStack integration options
10
Connect your agents through MCP to search logs, follow traces, and analyze event patterns and deltas. SQL enables deeper investigations across signals, historical patterns, and trends. Agents can save useful findings as searches, dashboards, and alerts.
Fast concurrent queries let agents explore possible causes in parallel. Full-fidelity telemetry and affordable long-term retention give them the evidence and history to investigate recurring failures. Agent investigation capabilities
11
ClickHouse combines parallel query execution with efficient columnar storage to handle growing ingestion volumes and concurrent investigations. ClickHouse Cloud separates storage from compute, allowing query capacity to grow without duplicating the entire retained dataset. ClickHouse Observability scales this for you; the self-managed experience exposes replicas, hardware profiles, and quotas.
Elasticsearch distributes work across shards, so shard sizing and query coordination remain engine considerations for performance. Who operates that differs by deployment: with self-managed clusters or Elastic Cloud Hosted, your team sizes nodes and shards, while Elastic Cloud Serverless manages nodes, shards, and scaling automatically and separates storage from indexing and search compute. ClickHouse's advantage comes from combining that flexibility with its analytical engine and compression.
12
Choose self-managed if you have an experienced engineering team with the resources to configure and optimize your database, and want the lowest possible unit costs. You control schemas, ingestion pipelines, query optimization, and workload configuration, while ClickHouse Cloud manages the underlying infrastructure.
For most teams, the default turnkey experience is the simpler choice: send your telemetry and let us operate the platform.
13
Yes. Start by sending telemetry to ClickHouse alongside your existing Elastic deployment, then validate searches, dashboards, alerts, and retention before switching over.
Existing OpenTelemetry instrumentation can help simplify the transition. Kibana dashboards, detection rules, and historical indices need separate migration planning; they are not automatically converted. Use the migration guide linked on this page to plan the move.


