 50.8k
During this past Black Friday and Cyber Monday, a minute of downtime can cost our merchants $5.1 million. That's why observability is critical, we need to detect issues and prevent any downtime. We saw around a 16x improvement out of the box with ClickHouse once we had it deployed, and at peak performance over 30x. And for us, less compute is money.
- AI SRE
Observability built for agents, not just dashboards
Build SRE agents on full-fidelity, high-cardinality telemetry with fast queries, long-term retention, and purpose-built investigation tools. ClickHouse Observability handles ingestion, storage, and scaling so you can focus on your agents and investigations.
Your agent in
Claude Code
Your agent in
Cursor / IDE
Your agent in
AI notebooks
Your agent in
OpenAI Codex
Your agent on
Internal platform
Your agent in
OpenCode
ClickHouse Observability
logstracesmetricseventsexceptions
Trusted for observability by





ClickHouse played an instrumental role in helping us develop and ship Claude models. With ClickHouse, our database is green, queries are lightning-fast, and money is no longer on fire. It’s already delivered tremendous value in helping us build state-of-the-art language models.
Maintaining a high-quality service is just impossible without always-on, AI-assisted triage, which is amazing with an off-the-shelf agent and access to ClickHouse Observability.
Why build SRE agents on ClickHouse Observability
SRE agents demand more than dashboards. Built on ClickHouse, ClickHouse Observability combines high-concurrency analytics, full-fidelity telemetry, and semantic investigation tools to help agents investigate faster, reason more consistently, and operate at agent scale.

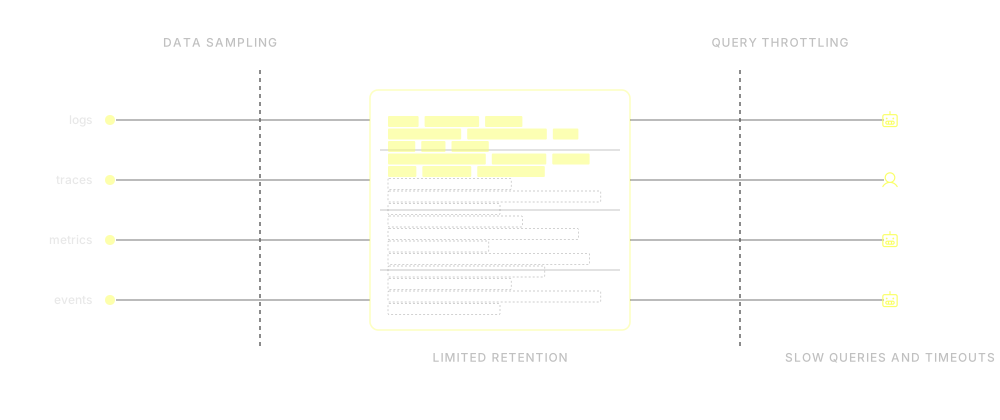
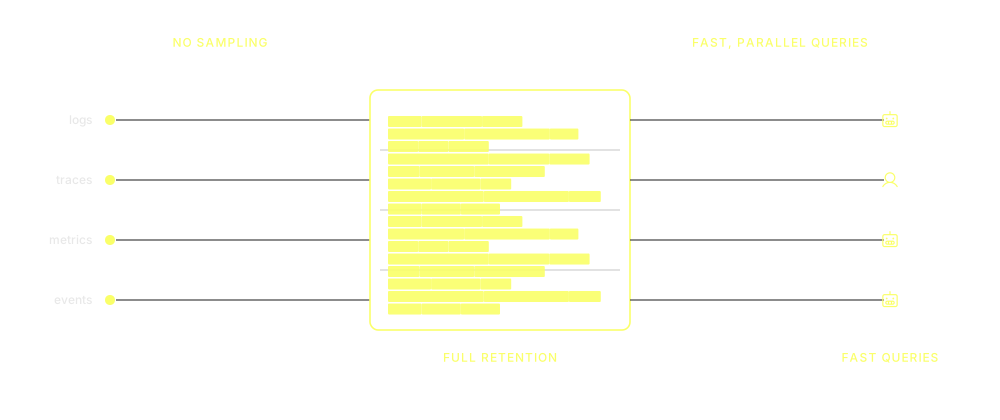
100%Telemetry retained
Agents investigate every log, trace, metric, and event with complete context, eliminating the blind spots introduced by sampling.
FullRetention
Long-term observability data provides the historical context agents need to identify trends, regressions, and recurring patterns.
FastParallel queries
Agents explore hypotheses and correlations in parallel, reaching answers sooner with fast, concurrent ClickHouse queries.
<1sQuery speed
Sub-second analytics keep investigations collaborative, allowing agents and humans to explore, validate, and iterate together in real time.
The way SREs work is changing
Observability is no longer just a human workflow. As SREs increasingly rely on agents to investigate incidents and automate analysis, they need more than dashboards and manual workflows.
ClickHouse Observability provides an agent-native observability interface, combining semantic investigation tools with the speed and scale of ClickHouse.
Traditional observability
- Dashboard-first interfaces, human-centric workflows
- MCP wrapper around existing APIs
- Raw query interfaces
- Proprietary APIs and query languages
- Per-user, host, or query pricing
- Query rate limits
- Sampled telemetry data
- High-cardinality tags dropped to control costs
- Limited retention and historical context
AI SRE observability
- Agent-native workflows, human-agent collaboration
- MCP-first architecture
- Semantic investigation tools
- Standard SQL and rich analytics
- Resource-based pricing
- Fast, parallel queries
- Unsampled telemetry data
- High-cardinality user, trace, and container IDs retained
- Long-term data retention, full historical context
Your workflows. Your harness. Your agents.
Bring your own observability agents
Connect any agent or agent framework to ClickHouse Observability through MCP and enable it to investigate systems, automate operational workflows, and turn findings into persistent dashboards and alerts.
- Claude Code
- Codex
- Cursor
- OpenCode
- Custom Agents
- Internal Frameworks
claude-code — ~/incident-1247
You build the agents. We provide the platform.
Build SRE agents on full-fidelity logs, metrics, and traces, with fast queries, long-term retention, and purpose-built investigation tools. Send your OpenTelemetry data to one managed endpoint and we’ll handle ingestion, storage, optimization, and scaling.
App SDKsOTel collectorsLog shippers
Your infrastructure
ClickHouse Observability
Fully managed · Powered by ClickStackIngestion OpenTelemetry endpoint
Human interface
AI notebooksSearchDashboardsAlerts
Evidence, agent steering, collaboration
Agent interface
MCP · SQL
SearchTrace waterfallsEvent patternsEvent deltas+ more
Purpose-built tools for investigation
Logs · Metrics · Traces
High cardinality · No sampling · Full retentionHandled for youSchema optimization · Workload isolation · Auto-scaling
SREs · Engineers
Your team
Claude · CodexCursor · Custom agentsCode · Runbooks
Your agents
Semantically rich tools, not just raw SQL
ClickHouse Observability exposes specialized observability tools through MCP that encode investigative knowledge, correlate signals across telemetry sources, and execute common workflows with greater accuracy, efficiency, and consistency.
For deeper analysis, agents can use ClickHouse SQL directly, with the full flexibility of the underlying telemetry data.

Time series
Query and visualize metrics over time. Show error rates, latency percentiles, and throughput so trends and anomalies surface before they escalate.

Trace waterfall
Drill into a single request and see every span across services to identify which hop is slow or failing.

Event deltas
Surface what changed in a time window, including new error classes, event types, and sources so agents can pinpoint root causes quickly.

Event patterns
Cluster and surface recurring patterns in logs and events. Agents quickly understand what normal looks like versus what is different.

Time-consuming operations
Break down trace execution time by operation to surface the services, endpoints, and dependencies contributing most to overall latency.

Search
Lucene-style full-text and structured search across logs, traces, and events. The primary tool for finding the needle in the haystack.

List sources
Discover every telemetry source connected to ClickHouse Observability, including fields, services, values, and metadata. Agents call this first to know what they can investigate.

SQL
Drop down to raw ClickHouse SQL when the semantic primitives are not enough. Agents keep full analytical power.
Investigate together in AI notebooks
ClickHouse Observability provides a native, AI-assisted notebook experience that brings SREs and AI together in a shared investigative environment built on the same MCP tooling your agents use.

Same MCP,
both sides
Notebooks call the same semantic tools your agents do: Time series, Trace waterfall, Event deltas, Search, SQL. No second toolset to learn.

Bidirectional
by design
Agents don’t just read. Through MCP they can create dashboards, set alerts, and persist runbooks that a human can pick up in the notebook.

Humans take
over mid-flight
Open the agent’s investigation in a shared notebook, drop into SQL when needed, and continue the thread with context, reasoning, and queries intact.
Loading video...
Why ClickStack MCP?
ClickHouse Observability includes the ClickStack MCP server. Your agents are only as good as the tools they have, and purpose-built MCPs deliver faster, more accurate, more efficient operational reasoning over generic implementations.
Accuracy
17% more accurate
ClickHouse MCP
ClickStack MCP
Correct root cause and remediation outcomes.
Efficiency
25% fewer tool calls
ClickHouse MCP
ClickStack MCP
Reaches the answer faster with fewer steps.
Consistency
2.7× more consistent
ClickHouse MCP
ClickStack MCP
Less variance in accuracy of responses from run to run.
Build your SRE agents on ClickHouse Observability
Give your agents full-fidelity telemetry, long-term context, and fast investigation tools, with ingestion, storage, and scaling fully managed.