50.5k
50.5k
Summary
- LinkedIn’s observability team runs distributed tracing and metric metadata discovery, and analytics on ClickHouse, after proving the database on tracing first.
- Even at 1% head sampling, that system generates around 0.8 trillion spans and 200 TB of uncompressed data per day.
- The metric metadata index consolidates three systems behind a single ClickHouse cluster, serving 150k+ queries/minute at 68ms average latency across 13B+ metrics.
- Migrating off a legacy stack cut memory use to roughly one-fifth and compute to about two-thirds, with headroom to double metric volume.
With over a billion members worldwide and thousands of interacting services, a single LinkedIn feed load or job search touches dozens of backend systems. When one of them slows down, finding the culprit means being able to see inside all of them.
That visibility falls to the company’s observability team, who own the full stack that keeps the platform measurable, from hosts, containers, services, and storage up through online, nearline, and offline workflows and real user monitoring, along with the ingestion, alerting, triaging, on-call, and visualization layers built on top. That stack covers every kind of observability signal, including metrics, logs, traces, events, profiles, and exceptions.
LinkedIn’s ClickHouse journey began two years ago with distributed tracing. As Arun Gupta detailed at an April 2026 ClickHouse meetup in San Francisco, the team put it into production across three data centers, building a system that handles roughly 800 billion spans a day and gives engineers a near-real-time troubleshooting surface. “This is just the beginning for ClickHouse at LinkedIn,” Arun said at the time.
At Open House SF 2026, staff software engineer Jacob Zelek picked up the thread, sharing the next step in LinkedIn’s observability journey: how the team consolidated a legacy metric metadata system onto a single ClickHouse index, resulting in a system that costs less to run and answers questions the old stack couldn’t, with plenty of room to grow.
LinkedIn’s initial chapter with ClickHouse
In 2024, Arun and the team were ramping up an OpenTelemetry-based distributed tracing system that follows a request end-to-end, from a member’s app down through every backend service it touches. Even at 1% head sampling, that system generates around 0.8 trillion spans and 200 TB of uncompressed data per day. They needed storage that could keep up with that volume on the write side and stay fast on the read side, since, as Arun puts it, “When someone sees a problem, or an engineer is debugging a feature they’re adding, they should be able to use our apps and see what the traces are showing very quickly.”
Among their targets for the system, end-to-end ingestion had to complete in under 10 seconds, listing traces over a two-hour window had to return within 2.5 seconds at P99, and fetching a full trace by ID had to come back in 750 milliseconds or less. They also wanted a 7-day retention policy, tiered storage, customizable indexes, and query workload isolation. Finally, whatever solution they picked had to support KQL, one of LinkedIn’s preferred query languages.
Today, the deployment spans three data centers. Each has its own ClickHouse cluster of 22 shards fed by PubSub and a tier of ingesters. The team runs a red-black setup, writing to two clusters and reading from one, with the second ready to take over if the first has trouble, and a third handling validation. The schema is flattened, with span attributes carried alongside, and runs 3x local replication over a distributed table. Compression is around 5x. Each node takes in 350,000 spans a second at steady state, bursting past 1.2 million at max load.
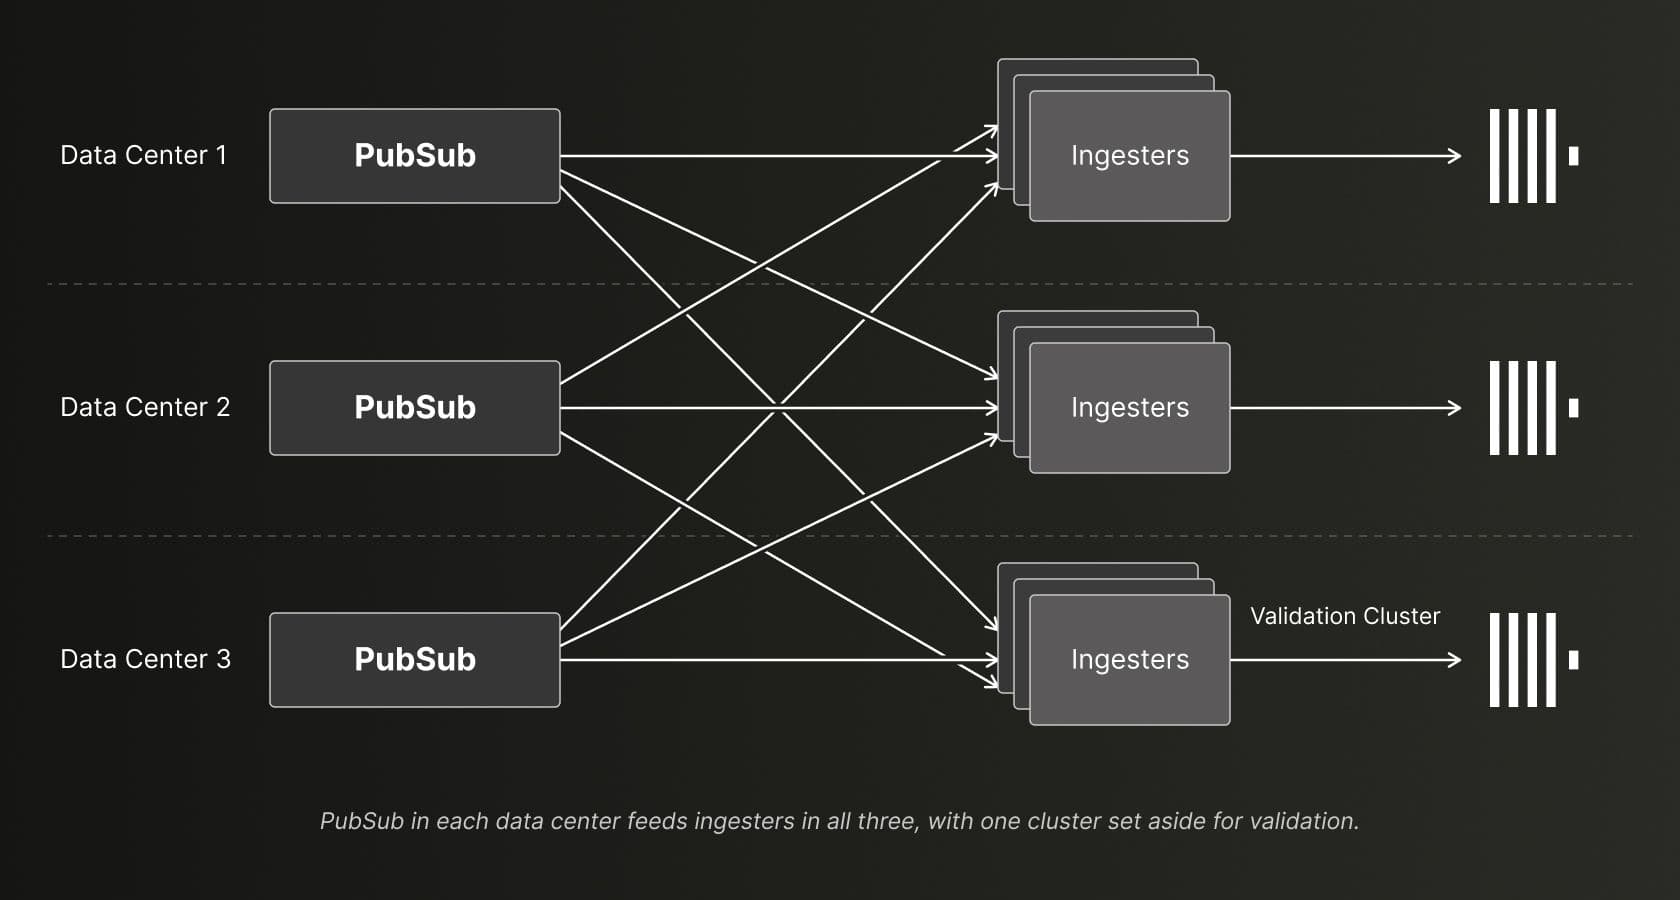
PubSub in each data center feeds ingesters in all three, with one cluster set aside for validation.
The team reordered the table to put low-cardinality columns first, repartitioned on the field they actually query, and tightened Bloom filter false-positive rates on the columns where it was cheap to do so, bringing queries to run in under two seconds. “This was pretty significant for us,” says Arun.
Just as important, the project put ClickHouse into production at scale and got several teams comfortable running it. That momentum proved key when LinkedIn’s observability team extended it from distributed tracing to metric discovery and analytics.
The next challenge: legacy metric metadata
Years ago, LinkedIn relied on a legacy time-series data logging and graphing system called RRDtool. However, the naming convention it introduced never left, and at LinkedIn’s scale and size, it had stayed.
Today, this metric is still referenced by an RRD, a single string that concatenates two to six standardized dimensions (e.g. “my-server/responses.status.200.rrd”). Originally, users could target a single metric, but at some point the team introduced the ability to apply a regex across many of them to generate multiple series in one graph, or a separate graph per match. “You can see why this starts to become a problem,” Jacob says.
That problem is compounded by the scale at which LinkedIn operates. The company has more than 13 billion metrics that are still referenced using RRD semantics, with roughly 30% daily turnover. Millions of graphs and alerts are defined this way, with dozens of tools and services still querying RRD metrics. Meanwhile, the metrics count keeps climbing, and new tools, services, and use cases keep getting onboarded.
The challenge for LinkedIn’s observability team was letting people discover and analyze across all of it. For example, engineers might want to ask which hosts emit a given metric, which RRDs a service emits, which metrics match a pattern across every service, and how unique metric counts are trending for growth tracking. “The big problem,” Jacob says, “is that we need people to be able to query these things until we can finally migrate everybody off of it.”
The older stack had grown into three separate services behind a single gateway. When Jacob joined, there was a custom in-memory search index and a custom in-memory KV store. He later introduced Elasticsearch hoping it could serve all the queries and let them remove the other services. “Unfortunately, it became yet another service to serve these queries,” he says, noting that Elasticsearch didn’t handle larger spanning aggregations very well, and returning large result sets meant serializing them in memory.
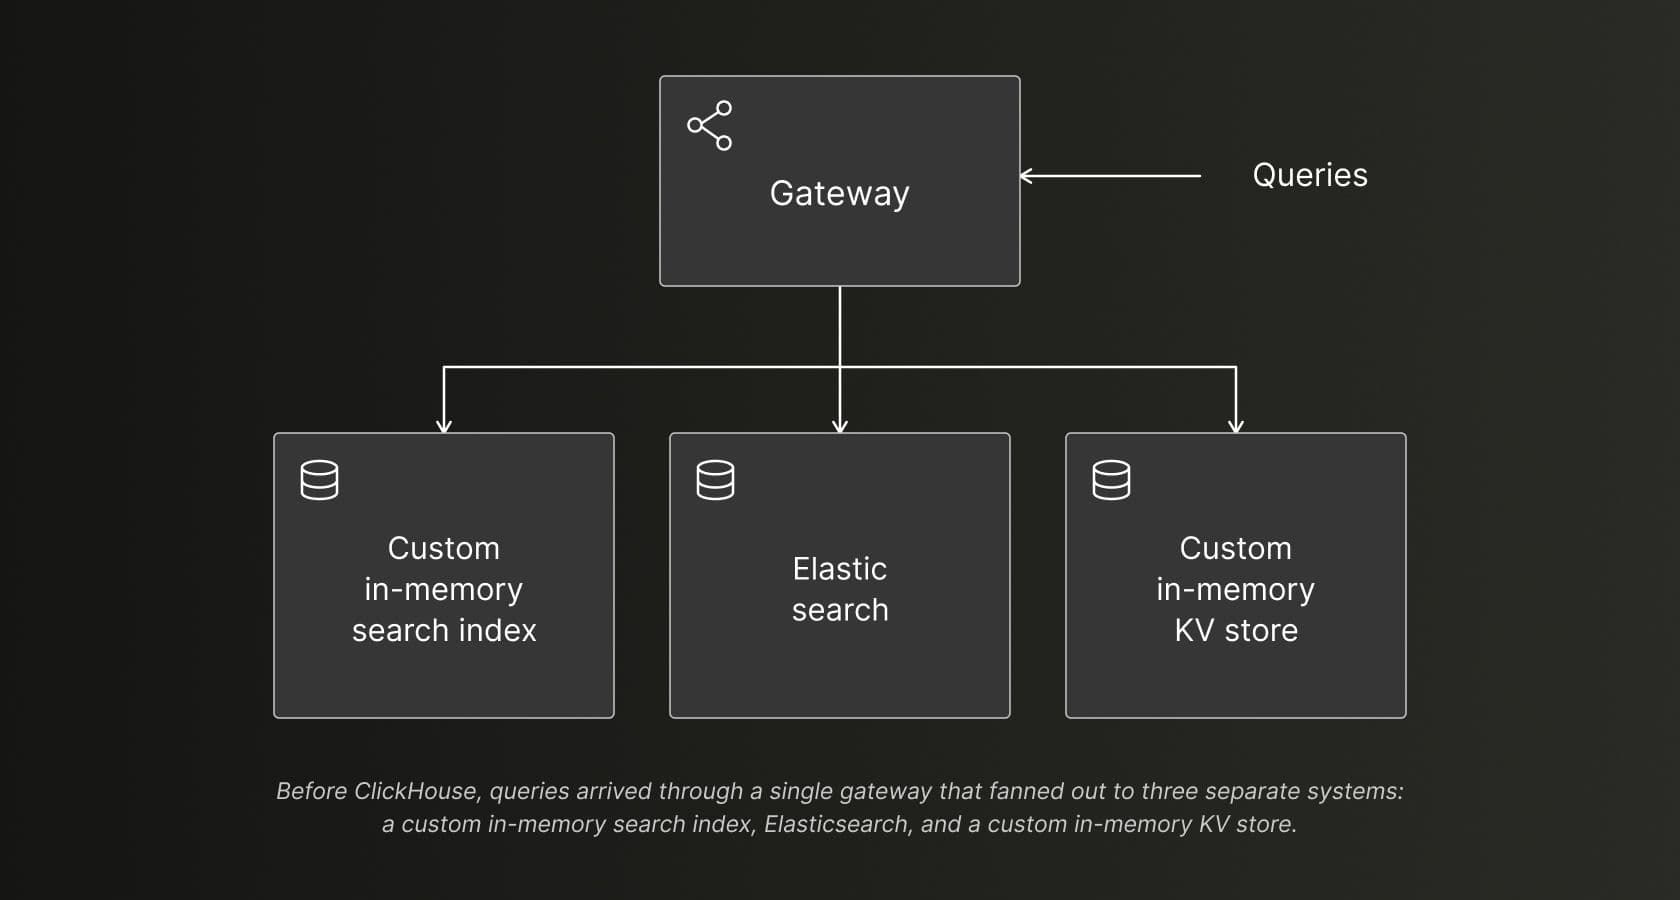
Before ClickHouse, queries arrived through a single gateway that fanned out to three separate systems: a custom in-memory search index, Elasticsearch, and a custom in-memory KV store.
By 2025, all three existing services had reached their scaling limits, managing three separate systems had become an operational burden, and even together they couldn’t serve some of the queries engineers were asking for. They needed a better solution.
Developing a ClickHouse ecosystem at LinkedIn
The team considered a number of options. Building yet another custom solution was unappealing, since, as Jacob puts it, “it would never be as flexible as a generic solution,” and the expertise would be limited to a handful of developers. “We’ve done this already and we weren’t trying to go down that route anymore,” he adds.
Sharded MySQL was a known quantity, but for the wrong reasons, as the team had previously used Vitess as a source of truth and found it couldn’t scale reads. Elasticsearch was already in hand and had already been tried, but the earlier attempt to migrate traffic onto it had failed, leading the team to keep it around for exploration purposes only.
ClickHouse, meanwhile, supported all existing queries. Benchmarked against the custom in-memory databases, most ran faster on ClickHouse, with the slower ones still well within acceptable bounds. Its quotas and query logs let the team see which team or service was driving each query, and, as Jacob says, “not only stop abusive queries, but also work with those teams to rewrite them to make them more efficient.” As a generic OLAP store holding every dimension, it allowed the team to support analytical queries they’d never thought of, some of which could be more efficient replacements for existing queries.
“The expertise we gained from using ClickHouse for tracing made onboarding a new project very easy. We’re starting to develop a ClickHouse ecosystem at LinkedIn.” — Jacob Zelek, Staff Software Engineer
“To us, expanding ClickHouse feels more comfortable than introducing another system like Elasticsearch, which people are moving away from, or trying to build something custom that only our team would understand,” says Jacob.
The new ClickHouse-based architecture for legacy metric metadata
The current architecture is “pretty simple,” Jacob says. The team’s time-series database feeds ClickHouse through a continual change-capture system, while the gateway that fronted every metadata query now rewrites those queries into SQL and runs them against ClickHouse.
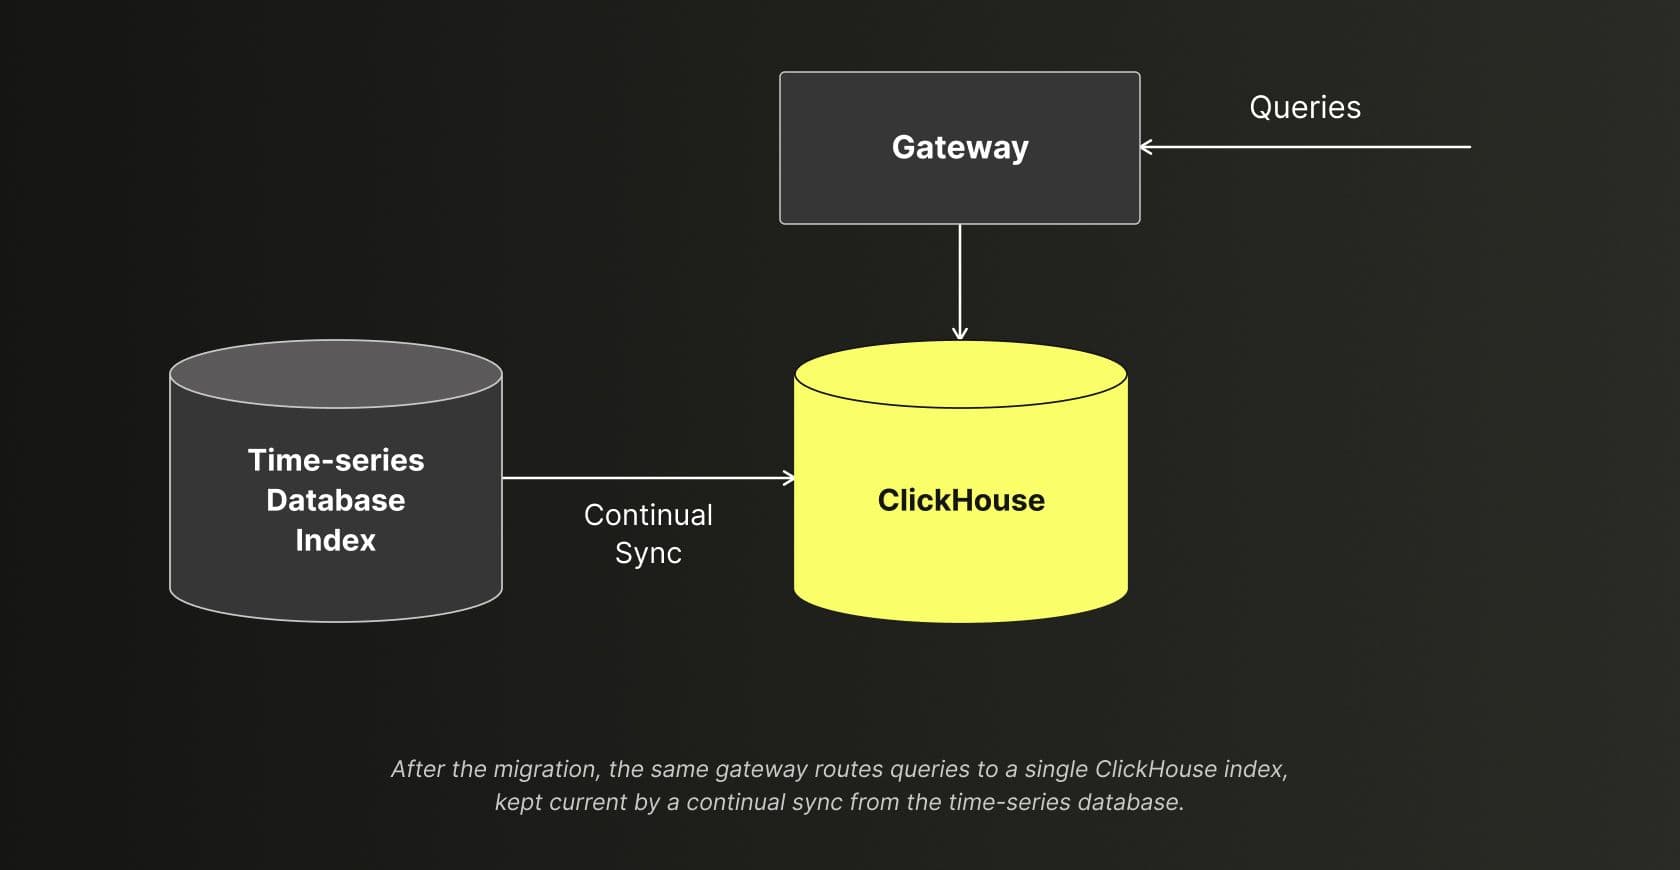
After the migration, the same gateway routes queries to a single ClickHouse index, kept current by a continual sync from the time-series database.
That gateway, Jacob says, made the migration “transparent.” Every tool and service in the company already routed through it, so when the gateway stopped fanning out to three separate services and started writing SQL to ClickHouse instead, nothing downstream had to change. “Anyone using RRD is already using ClickHouse,” he says.
Underneath, the table is a replicated ReplacingMergeTree, ordered to keep the discovery dimensions efficient, with deduplication keyed on a unique ID. The change-capture stream delivers at-least-once, so duplicates are inevitable; letting ClickHouse drop them during its merges meant the team could tolerate the stream’s semantics without extra plumbing. The pipeline builds a fresh daily table from the offline time-series database, catches it up with change-capture data, then uses an alias to swap the table pointer and cut traffic over before deleting the old table.
Projections handle the heavier aggregations the old systems couldn’t, including service-to-metric counts, service-to-unique-RRD counts, and datacenter-to-host listings. The schema also exposes the individual dimensions directly, so engineers who once ran regex over the full RRD string now filter on a column instead. “This is a lot more efficient,” Jacob says.
The results, and the road ahead
Today, the consolidated index serves more than 150,000 queries per minute across the fleet, with an average latency of 68 milliseconds. As Jacob notes, that average runs across every query type, including the slow, deep analytical queries the old systems couldn’t serve at all. “If you were to distribute this out, you’d see some single-digit-millisecond queries,” he says. It does this over the full 13 billion-plus metrics, with LinkedIn’s 30% daily turnover, on a single shard.
In terms of resources, Jacob estimates that the migration cut memory use to roughly one-fifth of what the previous three-system stack required, and reduced compute to about two-thirds. Because the metadata index is a single shard the team doesn’t have to think about resharding, it also has enough headroom to double the metric volume, a big departure from the old architecture that had reached its scaling limits.
Now that every dimension is queryable, major customers are rewriting their old regex-heavy queries into more efficient native ones. This means the cluster may actually scale down over time, even as metric volume grows. With ClickHouse, the same index is becoming the tool that helps engineers find and reason about their metrics as LinkedIn moves graphs and alerts off RRD semantics onto native ones, enabling the larger migration Jacob, Arun, and the observability team have been working toward for years.
Get started today
You don’t need LinkedIn’s engineering team to get started. Take a shortcut with Managed ClickStack in ClickHouse Cloud, which handles the infrastructure for you.
Sign up