 50.8k
During this past Black Friday and Cyber Monday, a minute of downtime can cost our merchants $5.1 million. That's why observability is critical, we need to detect issues and prevent any downtime. We saw around a 16x improvement out of the box with ClickHouse once we had it deployed, and at peak performance over 30x. And for us, less compute is money.
- ClickHouse Observability
Full-fidelity observability for AI agents and SREs
No sampling. No roll-ups. No infra.
Keep every log, metric, and trace. Query high-cardinality data fast, with low-cost, long-term retention. Send your OpenTelemetry data to one managed endpoint, and we’ll handle ingestion, storage, and scaling.
- Full-fidelity telemetry and long-term retention
- ClickHouse performance with simple volume-based pricing
- Ingestion, schemas, storage, and scaling managed for you
- Your agents, models, and investigation workflows
Trusted for observability by





ClickHouse played an instrumental role in helping us develop and ship Claude models. With ClickHouse, our database is green, queries are lightning-fast, and money is no longer on fire. It’s already delivered tremendous value in helping us build state-of-the-art language models.
Built for SREs and their agents
Give engineers and agents the data and query performance to test hypotheses, follow the evidence, and reach root cause even as systems grow in size and complexity.
Fast, concurrent queries
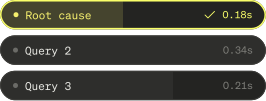
Test more hypotheses in parallel and uncover root causes sooner with fast queries across high-cardinality telemetry, without API limits slowing engineers or agents down.
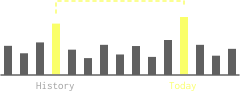
Full telemetry and history
Correlate unsampled, high-cardinality telemetry with historical patterns, giving engineers and agents the evidence to reach root cause.
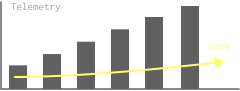
Lower costs at scale
Keep ingestion, retention, and queries affordable so agents can follow the evidence without rationing queries or discarding context.
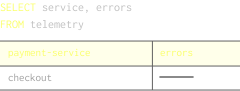
SQL agents already know
Let agents test complex hypotheses with familiar, expressive SQL, exploring beyond predefined queries and fixed API operations.

Keep the detail. Keep the history. Lower the cost.
Keep the detail your investigations need with ClickHouse cost efficiency and straightforward volume-based pricing. Pay by the GB for logs, traces, and session replays, and by the million data points for metrics. No monthly minimum.
Logs, traces, and session replays
$0.10GA rate $0.20per uncompressed GB50% off during beta
Metrics
$0.05GA rate $0.10per million data points50% off during beta
30 days of retention included. No monthly minimum. No separate metrics cardinality charge.
More telemetry for the same budget.
What $1,000 a month buys for logs.
GA rates shown 50% off during beta
- ClickHouse5 TB
- New Relic12.5 TB2x less
- Grafana Cloud1.82 TB2.8x less
- Splunk Cloud20.46 TB11x less
- Datadog30.39 TB13x less
Monthly budget
Log ingestion only; metrics, traces, and session replays are not included. Competitor figures use indicative list pricing sourced from public pricing pages. ClickHouse Observability at the GA rate of $0.20 per GB uncompressed, ingested. 1 New Relic: excludes user seat costs. 2 Splunk Cloud: assumes a 100 GB/day license. 3 Datadog: assumes an average log line of 1 KB.
Get started with ClickHouse Observability for free
We'll get you started on a 30 day trial and $300 credits to spend at your own pace.
Send your data. We run the platform.
Send your OpenTelemetry data to one managed endpoint and start investigating. Ingestion, storage, optimization, and scaling are handled for you.

ClickHouse Observability
Fully managedIngestion
OpenTelemetry endpoint
Investigation tools
Human interface
AI NotebooksDashboardsAlertsSearch
Agent interface
MCPCLIAPISemantic toolsSkills
Handled automatically
Schema optimization
Workload isolation
Auto-scaled compute
AI agent
Engineer
AI agent
SRE
1. Connect your telemetry
Send data from your existing OpenTelemetry SDKs and collectors.
2. We manage the platform
Ingestion, storage, optimization, and scaling are handled for you.
3. Start investigating
Explore data with search, dashboards, AI notebooks, or your agents.
ClickHouse Observability is powered by ClickStack, the open source observability stack for ClickHouse.
Investigate together. Keep engineers in control.
Explore an incident in a shared AI notebook that keeps evidence, queries, and reasoning together. Follow different hypotheses and guide the investigation as new information emerges.
Branch your investigation
Explore multiple hypotheses without losing the evidence or context from each path.
Inspect each step
Review the queries, reasoning, and visualizations, and use ClickHouse SQL to explore further.
Continue together
Share the investigation so another engineer can pick it up without rebuilding the context.
Loading video...
Bring your own observability agents
Connect Claude Code, Codex, Cursor, or your own agents to ClickHouse Observability through MCP, combining your telemetry with your code, runbooks, and operational context.
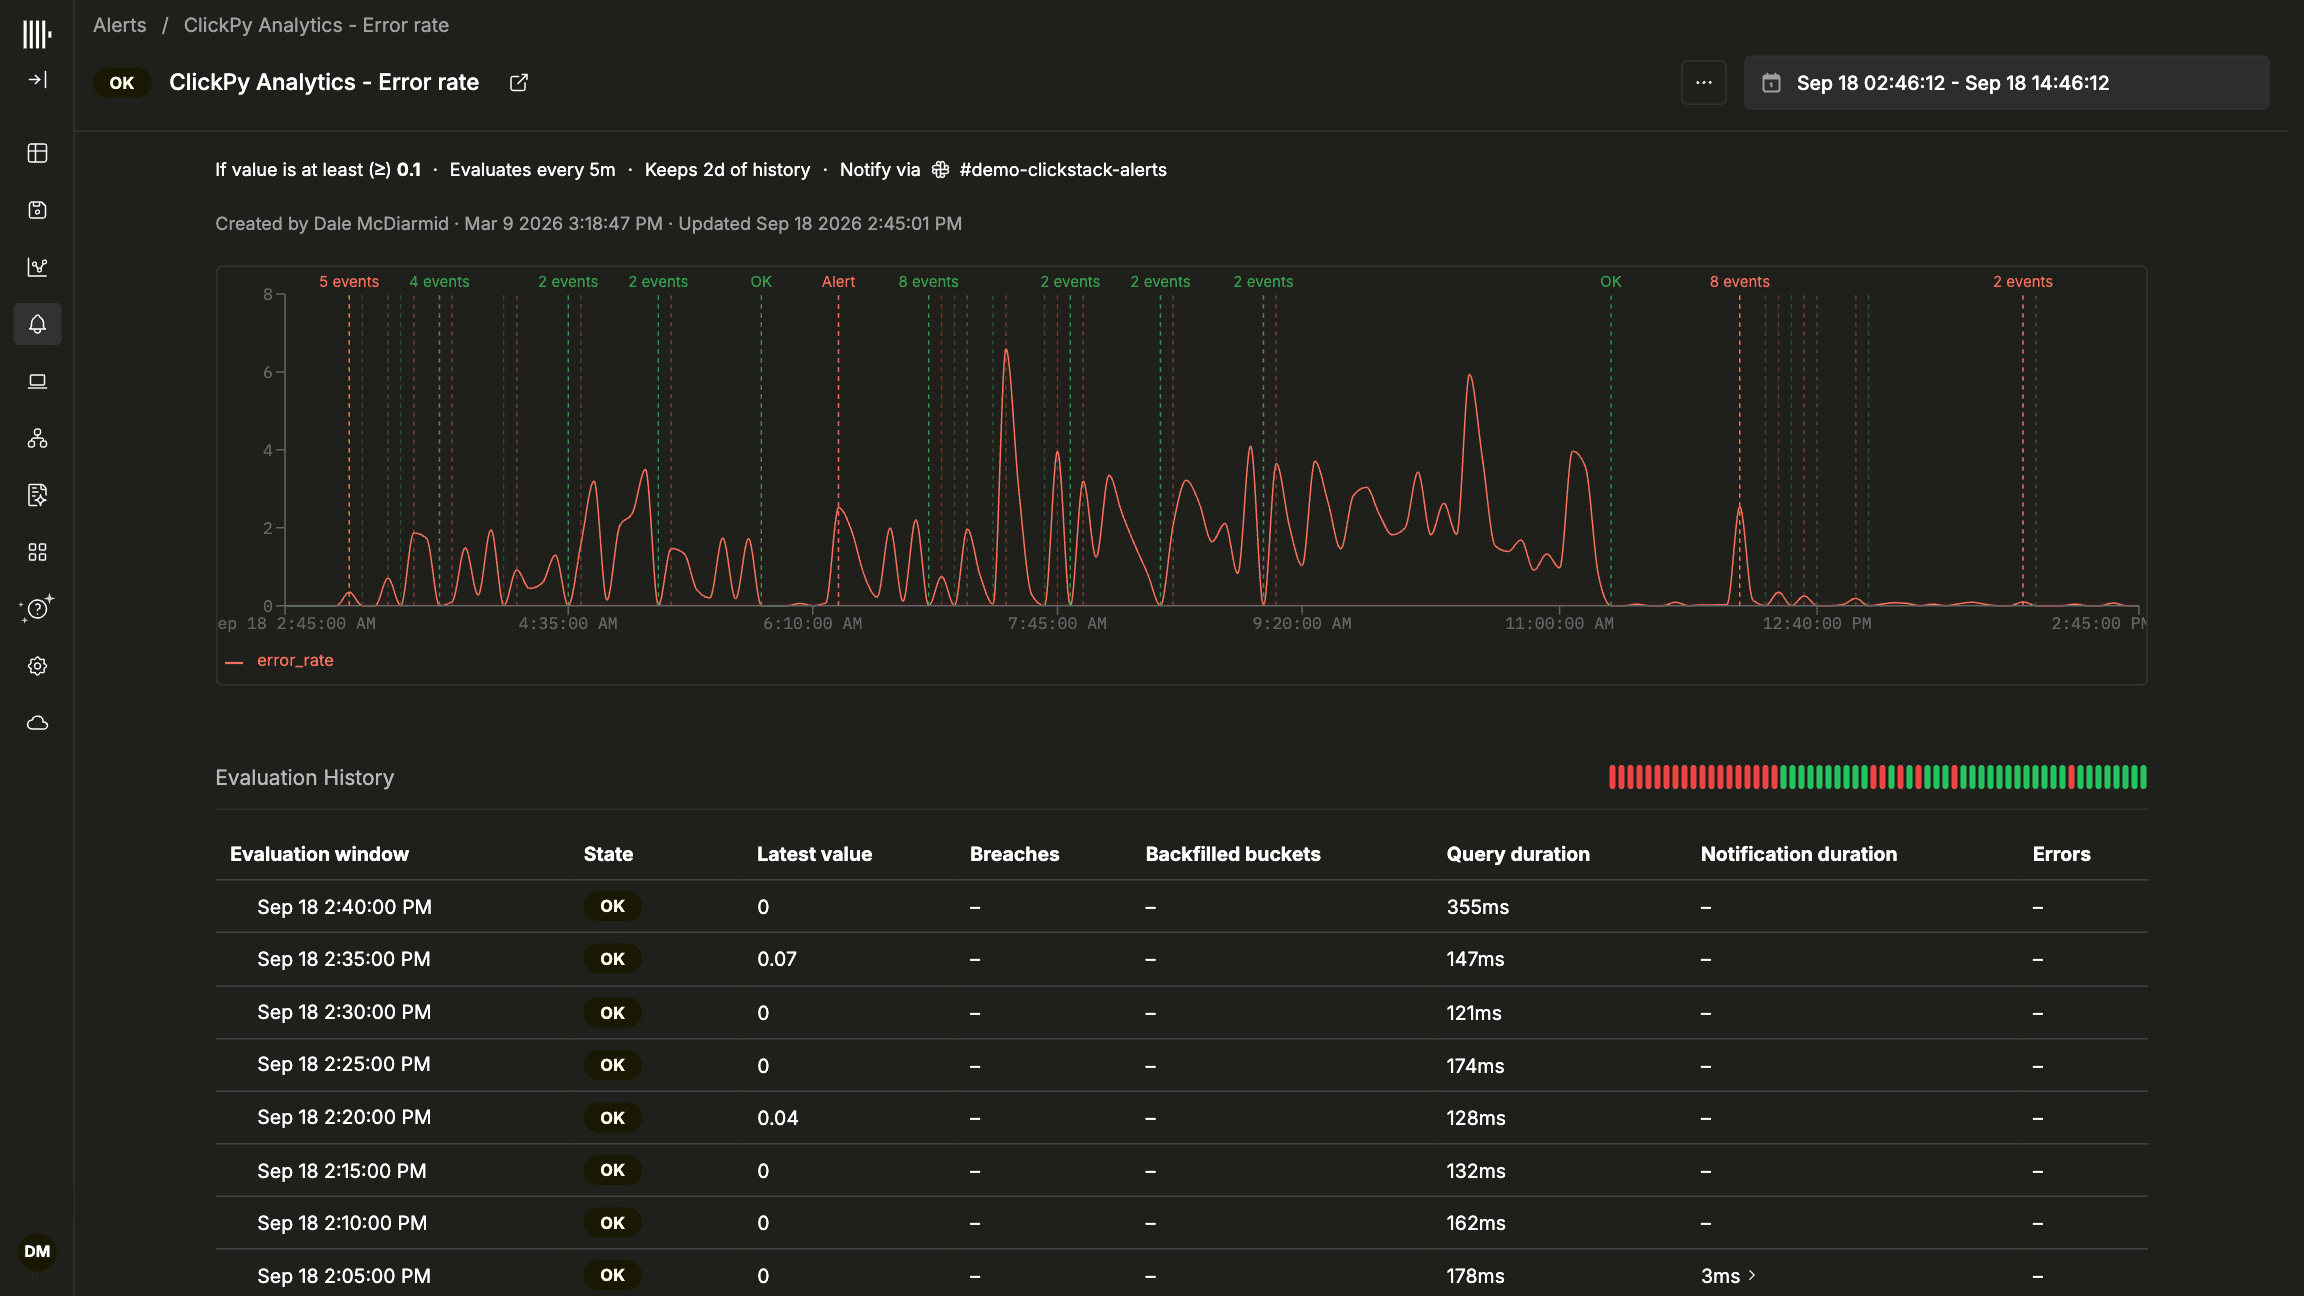
Turn findings into saved searches, dashboards, and alerts so your team can review the evidence and build on each investigation.
Your agent in
Claude Code
Your agent in
Cursor
Your agent in
AI Notebooks
ClickHouse Observability
Semantic tools
Search logsFollow tracesCompare eventsQuery metrics
Your agent in
Codex
Your agent on
Your framework
Your agent in
OpenCode
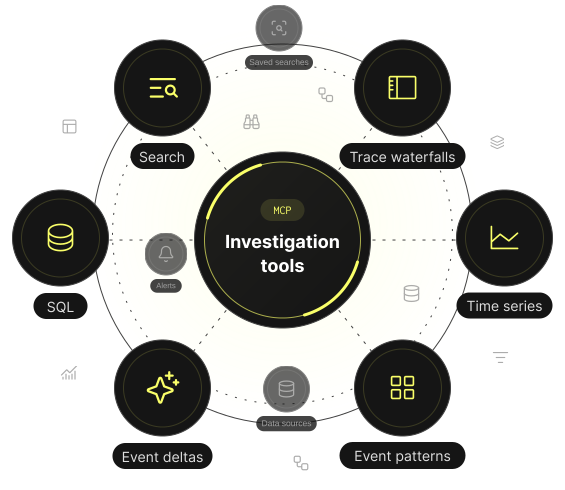
Give your agents tools built for investigation
The ClickHouse Observability MCP server provides purpose-built tools for common investigation steps, with access to ClickHouse SQL when a question needs deeper analysis.
Each tool encodes a common investigation workflow and an optimized query, so agents spend fewer steps reconstructing how to ask and more on the evidence.
In our evaluations against a generic ClickHouse MCP server, agents using these tools were:
17% more accurate
25% fewer tool calls
2.7× more consistent

Enterprise observability, fully managed
Focus on your systems and investigations. We handle the infrastructure, backups, upgrades, and maintenance.
Built for reliability
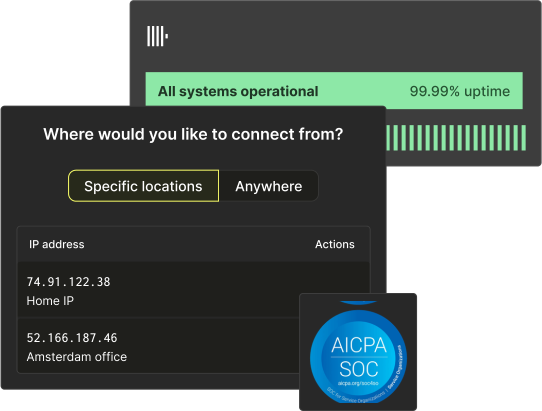
Replication across multiple availability zones provides high availability, with automated backups and built-in disaster recovery protecting your telemetry.
Control access
Manage who can access your telemetry and how they connect, with user and network access controls backed by comprehensive activity logging.
Enterprise-grade security
Built on ClickHouse Cloud, with encryption in transit and at rest and SOC 2 Type II compliance.
 ClickHouse Observability
Want more control? Choose self-managed.
For engineering teams with database expertise seeking the lowest possible unit costs, ClickHouse Observability offers a self-managed experience.
You control the configuration. ClickHouse Cloud manages the underlying infrastructure.
- Tune your telemetry. Optimize schemas, compression, and indexes for your data.
- Right-size compute. Match resources to your workload and budget.
- Scale workloads independently. Configure separate resources for ingestion, queries, and alerting.
From the first signal to the root cause
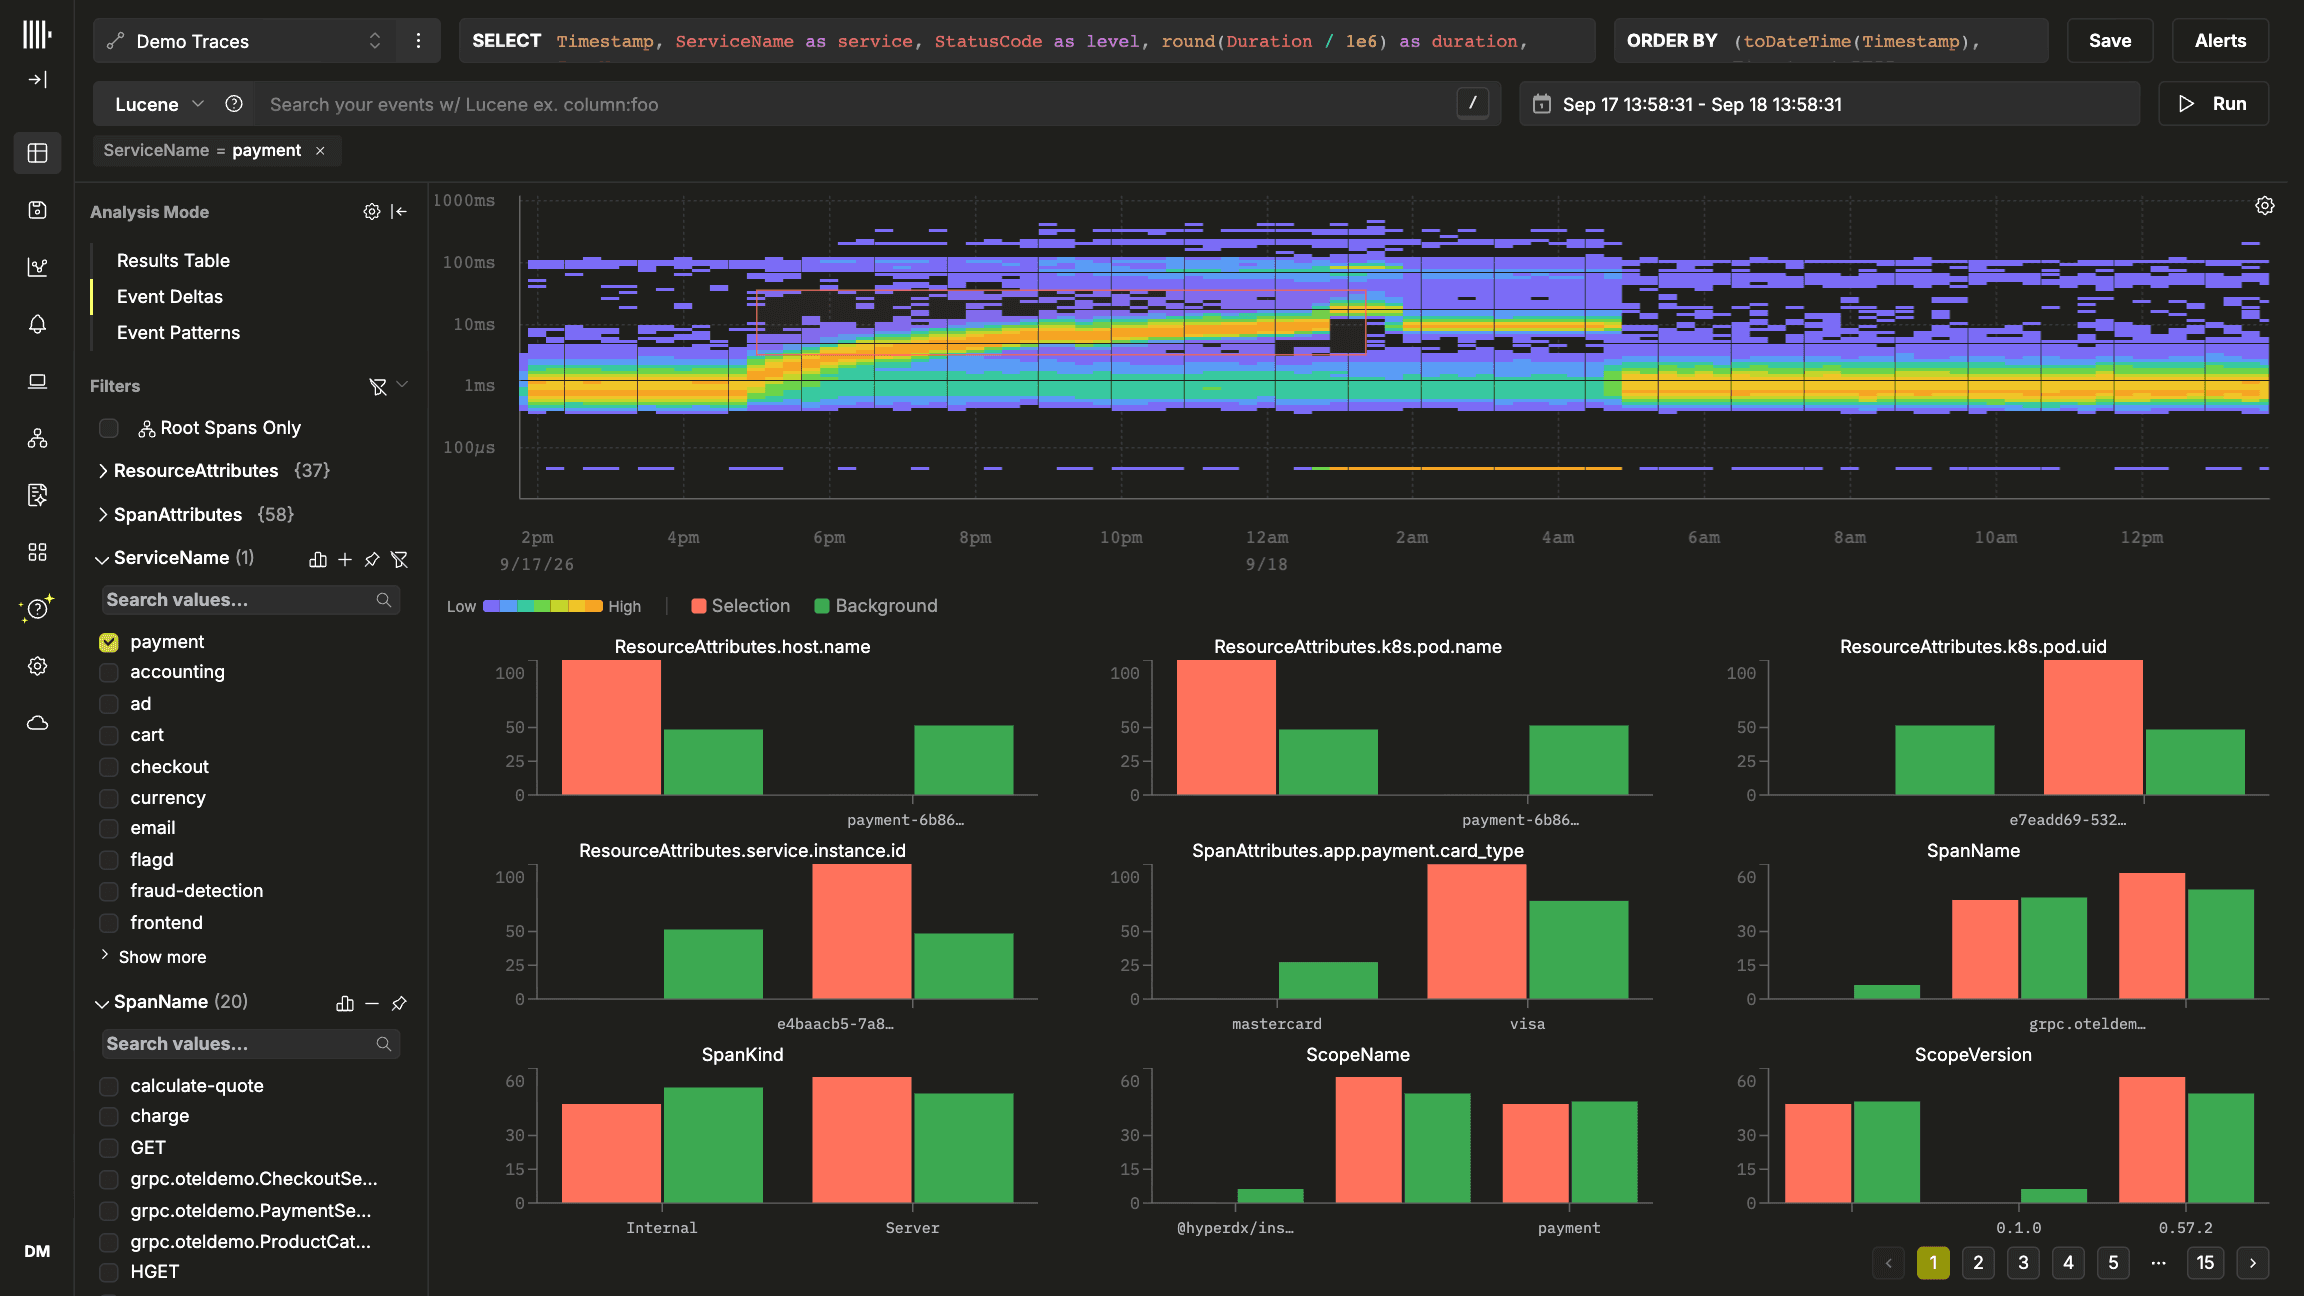
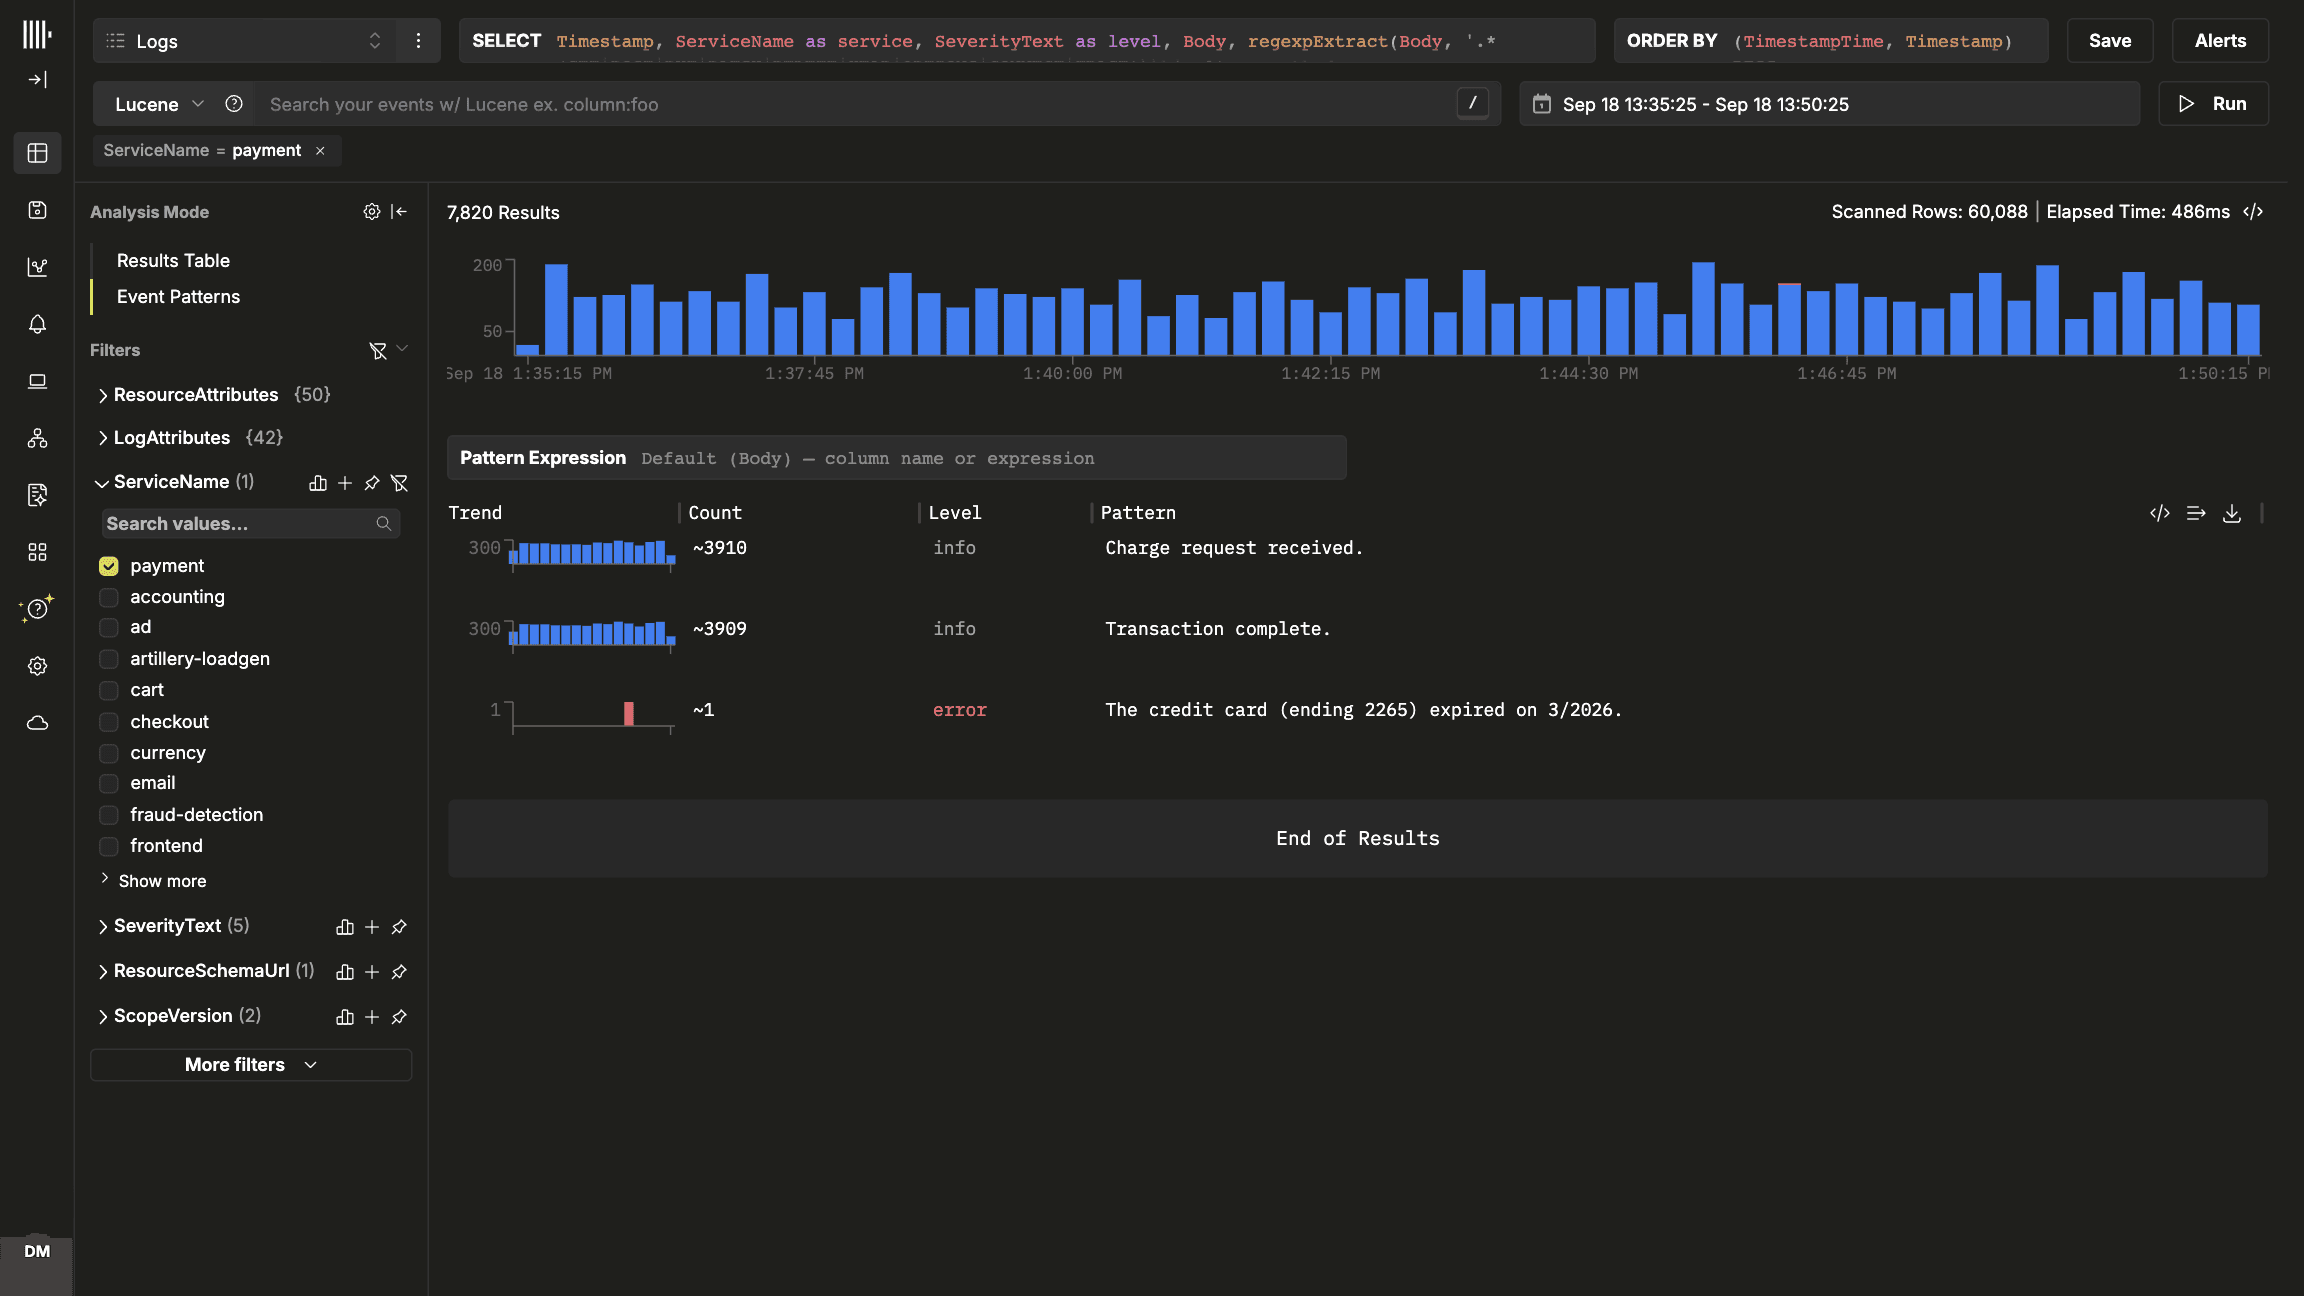
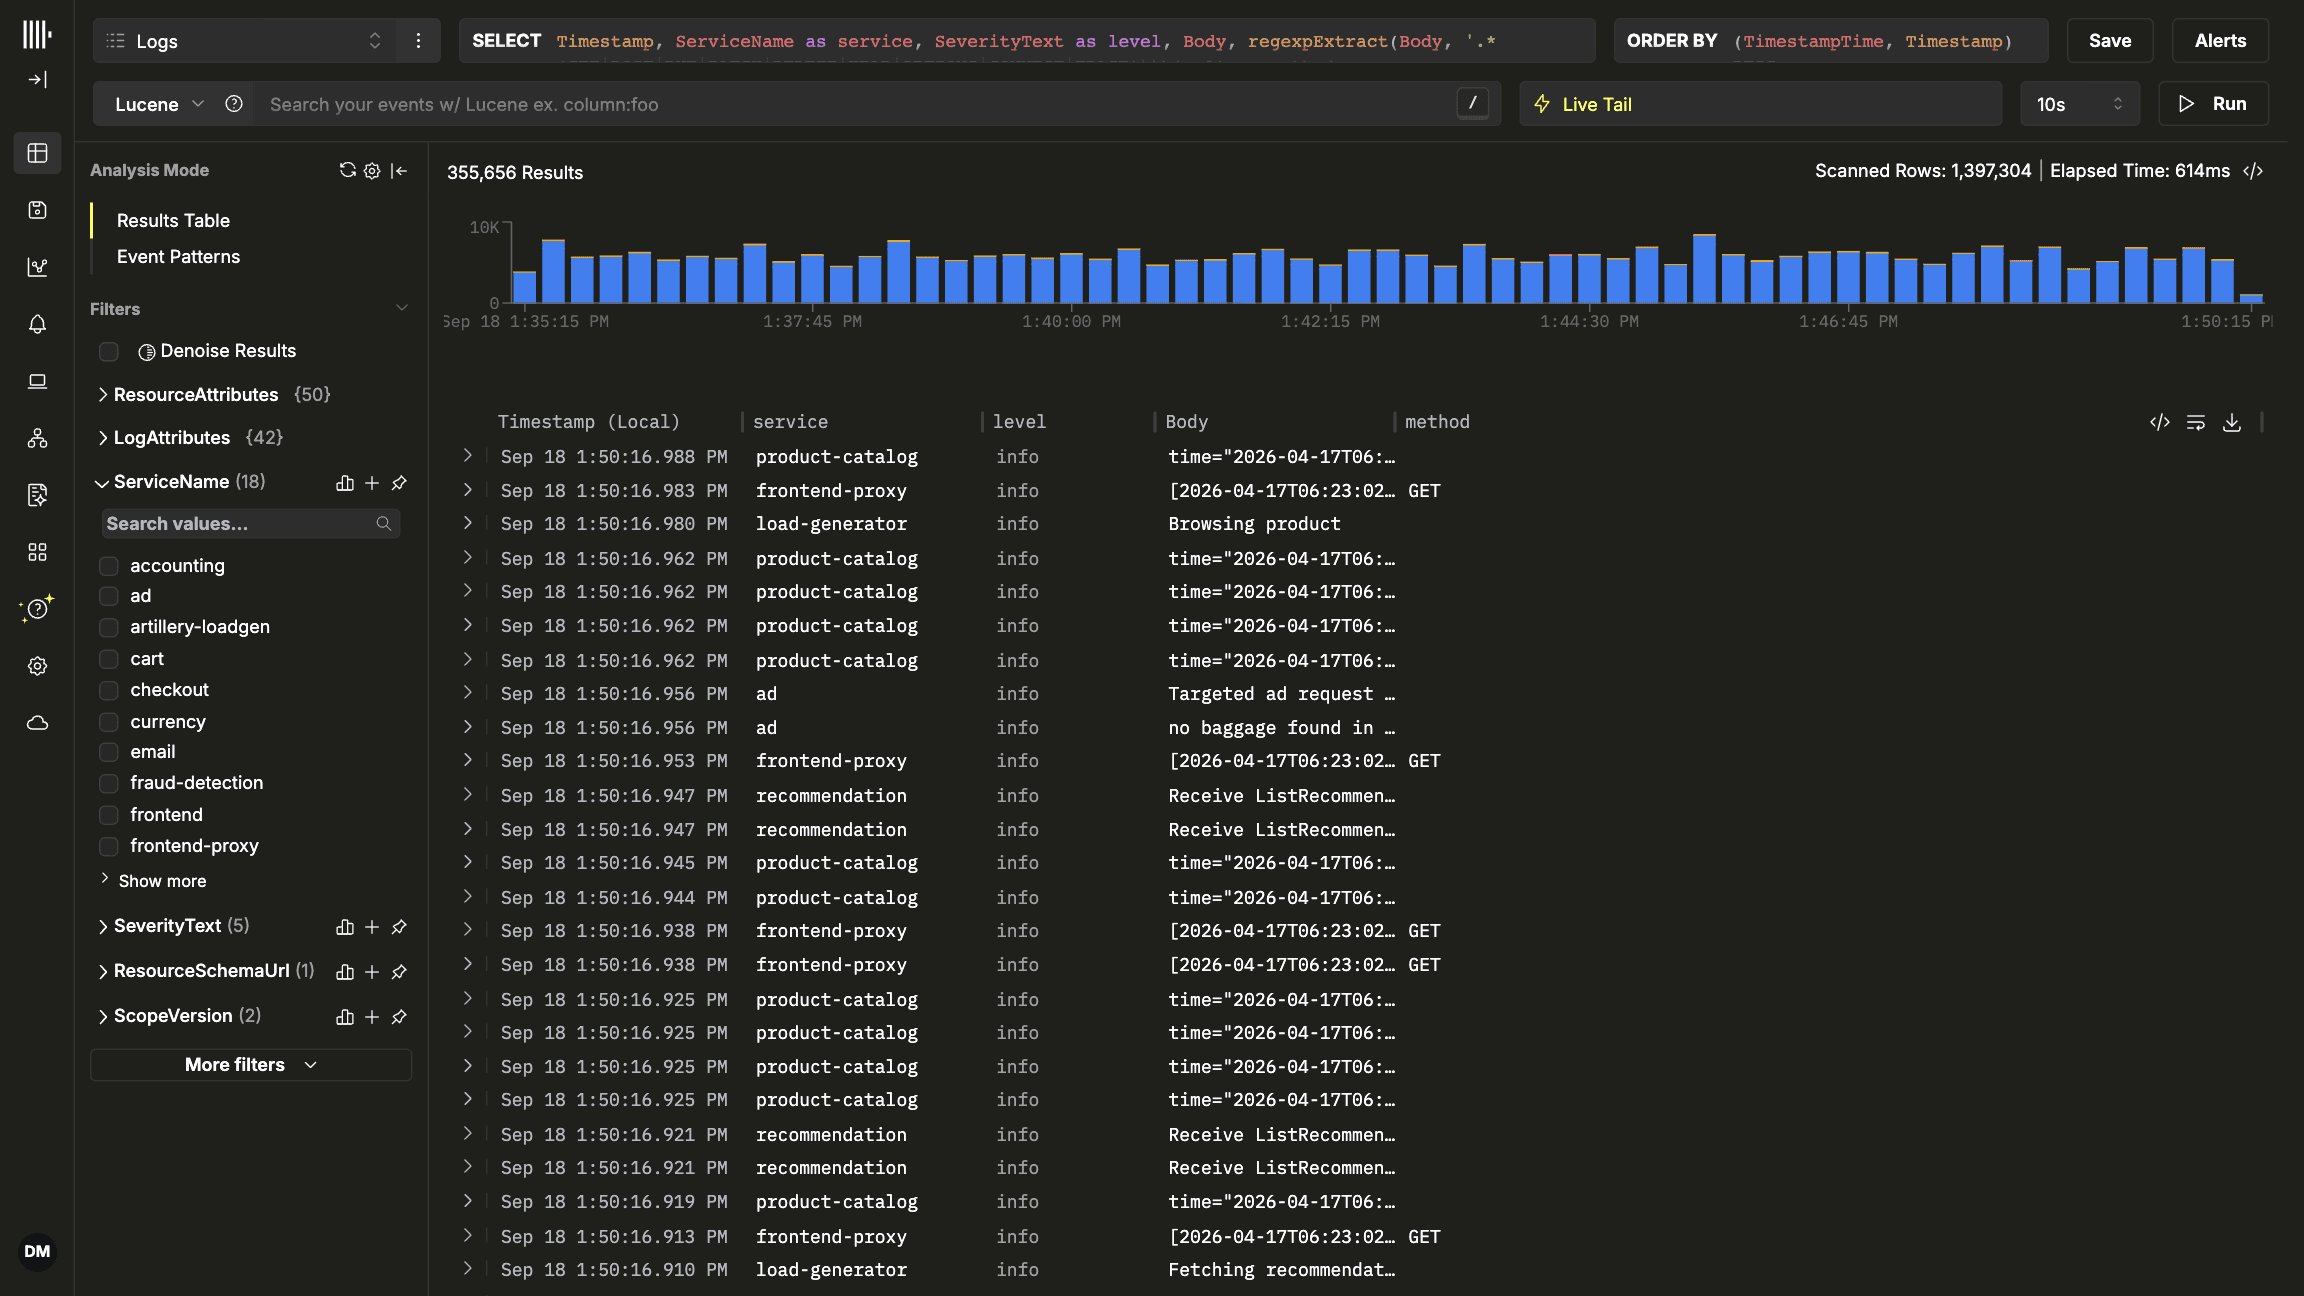
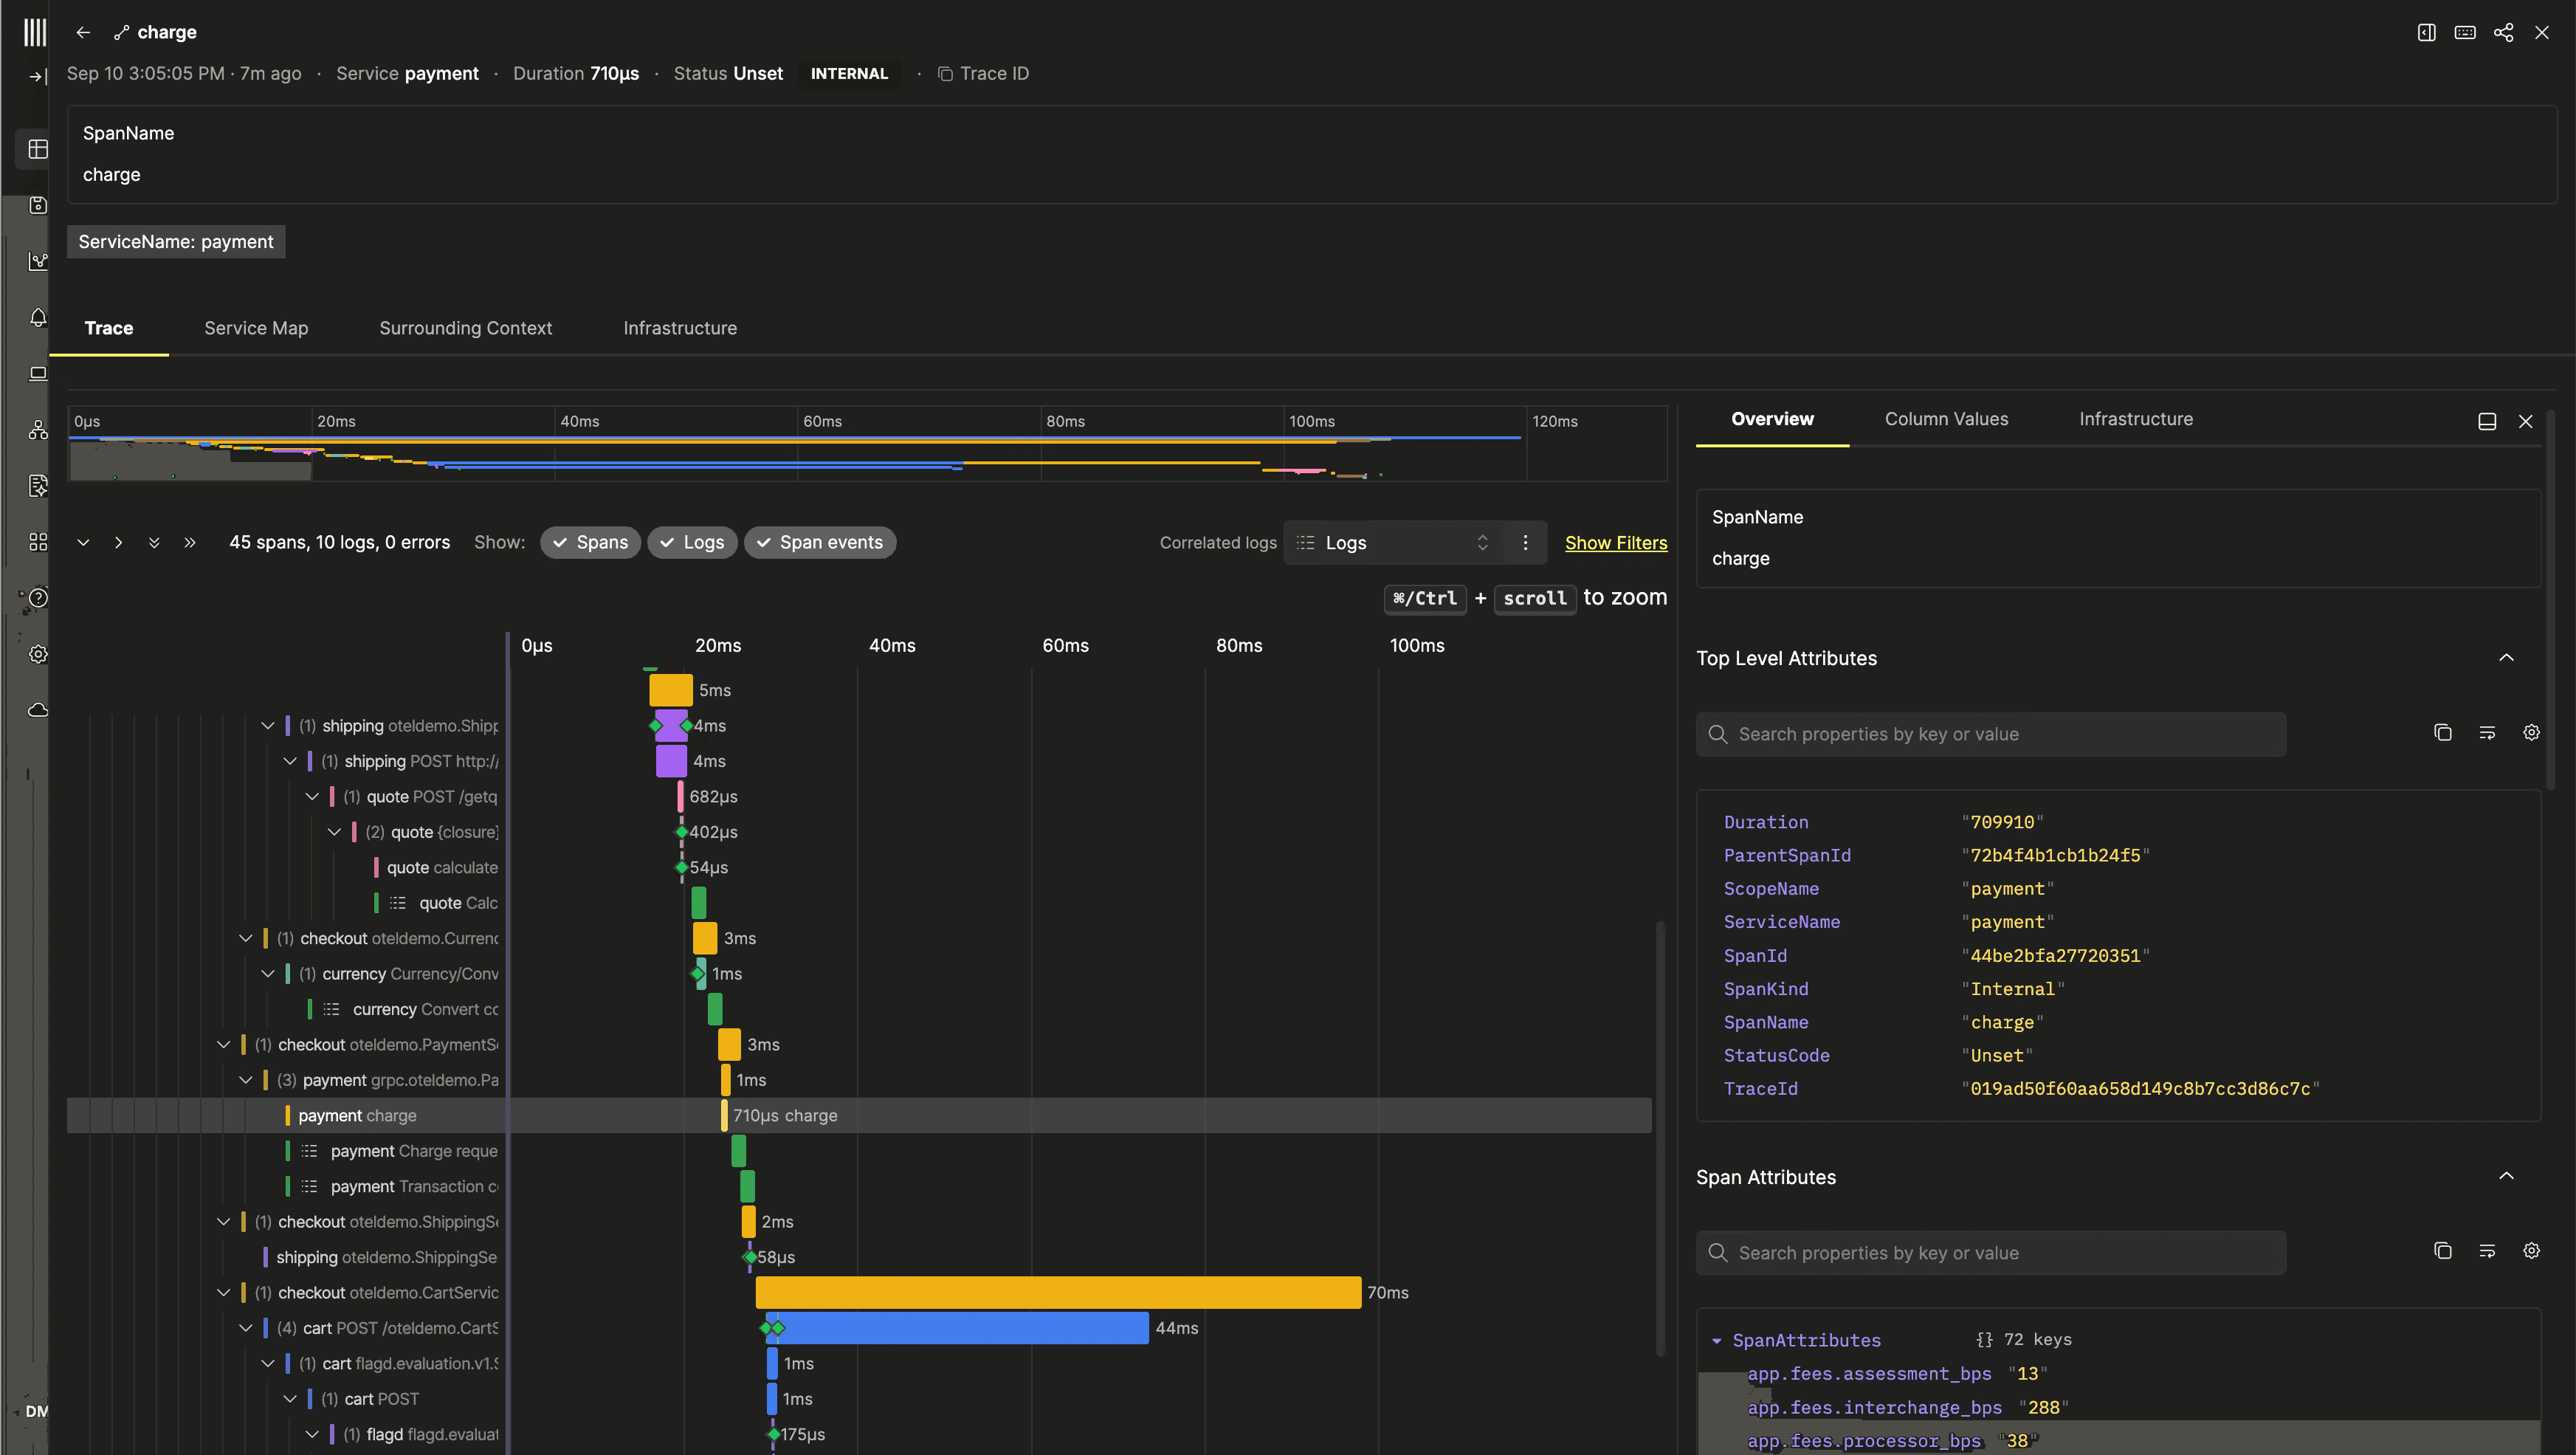
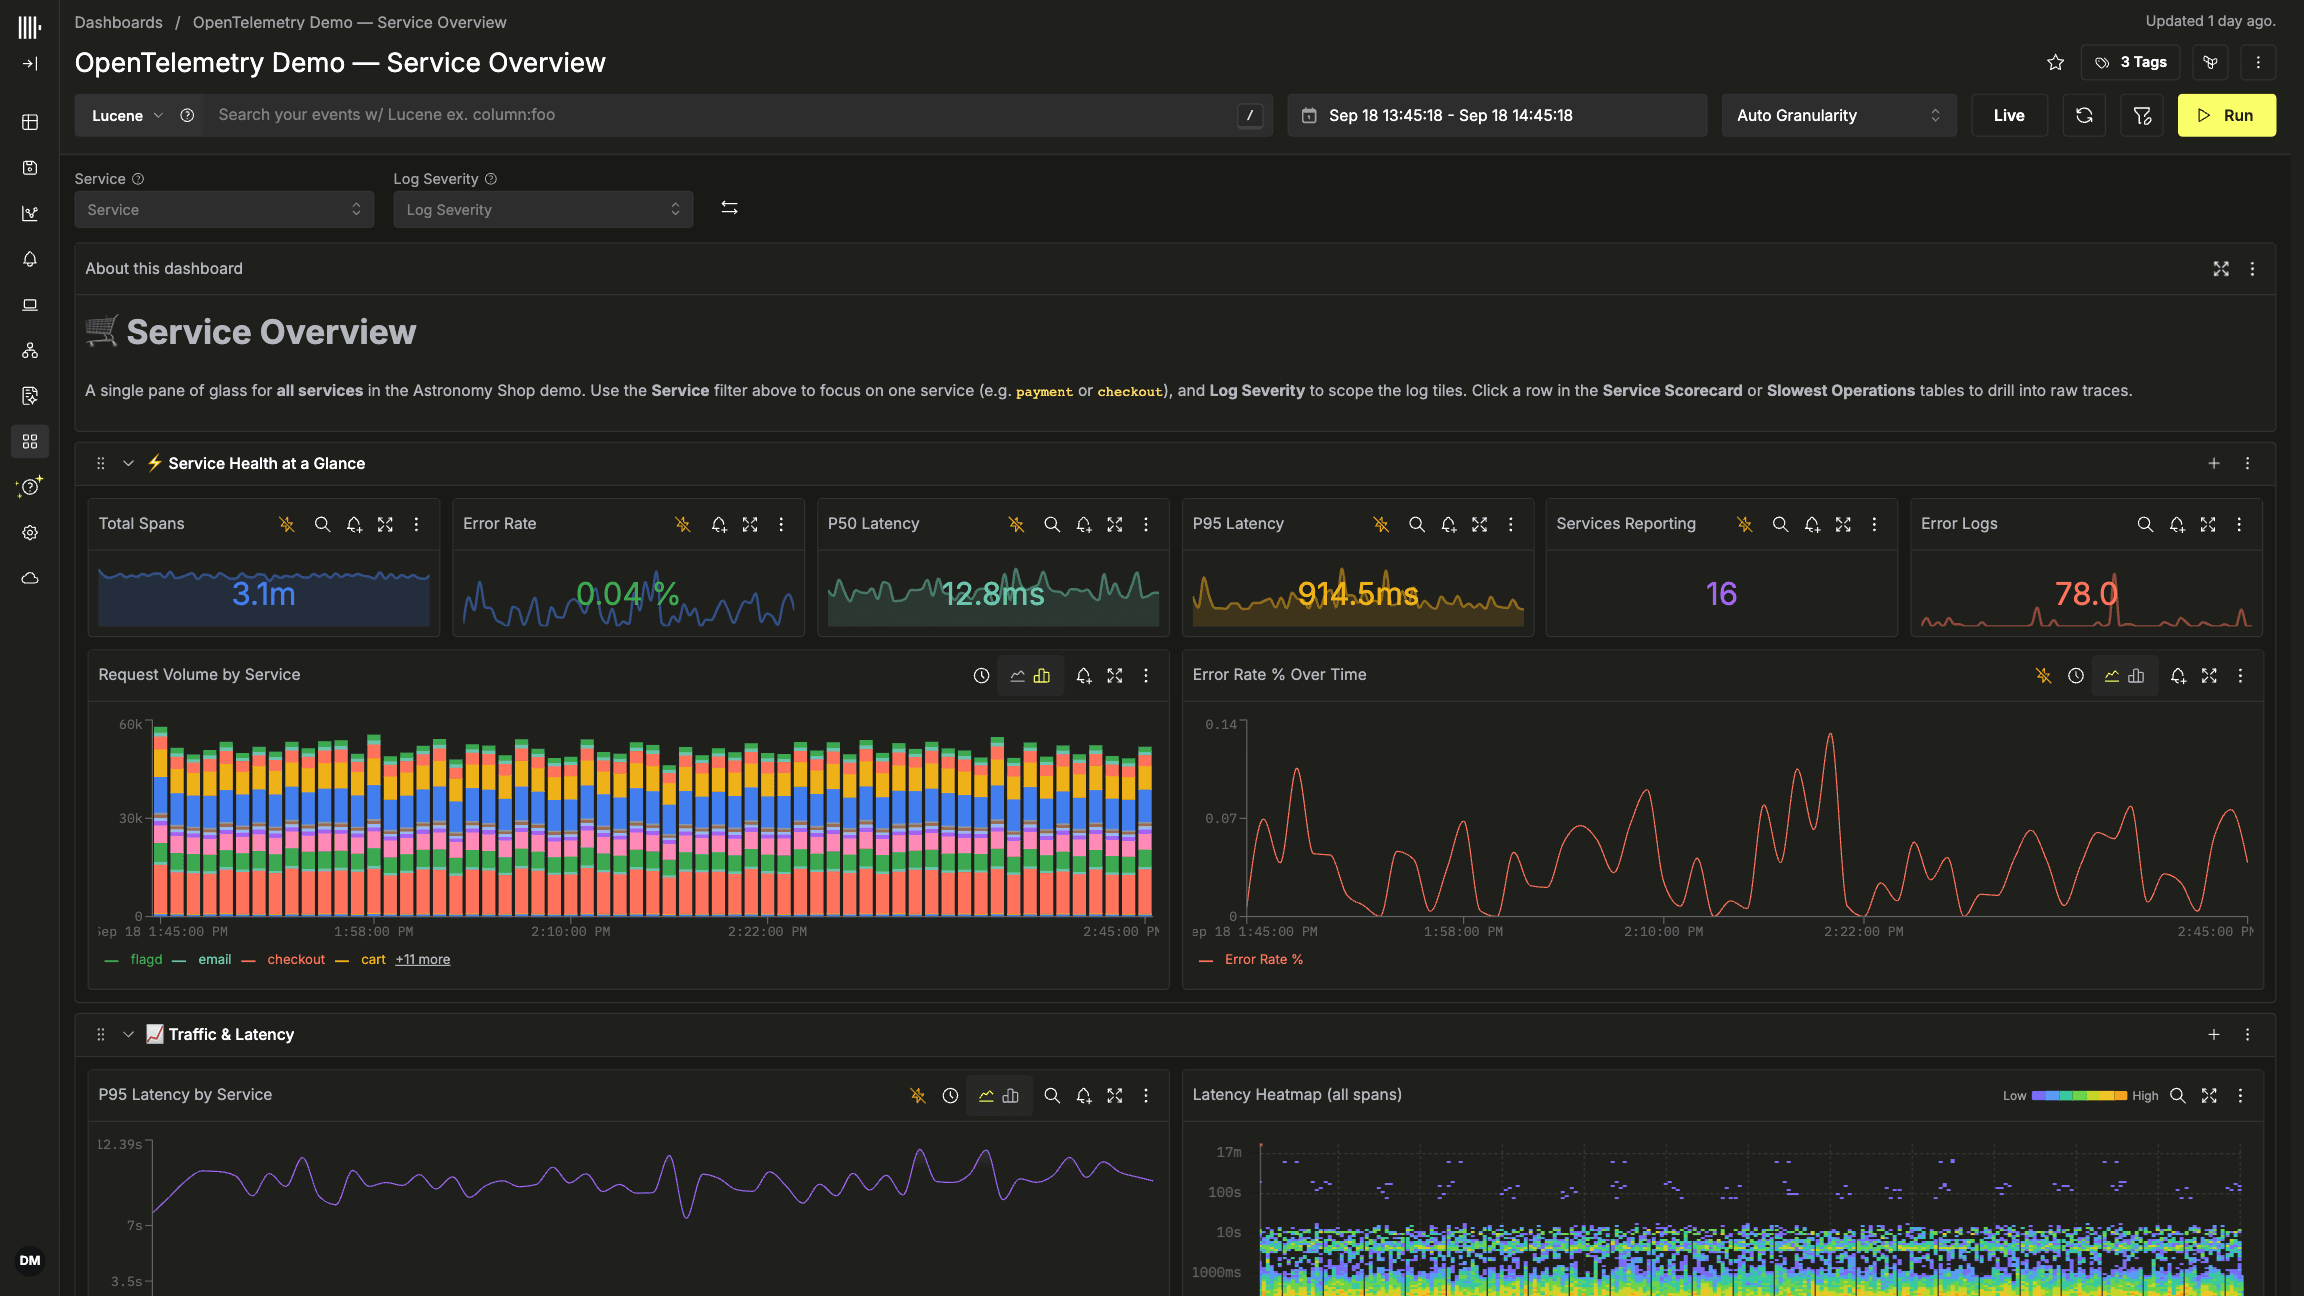
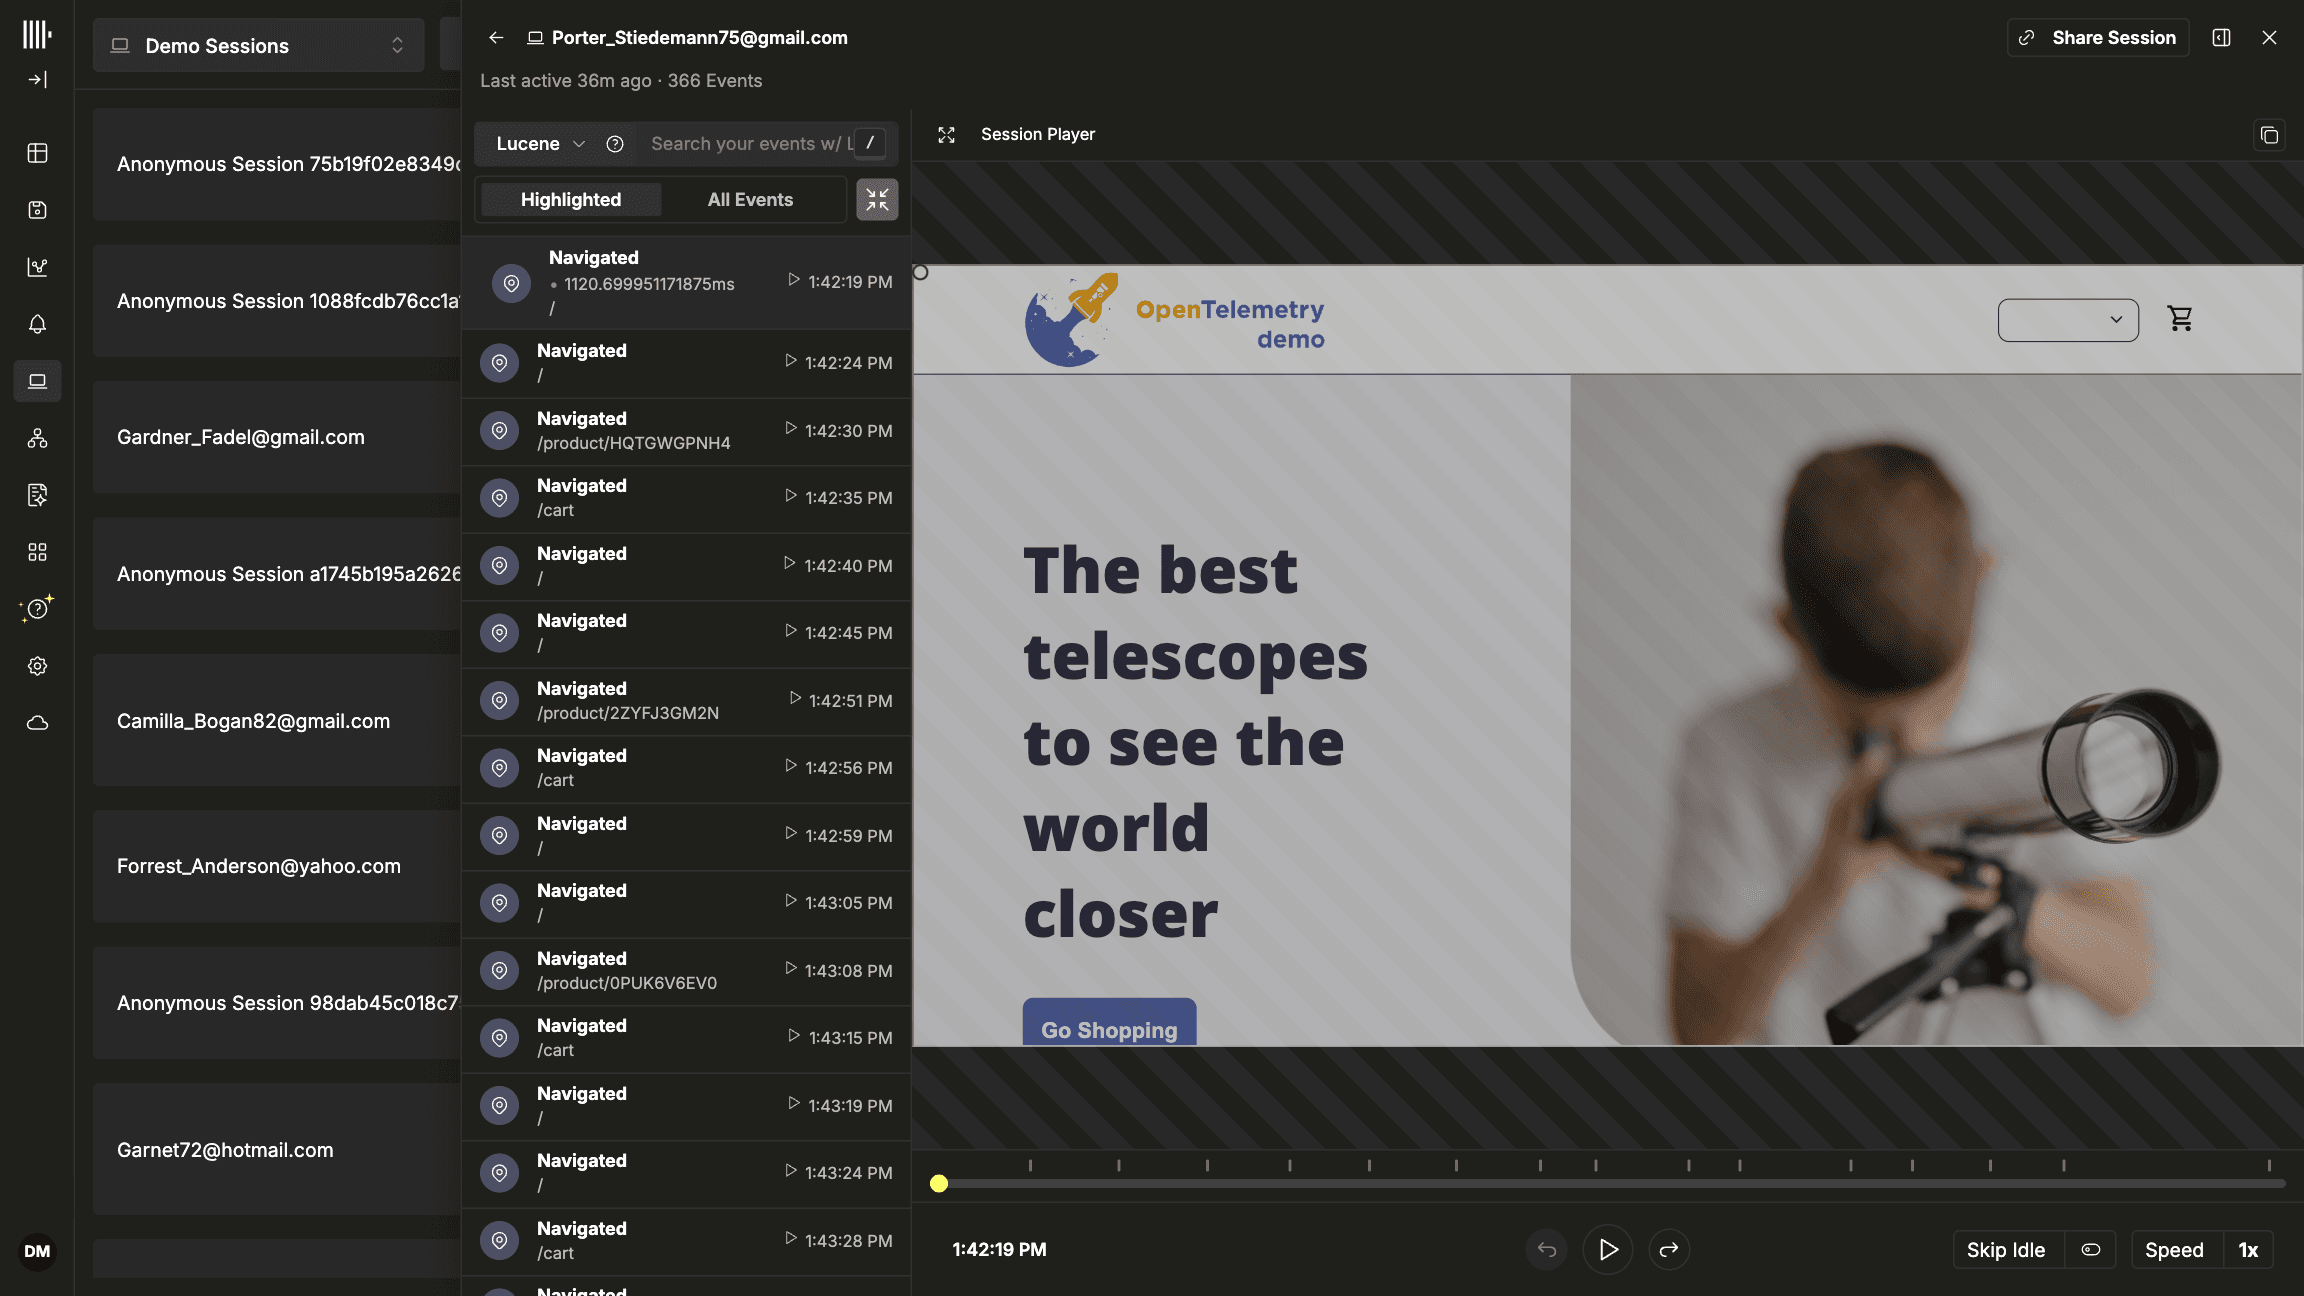
Find the error, follow the request, and understand what changed. Explore connected telemetry with the tools your team needs throughout an investigation.
Watch how engineers and agents move from an initial signal to the evidence behind it.
Instrument your applications
Already using OpenTelemetry? Keep your compatible SDKs and collectors and send telemetry to your managed endpoint. Starting fresh? Instrument your applications with OpenTelemetry to bring logs, metrics, and traces together.


Try ClickHouse Observability
Give your SREs and agents full-fidelity telemetry, long-term context, and fast queries at ClickHouse economics, with the platform fully managed.

FAQs
Explore our FAQs to learn more about ClickHouse Observability, and if you don't see what you need, we're always happy to chat.
01
ClickHouse Observability is a fully managed observability service for engineers and their agents. Investigate logs, metrics, and traces through search, dashboards, alerts, AI notebooks, and open agent interfaces.
02
We handle ingestion, storage, optimization, scaling, backups, and upgrades. You instrument your applications, send telemetry to your managed endpoint, and focus on investigating your systems.
03
No. Engineers can investigate directly through search, trace waterfalls, event patterns, event deltas, dashboards, and session replays. Agents and AI notebooks provide additional ways to explore the same telemetry.
04
Yes. Connect your preferred agents and frameworks through MCP and SQL. Combine telemetry with the code, runbooks, and internal tools your agents already use.
05
ClickStack is the open source observability stack behind ClickHouse Observability. ClickStack remains available as an open source product, while ClickHouse Observability provides the managed service.
06
Most teams should choose the fully managed experience, where ClickHouse handles database administration and optimization for you.
The self-managed experience suits mature engineering teams with the database expertise and dedicated resources to own configuration, performance tuning, and workload management. It gives you the control to pursue the lowest possible unit costs, while ClickHouse Cloud manages the underlying infrastructure.
07
ClickHouse Cloud provides replication across multiple availability zones, automated backups, and disaster recovery. Security capabilities include user and network access controls, activity logging, encryption in transit and at rest, and SOC 2 Type II compliance.
08
Logs, traces, and session replays are billed by uncompressed GB ingested. Metrics are billed per million data points, with no separate charge for cardinality. Both include 30 days of retention, with no monthly minimum. Visit the pricing page for plan rates and search allowances.
09
There is no separate charge for the number of unique metric series. Your metrics bill depends on the number of data points you send. At the same data-point volume, the price stays the same regardless of cardinality. Creating additional series can increase costs if it produces more data points.
10
Start a free trial and connect your OpenTelemetry SDKs or collectors to your managed endpoint. Then explore your telemetry through the interface or connect your agents.