Welcome to the January edition of What’s New in ClickStack, the open source observability stack built for ClickHouse. Each month, we highlight the latest ClickStack improvements that help teams explore their observability data with more speed, clarity, and confidence. January was a busy month for ClickStack. We shipped a mix of high-impact improvements that unlock entirely new workloads, alongside smaller changes that are just plain fun to use. As always, we aim to cover the full spectrum. A big thank you to our users for the constant feedback that helps shape these features and make ClickStack better for everyone.
New contributors
Building ClickStack in the open means it is shaped by the people who use it every day. We are thankful for the continued momentum from the community, and especially for the new contributors who jumped in this month. Your ideas, code, and feedback directly influence where ClickStack goes next and help make it stronger for everyone.
motsc, yeldiRium, gyancr7, gingerwizard, adri, akalitenya
Managed ClickStack
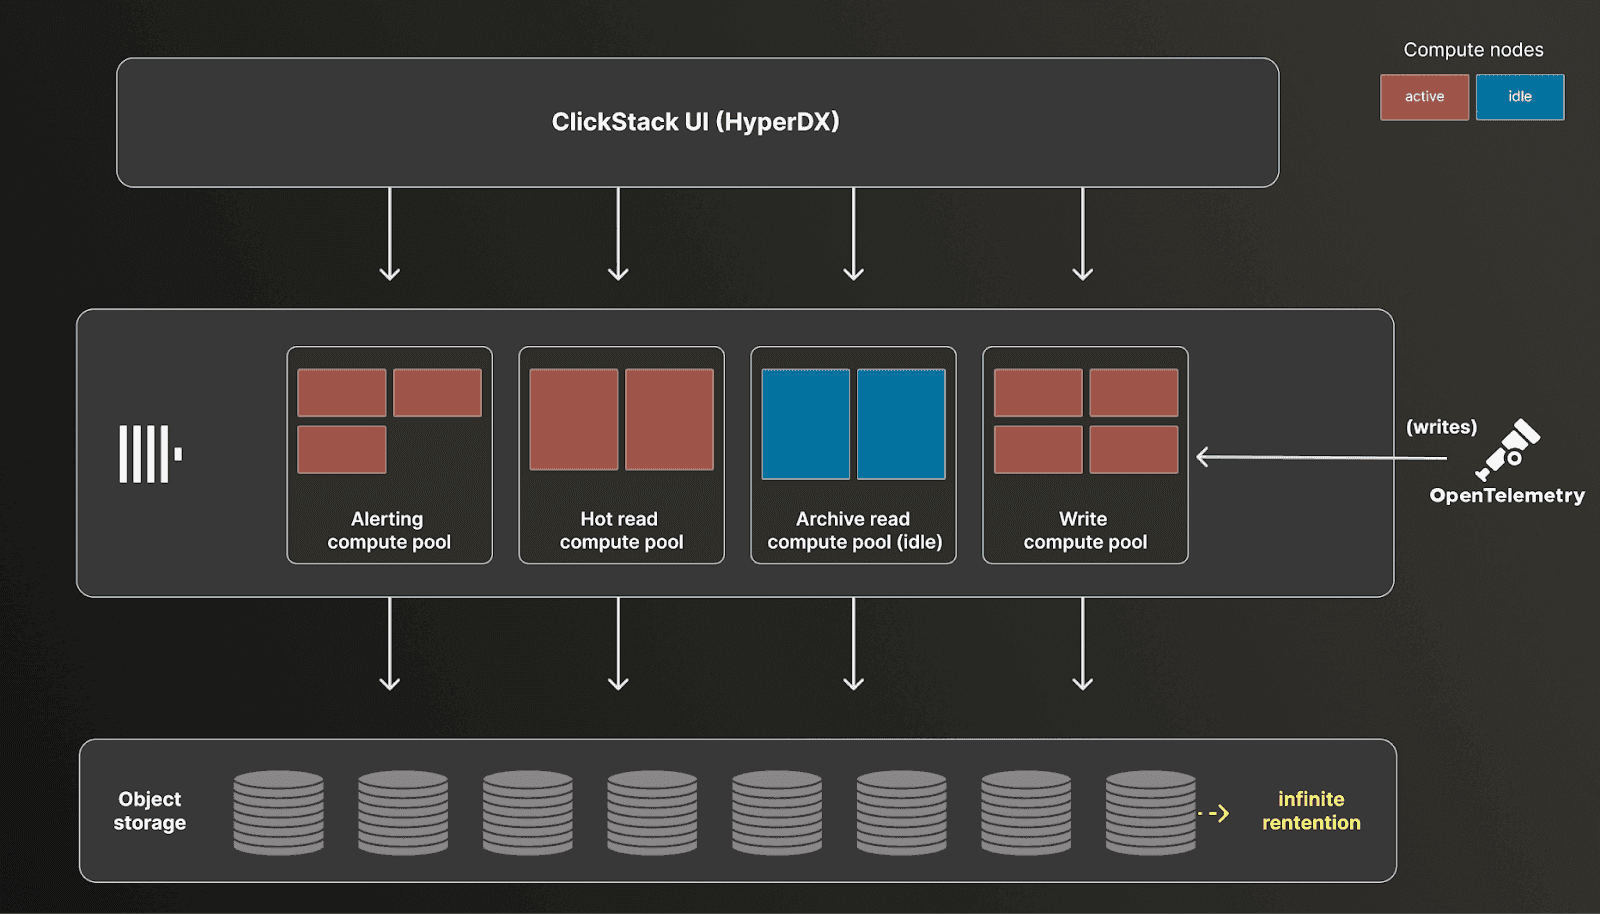
Early this month we announced Managed ClickStack. Managed ClickStack is our fully managed observability offering built on ClickHouse Cloud, designed for teams that want ClickStack’s performance and scale without operating the underlying infrastructure. This delivers the same fast queries across logs, metrics, traces, and session data that our open source users enjoy, while fundamentally changing the cost model for observability.
By pricing on just compute and storage, rather than events, hosts, or users, Managed ClickStack lets teams ingest and retain full-fidelity, high-cardinality data at massive scale, with total costs measured in cents per gigabyte per month. Separation of storage and compute means ingest and query workloads scale independently, so you only pay for the resources you actually use.
More importantly, Managed ClickStack reflects where we believe observability is headed. By running ClickStack on ClickHouse Cloud, we can unlock long-term retention on low-cost object storage, elastic compute for investigations and alerts, and a foundation for consolidating observability with analytics and other workloads.
This aligns with our broader view that observability is ultimately a data problem, and one best solved on a platform built for large-scale analytical workloads. If you want to go deeper on the vision and economics behind Managed ClickStack, check out our launch post introducing the beta.
Get started today
Interested in seeing how Managed ClickStack works for your observability data? Get started in minutes and receive $300 in free credits.
Start free trialBetter index support
In ClickStack, we are constantly looking for ways to better leverage ClickHouse features, whether they are newly introduced or long-standing capabilities that can be used more effectively. This month is a great example of that approach, with focused investments in improving index support to significantly accelerate query performance on large datasets.
Improving bloom filter support
Users running ClickStack for logs and traces are already familiar with how heavily we use Bloom filters to accelerate text search. Bloom filters provide a lightweight skipping index for keyword queries, allowing ClickHouse to avoid scanning large portions of data.
In ClickHouse, Bloom filters are used as skip indices to quickly rule out data blocks that cannot possibly match a query. When data is written, values or derived tokens are hashed and stored in a compact probabilistic structure at the granule level. At query time, ClickHouse checks the Bloom filter before reading a granule. If the filter indicates a value is not present, that granule is skipped entirely. Bloom filters guarantee no false negatives, meaning matching data is never missed, but they may produce false positives, which results in additional granules being scanned. This tradeoff allows ClickHouse to significantly reduce IO and CPU for text and high cardinality searches while keeping index size relatively small.
Until now, ClickStack used the tokenbf_v1 index for log body searches. This index pre-tokenizes text by splitting on non-alphanumeric characters and stores the resulting tokens in a Bloom filter. While convenient, it exposed several tuning parameters that were difficult to reason about in practice. Users had to choose the filter size, number of hash functions, random seed, and granularity. Although a granularity of 8 generally worked well, the other parameters often required trial-and-error or direct assistance from ClickHouse experts.
In this release, we have now also support the simpler bloom_filter index combined with explicit tokenization using the tokens function. This index takes a single optional parameter: the acceptable false positive rate between 0 and 1, with a default of 0.01. Tokenization is handled separately, using the same non alphanumeric splitting behavior by default, but now with the flexibility to adjust tokenization explicitly if needed (this opens some interesting opportunities we plan to explore!).
This change dramatically reduces the tuning surface area. Instead of juggling multiple low level parameters, users now only need to think about granularity and false positive rate. We still recommend a granularity of 8 for log body searches, and for most workloads the default false positive rate is sufficient. When tuning is needed, it becomes much simpler to evaluate values slightly above or below the default and observe the impact on query performance.
Note that lowering the false positive rate too aggressively, with the aim of skipping more granules, is not always beneficial. Doing so increases the filter size, which can slow evaluation and increase load times - although this is mitigated somewhat with [recent changes to stream skip indices](https://clickhouse.com/blog/streaming-secondary-indices). Allowing slightly higher false positives can actually improve performance by reducing index overhead. The easiest approach is to experiment with values near the default, sticking with the default if no clear improvement emerges.
The new approach delivers other meaningful gains. At a granularity of 8, index sizes are typically around 15% smaller. Index analysis can be up to 50% faster, and in some datasets pruning selectivity improves by as much as 7x, although this varies significantly with data characteristics. The net result is searches up to 5x faster with far simpler tuning.
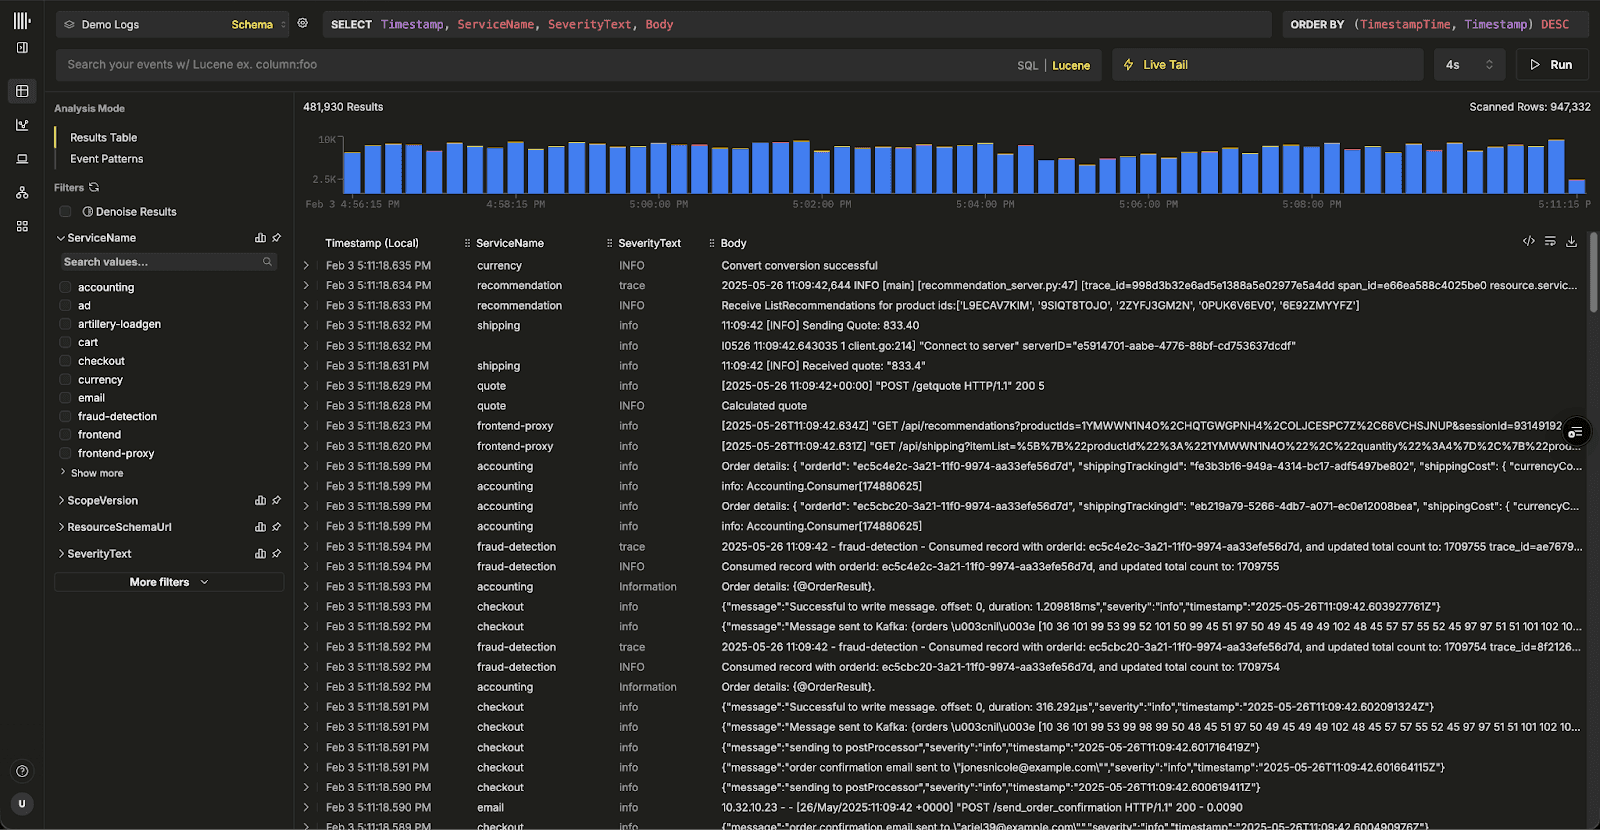
As an example, consider the simple example using our playground OpenTelemetry demo dataset, where we search for “Failed to place”:
-- example tokenbf_v1 schema
CREATE TABLE otel_v2.otel_logs
(
`Timestamp` DateTime64(9) CODEC(Delta(8), ZSTD(1)),
...
`Body` String CODEC(ZSTD(1)),
...
INDEX idx_body Body TYPE tokenbf_v1(32768, 3, 0) GRANULARITY 8
)
ENGINE = MergeTree
PARTITION BY toDate(TimestampTime)
PRIMARY KEY (ServiceName, TimestampTime)
ORDER BY (ServiceName, TimestampTime, Timestamp)-- example bloom_filter schema
CREATE TABLE otel_v2.otel_logs_bloom_filter
(
`Timestamp` DateTime64(9) CODEC(Delta(8), ZSTD(1)),
...
`Body` String CODEC(ZSTD(1)),
...
INDEX idx_body tokens(lower(Body)) TYPE bloom_filter (0.025) GRANULARITY 8
)
ENGINE = MergeTree
PARTITION BY toDate(TimestampTime)
PRIMARY KEY (ServiceName, TimestampTime)
ORDER BY (ServiceName, TimestampTime, Timestamp)-- query performance with no index!
SELECT count() FROM otel_v2.otel_logs WHERE (((hasToken(lower(Body), lower('Failed'))) AND (hasToken(lower(Body), lower('to'))) AND (hasToken(lower(Body), lower('place'))))) SETTINGS use_skip_indexes=0
1 row in set. Elapsed: 0.655 sec. Processed 90.58 million rows, 14.03 GB (138.20 million rows/s., 21.40 GB/s.)-- query performance using tokenbf_v1
SELECT count() FROM otel_v2.otel_logs WHERE (((hasToken(lower(Body), lower('Failed'))) AND (hasToken(lower(Body), lower('to'))) AND (hasToken(lower(Body), lower('place')))))
1 row in set. Elapsed: 0.199 sec. Processed 10.66 million rows, 2.66 GB (53.68 million rows/s., 13.40 GB/s.)-- query performance using bloom_filter
SELECT count() FROM otel_v2.otel_logs_bloom_filter WHERE hasAll(tokens(lower(Body)), tokens(lower('Failed to place')))
1 row in set. Elapsed: 0.096 sec. Processed 1.76 million rows, 159.73 MB (17.73 million rows/s., 1.61 GB/s.)
Peak memory usage: 234.32 MiB.The above shows an improvement in query performance of around 50%, with pruning more than 4x more effective (1.76m vs 10.66m rows processed) for the bloom_filter index. However, note how performance is appreciably better for both vs using no indexes.
An astute reader will notice the query syntax has also changed.
To ensure the index is used, we have updated how text search queries are generated in the ClickStack UI. Previously, ClickStack UI lowercased the log body and query text (we prefer case-insensitive search for logs), relying on implicit tokenization in the Bloom filter. The UI would also tokenize the query, using hasToken function with conjunctions relying on boolean logic e.g. (((hasToken(lower(Body), lower('Failed'))) AND (hasToken(lower(Body), lower('to'))) AND (hasToken(lower(Body), lower('place')))))
With the new filter, queries use the tokens and lower functions at query time, deferring tokenization to ClickHouse, with the hasAll function used to check token presence i.e. hasAll(tokens(lower(Body)), tokens(lower('Failed to place'))). This ensures the index is used correctly while preserving existing search behavior.
ClickStack automatically checks the index type in use and uses the correct querying approach.
Supporting text indices
Bloom filters are still a powerful tool, but they are not without limitations. False positives are unavoidable, and even simplified tuning introduces tradeoffs. For some workloads, especially large-scale log search, inverted indices can offer compelling advantages (although with tradeoffs).
ClickHouse’s inverted text index has undergone significant rework and is now available in beta. Recent improvements have focused on making it viable at large scale, particularly in ClickHouse Cloud on object storage. Internally, the implementation still uses Bloom filters as a lightweight existence check, allowing ClickHouse to skip expensive index evaluation when a term is guaranteed not to be present in a granule.
Our benchmarking on logging datasets has been especially encouraging, with inverted indices outperforming Bloom filters in both selectivity and query latency.
As a result, ClickStack now supports this index type directly in the UI. Enabling this required further updates to our Lucene-to-SQL compilation pipeline so that hasAllTokens is used when a text index is present. Note that the index is responsible for tokenization as well as pre-processing - expressions defined on index creation. For ClickStack, we use the splitByNonAlpha function for the tokenizer and lower for the pre-processor - thus replicating current search behavior.
INDEX idx_body Body TYPE text(tokenizer = 'splitByNonAlpha', preprocessor = lower(Body))There are a few constraints to be aware of. The hasAllTokens function supports a maximum of 64 tokens per call, so longer search terms are split into batches and combined with substring matching. It also requires enable_full_text_index to be enabled, which is only available in ClickHouse v25.12 and newer. For this reason, users running OSS deployments need to explicitly enable this setting in their ClickHouse user profile.
Currently, we only support the splitByNonAlpha tokenizer. If a text index is created with a different tokenizer, ClickStack will fall back to existing search behavior. Exploring additional tokenizers for log search is an area we are actively interested in - such as sparseGrams, which has shown potential for improving text search speed.
As an example, consider our earlier search. Note that we now use the hasAllTokens deferring tokenization and lower case to the index:
– new text index
INDEX idx_body Body TYPE text(tokenizer = 'splitByNonAlpha', preprocessor = lower(Body)) GRANULARITY 64
SELECT count()
FROM otel_v2.otel_logs_inverted_index
WHERE hasAllTokens(Body, 'Failed to place')
SETTINGS enable_full_text_index = 1, query_plan_direct_read_from_text_index = 1, use_skip_indexes_on_data_read = 1
┌─count()─┐
│ 194124 │
└─────────┘
1 row in set. Elapsed: 0.011 sec. Processed 1.33 million rows, 1.33 MB (116.59 million rows/s., 116.59 MB/s.)
Peak memory usage: 27.70 MiB.The query performance is almost 9x faster than the bloom filter for this example, with the volume of data read over 100x less. We would encourage the curious reader to read about the direct-read optimisations made to achieve this, as well as the caching options on offer for tuning text indices.
Next, we will be benchmarking inverted indices across a wider range of scales and workloads and publishing guidance in our new performance tuning documentation. While inverted indices can be extremely powerful, they come with additional storage and resource costs, and they may not be the right choice for every workload.
Stay tuned. We will be sharing more data and insights soon as we continue to answer a key question for observability at scale: when do inverted indices make sense?
Alerts use materialized views
Alerts now benefit directly from materialized views in ClickStack. Last month, we introduced support for materialized views in ClickStack. Any materialized view created in ClickHouse and registered with a source in the ClickStack UI, HyperDX, is automatically used to accelerate aggregation queries throughout the product - including charts, search histograms, and preset experiences. In this release, alerting has been fully integrated into the same query path, allowing alerts to take advantage of those same optimizations.
Materialized views represent a natural fit to power alerting. Alerts almost always query recent data, while materialized views perform aggregations at insert time, shifting work from query execution to ingestion. As data is inserted, aggregate states are computed and stored in a much smaller target table, making subsequent aggregation queries dramatically faster. By exploiting materialized views, alert evaluations become lightweight and efficient, even at high alert volumes.
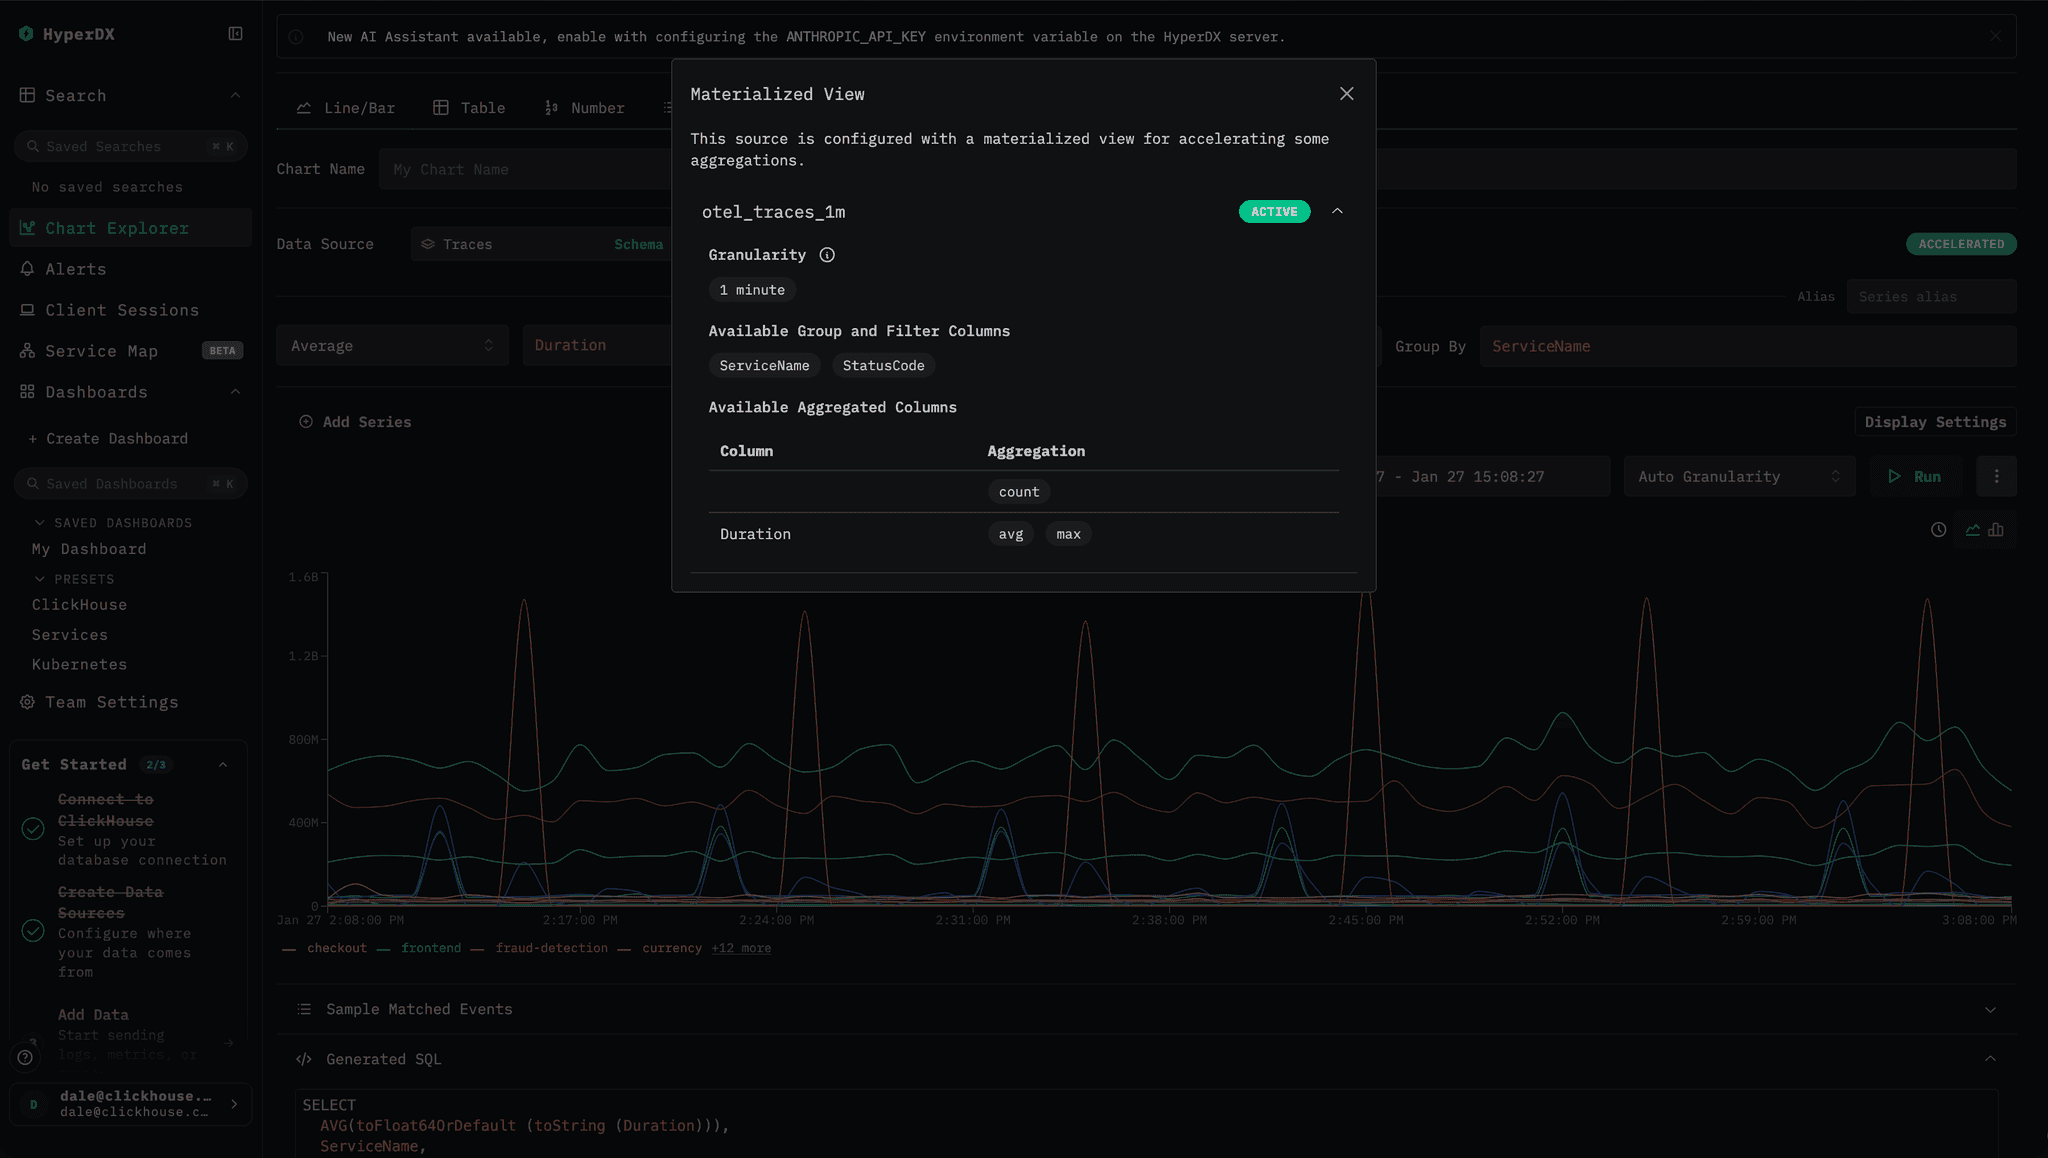
The result is that users can safely run hundreds or even thousands of alerts with minimal impact on overall cluster performance. The cost is paid incrementally at insert time and amortized across all incoming data, keeping per-insert overhead low. When building an alert visualization in HyperDX, users can tell if their alert will be accelerated with an icon showing that a materialized view will be used automatically.
Some smaller things
Alongside these larger wins around index usage, we continue to ship a steady stream of smaller improvements that make ClickStack easier to use day to day. These changes focus on usability, smoother workflows, and simpler deployment, helping teams get value faster while steadily improving the overall experience.
Filtering tables with HAVING
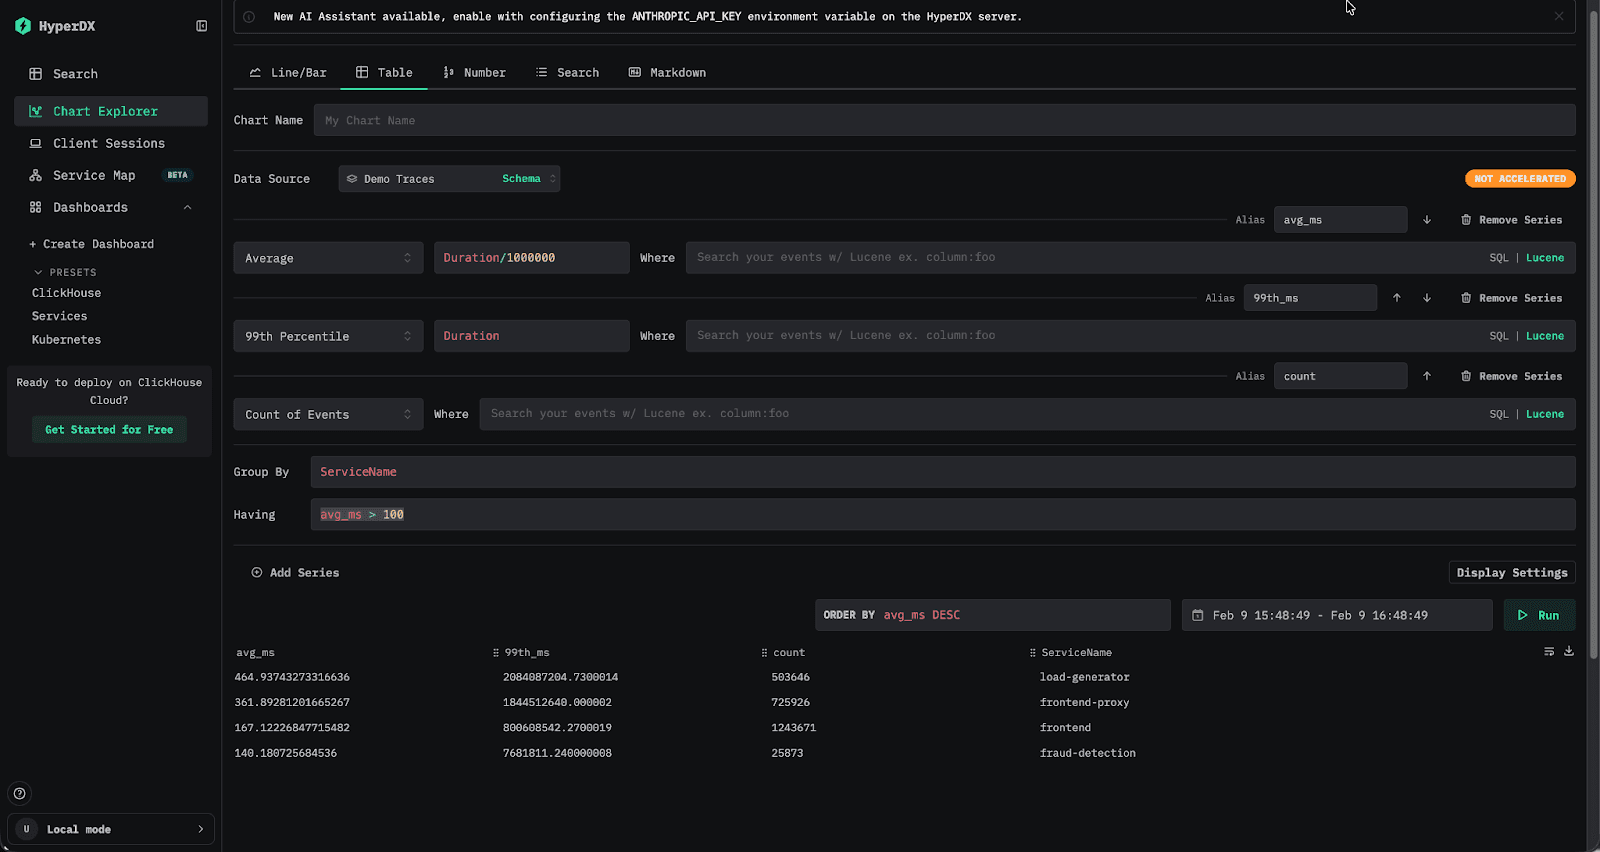
Users with a data analytics background will immediately recognize the value of the SQL HAVING clause for querying observability data. Unlike WHERE, which filters rows before aggregation, HAVING allows result sets to be filtered based on aggregate values computed during the query. For example, you might calculate the average latency and 99th percentile per service, then return only those services whose average latency exceeds 100 milliseconds. This pattern is especially useful for reducing large result sets down to something more meaningful and actionable.
SELECT
ServiceName,
round(avg(Duration / 1000000), 2) AS avg_ms,
round(quantile(0.99)(Duration / 1000000), 2) AS `99th_ms`,
count() AS count
FROM otel_traces
GROUP BY ServiceName
HAVING avg_ms > 100
ORDER BY avg_ms DESC
┌─ServiceName─────┬─avg_ms─┬─99th_ms─┬────count─┐
│ load-generator │ 584.3 │ 2668.15 │ 20564626 │
│ frontend-proxy │ 408.94 │ 1935.34 │ 31968439 │
│ frontend │ 203.57 │ 906.38 │ 54885807 │
│ fraud-detection │ 158.13 │ 8 │ 1050226 │
└─────────────────┴────────┴─────────┴──────────┘
4 rows in set. Elapsed: 0.502 sec. Processed 216.70 million rows, 1.95 GB (431.85 million rows/s., 3.89 GB/s.)
Peak memory usage: 239.85 MiB.The latest version of ClickStack now supports HAVING when querying tables in the UI. This allows users to filter results using any aggregate expression, not just raw columns. In practice, this means you can filter by an alias such as avg_duration > 100, or define an entirely new aggregate in the filter itself, for example median(Duration) > 100, giving you far more flexibility when exploring and refining aggregated results.
Legend filtering
Legend filtering for charts represents a small and thoughtful quality of life improvement for charts. You can now filter time series directly from the chart legend. Clicking a legend item instantly isolates that series in the chart, making it easy to focus on a single signal without touching the query. Click it again, and the chart resets to show everything.
We added a bit of extra polish here too. By holding Shift, you can select multiple series at once and compare them side by side. All legend entries remain visible, with clear visual cues showing what is selected and what is temporarily dimmed, and the Y axis automatically rescales to fit only the visible data. It is a small feature, but one that makes exploring charts faster, more interactive, and a little more satisfying to use.
Collector improvements
ClickStack is designed to make getting started with observability as simple as possible. It ships with a pre-configured OpenTelemetry Collector that just works with ClickHouse, with sensible defaults for batching, custom processing, and schema enforcement already in place.
By default, the collector is orchestrated using OpAMP, which secures the OTLP ingestion endpoint with an ingestion key exposed directly in the UI. Users can copy this key and send data to the collector with the appropriate authorization header, providing a secure and frictionless onboarding experience from the very first event.
As ClickStack has grown, and with the emergence of the managed offering, more users want to run the OpenTelemetry Collector independently of the UI while still benefiting from the ClickStack distribution and its ongoing improvements. To support this, ingestion can now be decoupled from the UI. If the OPAMP_SERVER_URL environment variable is omitted or set to an empty value, communication with the OpAmp server is disabled. The collector will continue to run independently, without relying on the UI for configuration.
To secure ingestion in this mode, users can provide an OTLP_AUTH_TOKEN. When set, this token is required for all data sent to its OTLP endpoint. This change makes it easier to get started with Managed ClickStack, while also enabling advanced users to operate their own collectors and still take advantage of ClickStack’s standardized processing and schema enforcement.
# Example command for running the ClickStack OpenTelemetry collector
docker run -e CLICKHOUSE_ENDPOINT=https://myhost:8443 -e CLICKHOUSE_USER="default" - e CLICKHOUSE_PASSWORD="<password>" -p 4317 -p 4318 -e OTLP_AUTH_TOKEN "a_secure_string_value" clickhouse/clickhouse-otel-collector:latestAnd finally, a new theme
Users reading the post above regarding Managed ClickStack may have noticed that the HyperDX interface looks a little different! With the launch of Managed ClickStack, we took the opportunity to introduce an alternative ClickStack theme. Since ClickStack’s launch, there has been occasional confusion around whether HyperDX is the product or the UI - the UI’s HyperDX branding not helping with this. You will increasingly see us refer to the UI as just the “ClickStack UI” - while still acknowledging its original identity as HyperDX.
The new ClickStack theme, which is used by default in our managed offering, aligns more closely with the broader ClickHouse branding - emphasizing the familiar white, yellow and blacks used across our products. Open source users can switch to this theme through user preferences, or keep the original HyperDX look if green is more your style. No hard feelings. Both themes are available in light and dark variants, so you can choose what works best for you.
Conclusion
That wraps up January for ClickStack. We have some exciting updates coming over the next few weeks, with APIs and RBAC firmly at the top of our roadmap as we continue to focus on making ClickStack easier to integrate and operate at scale. As always, we would love to hear what you want to see next.
Subscribe to our observability newsletter
Stay informed on ClickStack feature releases, product roadmap, support, and cloud offerings!
Sign up for the newsletter above for updates, and hop on to our #olly-clickstack Slack channel to ask questions, share feedback, or help shape what we build next.


