Summary
- Clever, the leading identity platform for K-12 education, uses ClickHouse Cloud to index and analyze logs across 400 services and 200 AWS Lambdas, generating around 150 TB of uncompressed data per month.
- They migrated from Datadog to ClickHouse Cloud, going from indexing just 10% of their logs to indexing all of them, while also increasing retention from 3 to 60 days, resulting in 200× more searchable log volume at no additional cost.
- Clever's infrastructure team built a custom query layer on top of ClickHouse Cloud that translates LogQL to SQL, giving engineers a familiar log exploration experience without a steep learning curve.
Clever is on a mission to connect every student to a world of learning. As the leading identity platform for K-12 education, Clever powers secure digital learning experiences for over 29 million teachers and students, reaching 77% of U.S. K-12 schools.
At that scale, logs add up fast. Clever runs 400 services and workers on AWS Fargate, alongside 200 AWS Lambdas generating around 150 TB of logs every month. For senior software engineer Jake Gutierrez, keeping those logs accessible to the rest of Clever's engineering team was becoming a problem in its own right.
Jake joined solutions architect Jake Vernon on a webinar, where they walked through how they rebuilt their logging infrastructure, and how switching from Datadog to ClickHouse Cloud on AWS helped them index 200x more logs at no additional cost.
A frustrating, fragmented logging system
Before ClickHouse, Clever sent all of its logs to Datadog. The problem was that Datadog only indexed about 10% of Clever's logs and kept them for just three days. The remaining 90% went into AWS Athena, where they were available for up to 60 days but required writing SQL to access. Any engineer trying to debug an issue had to figure out whether they needed to look beyond the three-day retention window and switch tools.
"This dual-brain system proved to be very confusing," Jake says. "Engineers would say, 'Where's my log?' because we didn't index the debug logs. Or they'd say, 'This error log started three days ago,' when in reality it started much longer than that. If they wanted to look at a trend over 30 days, it would be very difficult—they'd have to go to Athena for that."
Three requirements that led them to ClickHouse
In need of a better solution, the Clever team started with three requirements.
First, they wanted the ability to store all logs in one place for 60 days. This would provide the historical context engineers needed to spot trends and debug with confidence.
Second, the solution had to be competitively priced, highly available, and ideally a managed service so that, as Jake puts it, "we don't have to bear that maintenance overhead."
Third, it had to be easy to use. Most of Clever's engineers don't work with SQL day-to-day. The new system, Jake says, needed to be "very straightforward, similar to Datadog, at a similar performance level."
ClickHouse Cloud checked those boxes. As Jake recalls, "We came across ClickHouse because of so many high-profile observability use cases that had come out recently." They evaluated a few other ClickHouse-based solutions, but ruled them out as "too expensive for storing the entire dataset." ClickHouse's managed service struck the right balance, giving Clever the performance they needed while keeping cost and the maintenance burden low.
Schema design for observability with ClickHouse
As Jake notes, schema design is one of the more interesting topics in the ClickHouse community. "There are lots of different ways to store logs in ClickHouse," he says. Clever's logs are largely structured JSON, so the team wanted a way to index them at write time, instead of having to parse them at query time.
Next, commonly queried fields like level and service are extracted directly into their own columns. For everything else, the team takes what Jake calls a hybrid approach, storing the full log as both a raw JSON string and an attributes map. The map contains only fields that haven't already been extracted to their own columns, so engineers can pull top-level fields quickly and expand into the raw JSON only when they need more detail.
Clever uses a variety of data skipping indexes. A minmax index on the timestamp column keeps normal timestamp filtering working correctly. A token bloom filter on the body field enables fast, case-insensitive full-text search. Bloom filters on the map keys and token bloom filters on the map values extend that searchability into the attributes. Through internal benchmarking, Jake determined that a granularity of 32 for the body and attribute value indexes provided a good balance between performance and index size.
Partitioning is, as Jake puts it, "pretty straightforward"—by date, paired with a TTL of 60 days, along with ttl_only_drop_parts. "That gives us pretty good performance for dropping entire partitions," he notes.
Next comes the primary key and ORDER BY. "This is where it gets interesting," Jake says. Rather than storing records in forward chronological order, Clever stores them in reverse, ordered by negative Unix timestamp. This means ClickHouse finds what it's looking for at the front of the data rather than scanning through it. The result was an 8-10x speedup in query times. The minmax index on the timestamp column (which, Jake notes, might seem redundant given the primary key) is what makes normal timestamp filtering still work correctly without engineers having to invert their queries.
Timestamps, which are stored at both seconds and milliseconds precision. "We filter on the timestamp in seconds, then use milliseconds to narrow within that range," he explains. "This gives us pretty good performance and compression."
Finally, Clever enabled the ClickHouse Cloud setting cache_populated_by_fetch, which proactively populates the filesystem cache on replicas as data is ingested. This helps ensure consistent query performance regardless of which replica serves a request. As Jake says, "a SELECT query to one should have consistent results and consistent performance across all of them."
Keeping the system resilient
"Observability is one of the most important parts of any system," Jake says, "which means it must be resilient to outages and highly available." He walked through Clever's three resiliency requirements: separate production and dev logs, write to multiple regions, and manage the entire system as code.
Separating prod and dev logs, he says, is primarily about "avoiding contention." For example, a developer running a load test could spike log volume, bringing down the production logging system. A separate dev ClickHouse service eliminates that risk, giving the team a safe environment to test changes to the logging pipeline without impacting production.
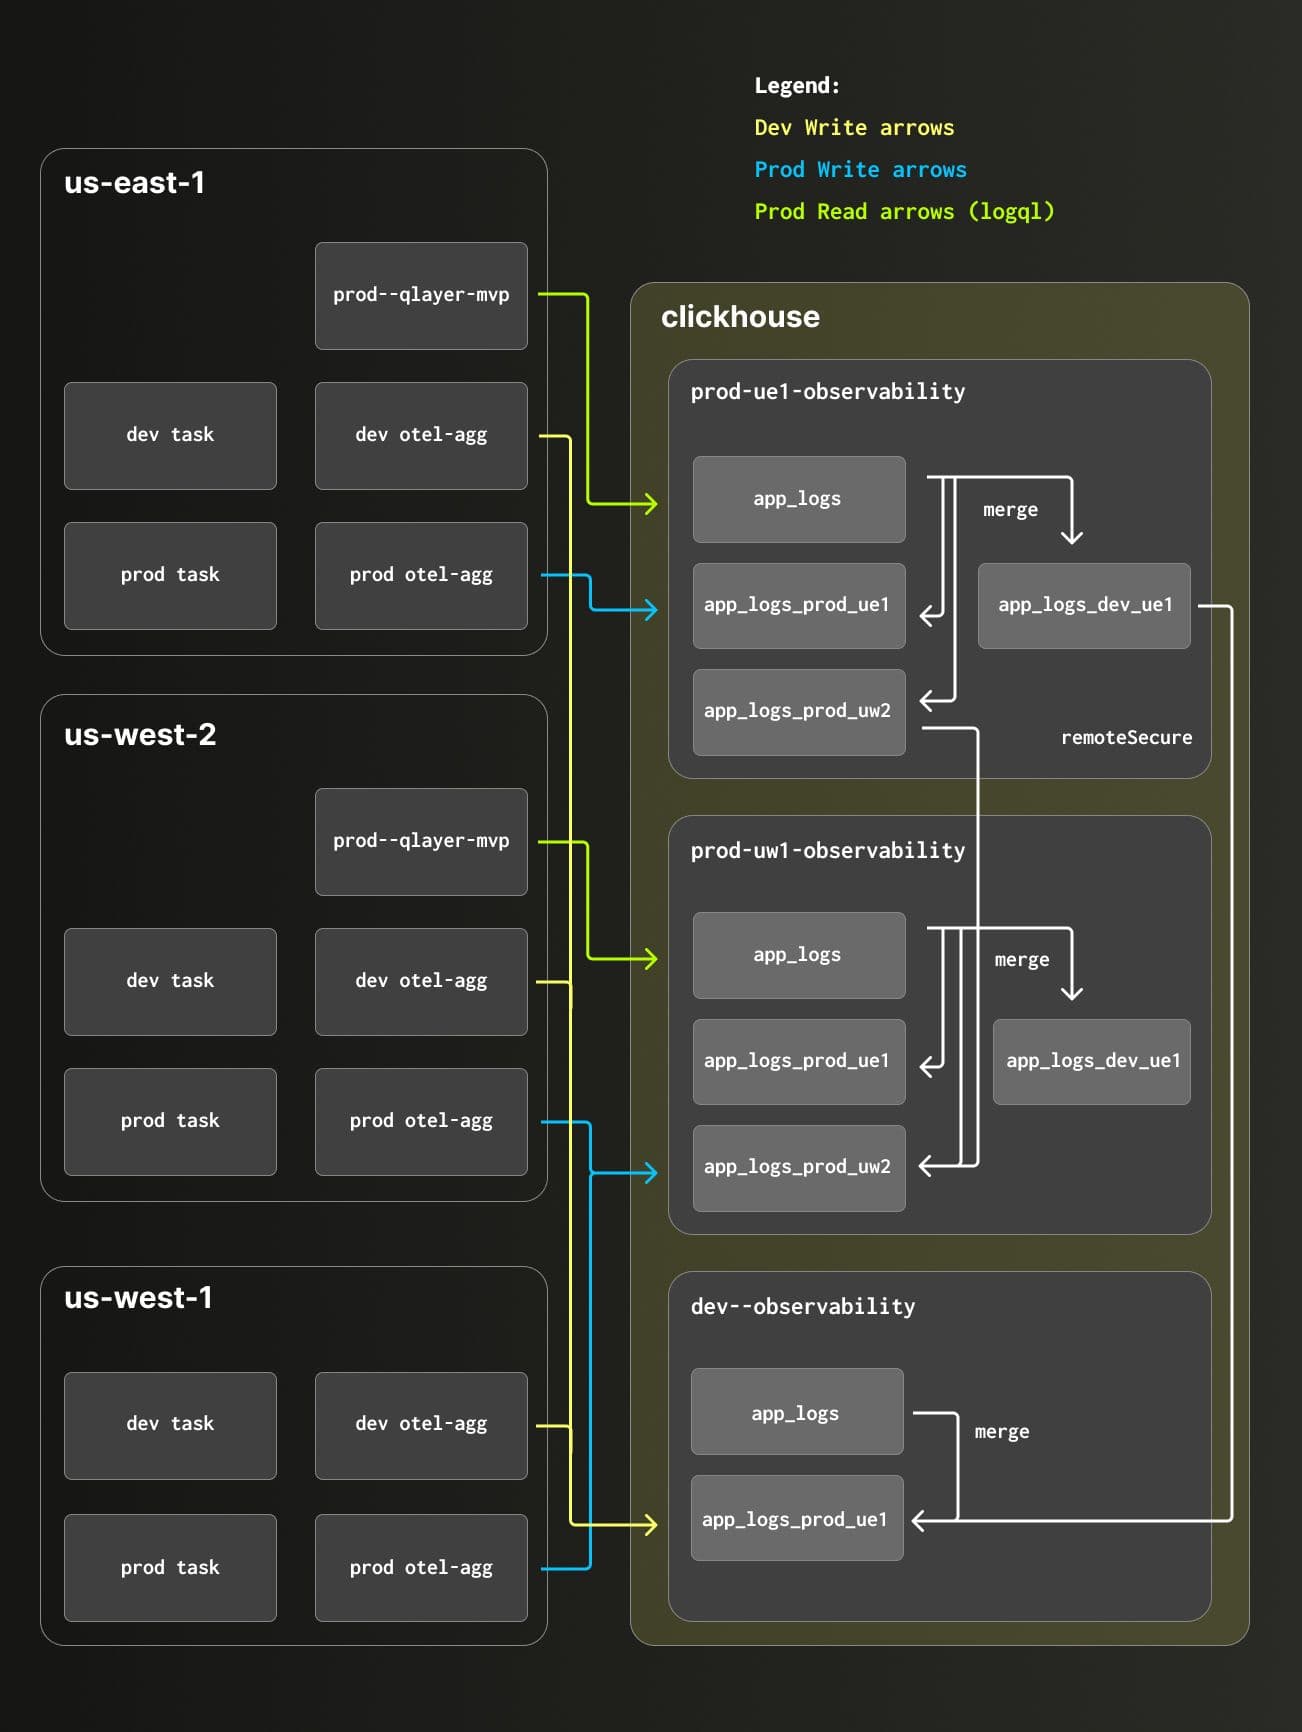
Production logs are split across two ClickHouse services based on the region and Dev logs are stored in another separate ClickHouse service.
Since Clever runs across multiple AWS regions, the team wanted the logging system to be multi-region as well. This way, Jake says, "If ClickHouse is down in us-east-1 or there are connectivity issues, we don't just lose all logs from that region." Production logs are split across regions and environments: ClickHouse Cloud services in us-east and us-west, with a third service handling dev logs. ClickHouse's remoteSecure table function and merge tables stitch the two production services into a single queryable surface, with reads load-balanced across both regions.
"ClickHouse Cloud multi-region availability gives us the business continuity and disaster recovery we needed. In case of an outage, we can easily stop and redirect all reads or writes to only one of these services, we're much more resilient." — Jake Gutierrez, Sr Software Engineer, Clever
The infrastructure-as-code requirement was about making the system easily reproducible. Every ClickHouse service, secret, and KMS key is provisioned with Terraform. Schema changes are managed through Goose using incremental SQL migration files, supplemented by Go-based migrations for anything that requires dynamic resource creation (e.g. the remote tables that connect the regional services). "The Go functions are also useful for pulling credentials so we don't have to store plaintext passwords in GitHub," Jake says.
Making ClickHouse feel like home
The third area Jake covered was query experience. "We wanted something similar to Datadog, so that it's easy for engineers to ramp up to this new system with no steep learning curve," Jake says. While raw SQL access to ClickHouse is powerful, most of Clever's engineers don't use SQL day-to-day. They were familiar with Grafana and wanted to keep using it, but the official ClickHouse Grafana plugin didn't support their non-standard schema.
So the Clever team built their own query layer. "Q-Layer," as it's known, is a service that implements a subset of Grafana's LogQL and translates those queries into ClickHouse SQL behind the scenes. Engineers write queries in a familiar, Datadog-like syntax; Q-Layer handles the translation. As Jake notes, "More complex queries can still be made in SQL, and engineers can always request improvements to the LogQL implementation." Projections back the log volume chart for fast count queries, while a materialized view powers IntelliSense-style autocomplete on log labels.
The result, as Jake puts it, is a logging system that engineers can query without having to think about what's running underneath.
200x more logs, 0% cost increase
With ClickHouse in place, Clever has seen a 10x compression ratio on its 150 TB of monthly logs. And whereas Datadog was indexing just 10% of those logs, ClickHouse indexes all of them, amounting to a 200x increase in searchable log volume.
"With ClickHouse, we see a compression ratio of 10x and a 200x increase in indexed logs. These logs are easily accessible to all engineers; they don't have to think about whether to go to Grafana, Athena, Datadog, or whatnot. And all of this came at a 0% increase in cost." — Jake Gutierrez, Sr Software Engineer, Clever
For anyone thinking about building something similar, Jake's advice is simple: just start. "Spin up ClickHouse locally and try it yourself," he says. "Even inserting random records into a table or backfilling some logs into a ClickHouse cluster helped me a lot." Jake also suggests running both systems in parallel initially. "That helped us guarantee we were moving to a system that was a step up from what we had," he says.
While Clever built a custom schema tailored to their structured JSON logs, not every team needs to start from scratch. For teams using OpenTelemetry, ClickStack provides an optimized schema out of the box, designed to handle observability workloads at scales of tens of terabytes per day. Many of the techniques Clever adopted, including extracting frequently queried fields, using data skipping indexes, and optimizing sort order for common access patterns, are the same principles we recommend when tuning ClickStack for larger-scale deployments.
Get started today
Interested in seeing how ClickHouse works on your data? Get started with ClickHouse Cloud in minutes and receive $300 in free credits.
Sign up