50.6k
50.6k
It has been a couple of months since ClickHouse Managed Postgres entered Beta. Since then, the team has been shipping at a rapid pace toward our vision of a unified data stack for OLTP and OLAP powered by Postgres and ClickHouse.
About a month ago, we published a blog highlighting the key platform features introduced post Beta, including RBAC, Terraform, ClickPipes, extension support, and more. This post builds on that update and covers the latest product improvements, including a simpler onboarding experience, customer notifications, richer observability, faster backups, expanded extension support, and more.
Refined onboarding experience
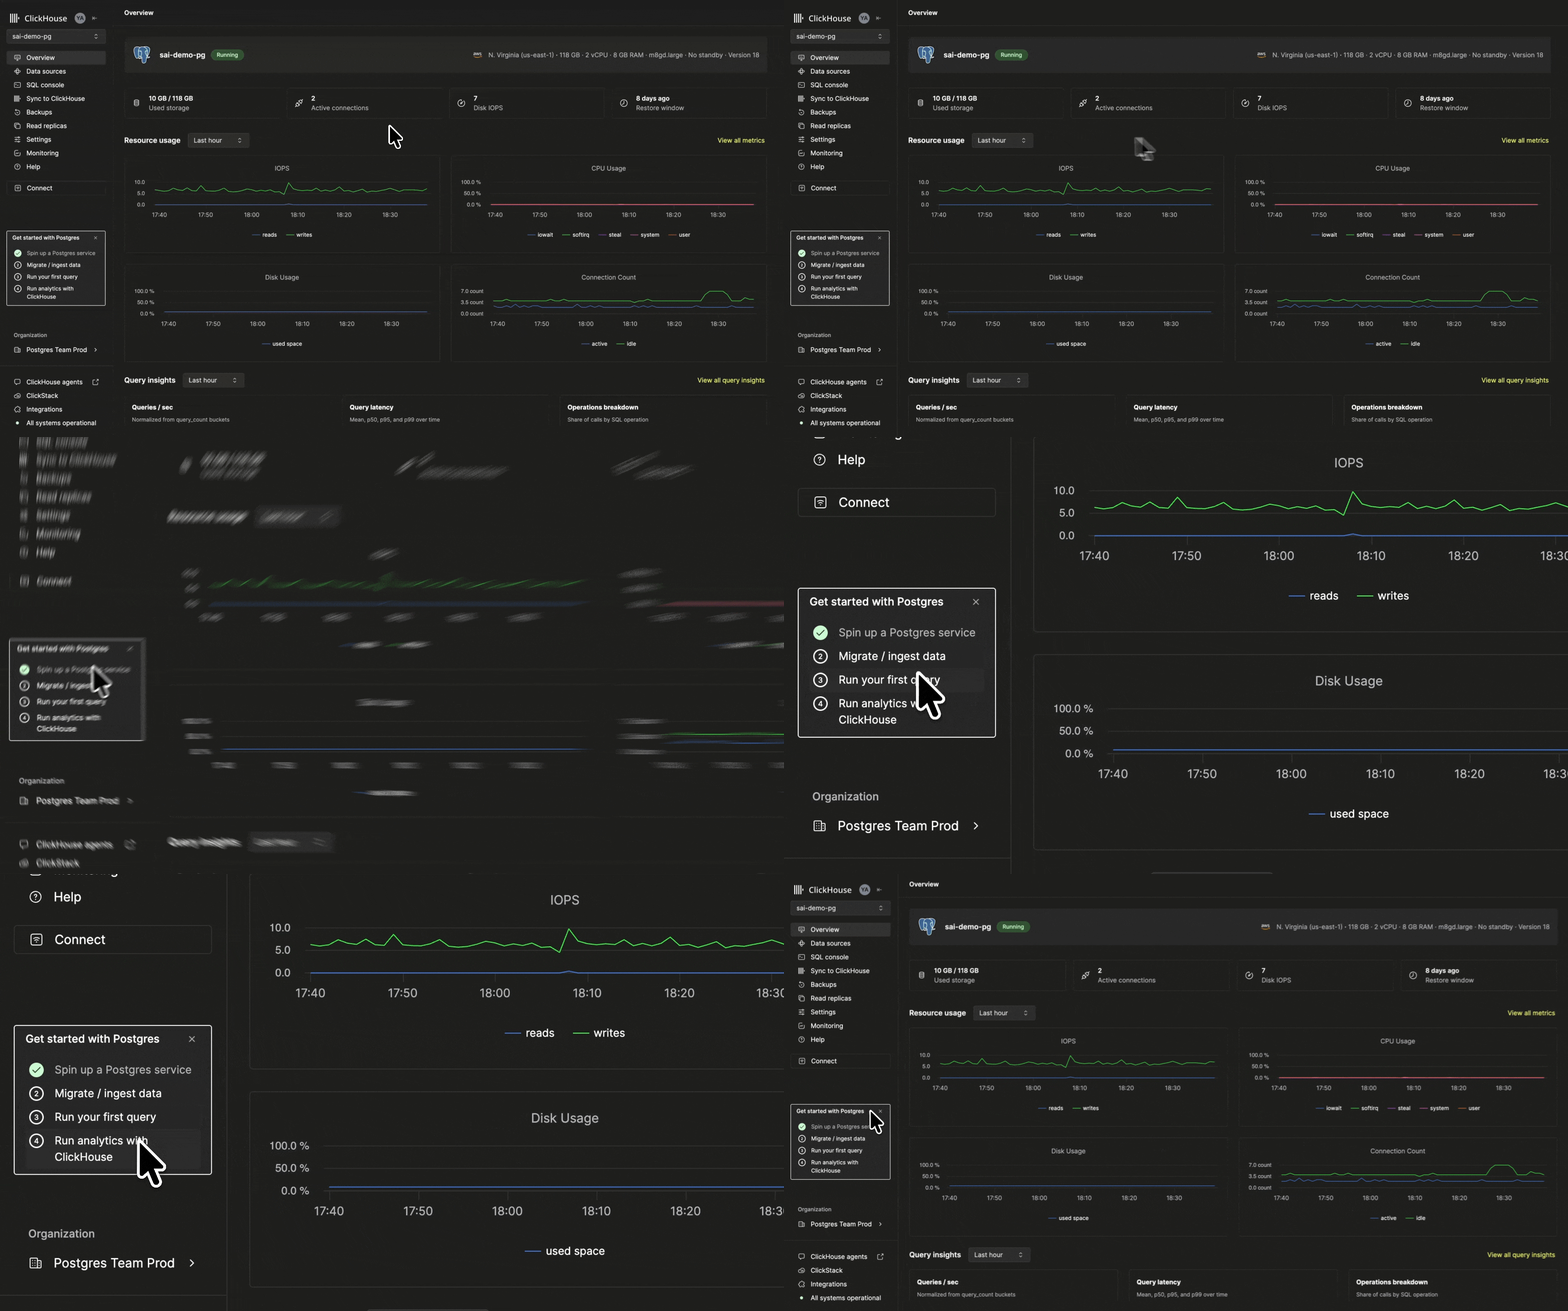
We've redesigned the onboarding experience to make it easier than ever to get started with ClickHouse Managed Postgres and quickly experience the value of a unified Postgres and ClickHouse data stack.
- Load or migrate data – Get started with sample datasets or migrate existing PostgreSQL databases using ClickPipes, our fully managed migration and CDC service.
- Query your data – Explore and interact with your PostgreSQL database immediately through the built-in SQL console.
- Sync to ClickHouse – Replicate operational data to ClickHouse in just a few clicks to power real-time analytics.
- Enable unified querying – Configure
pg_clickhouseto seamlessly query and join data across Postgres and ClickHouse through a single PostgreSQL interface.
Customer notifications
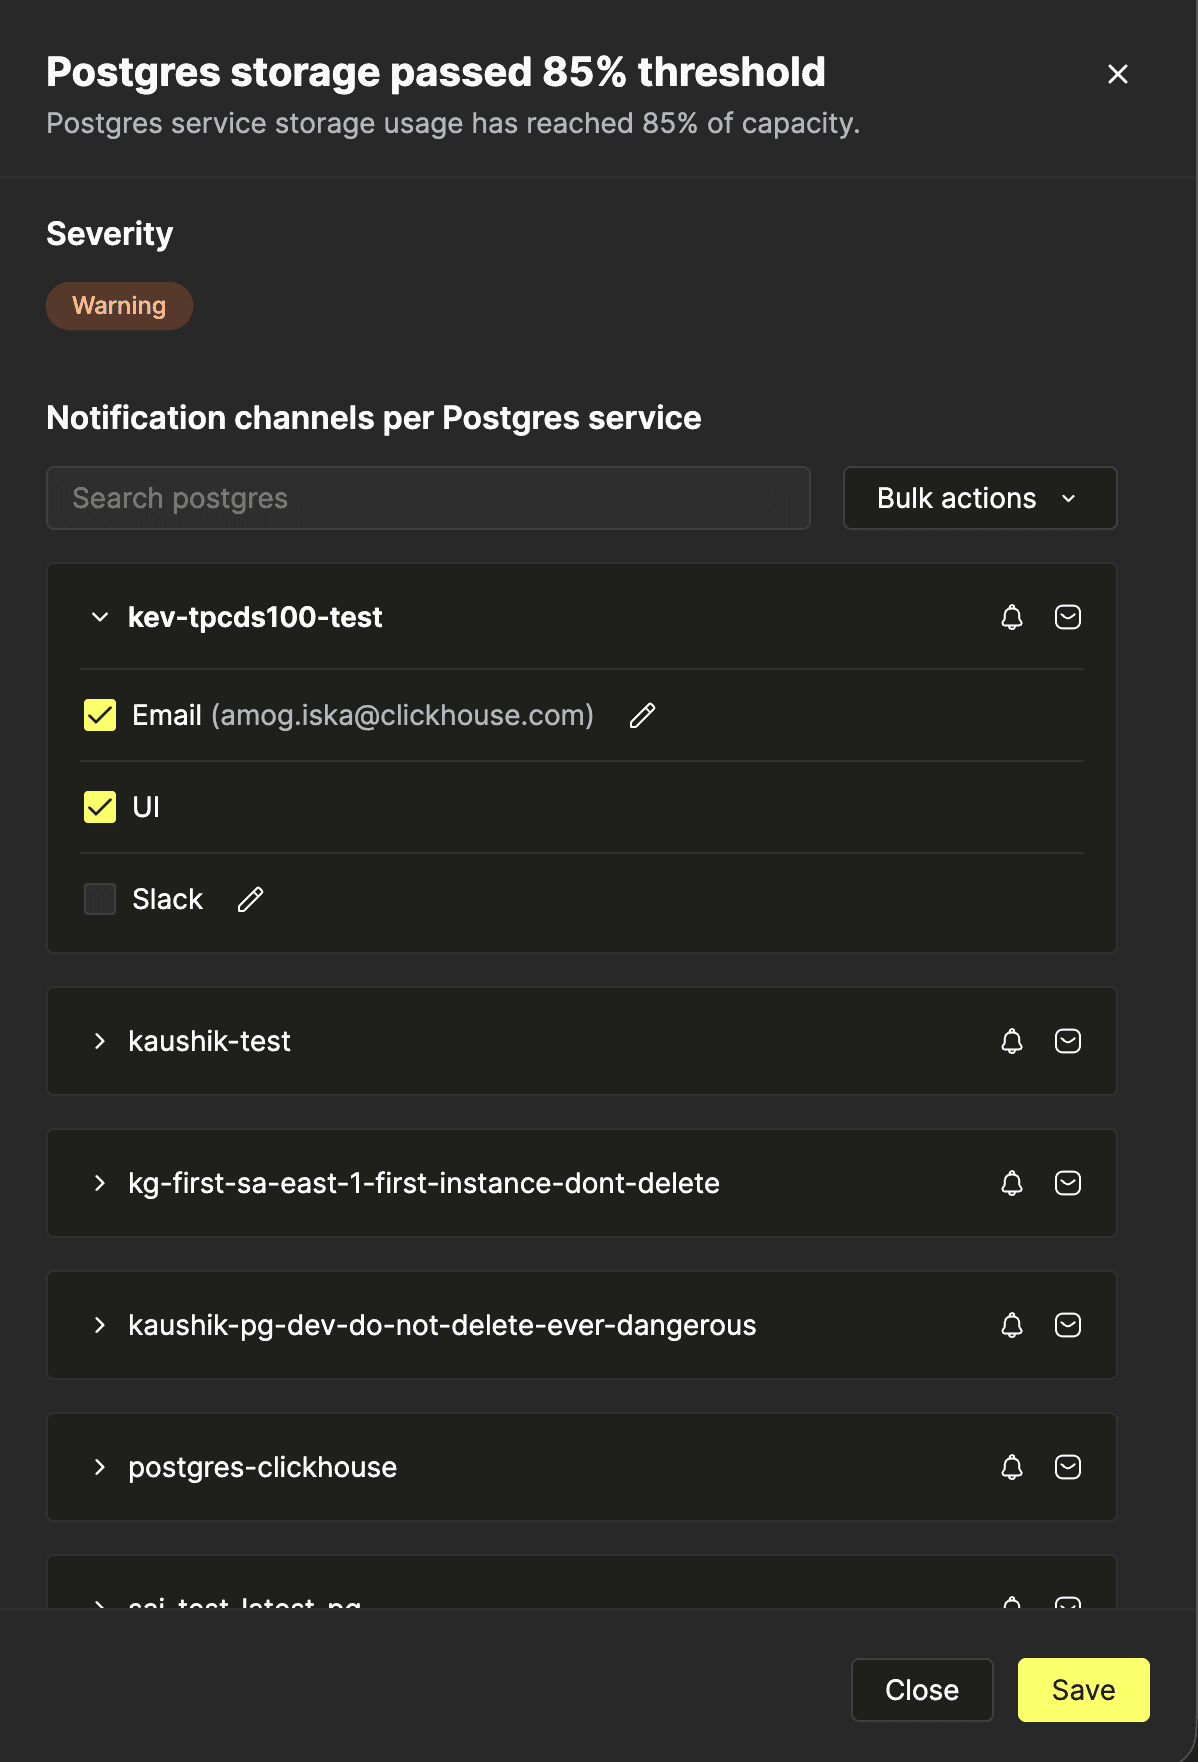
Managed Postgres services now come with built-in customer notifications. Starting today, if a Postgres service's disk usage stays above 85% of capacity, we proactively notify you in the console and by email, with optional slack notification. In your settings page you can configure the notifications channels for each of your postgres services:

Here is a sample Notification in email:
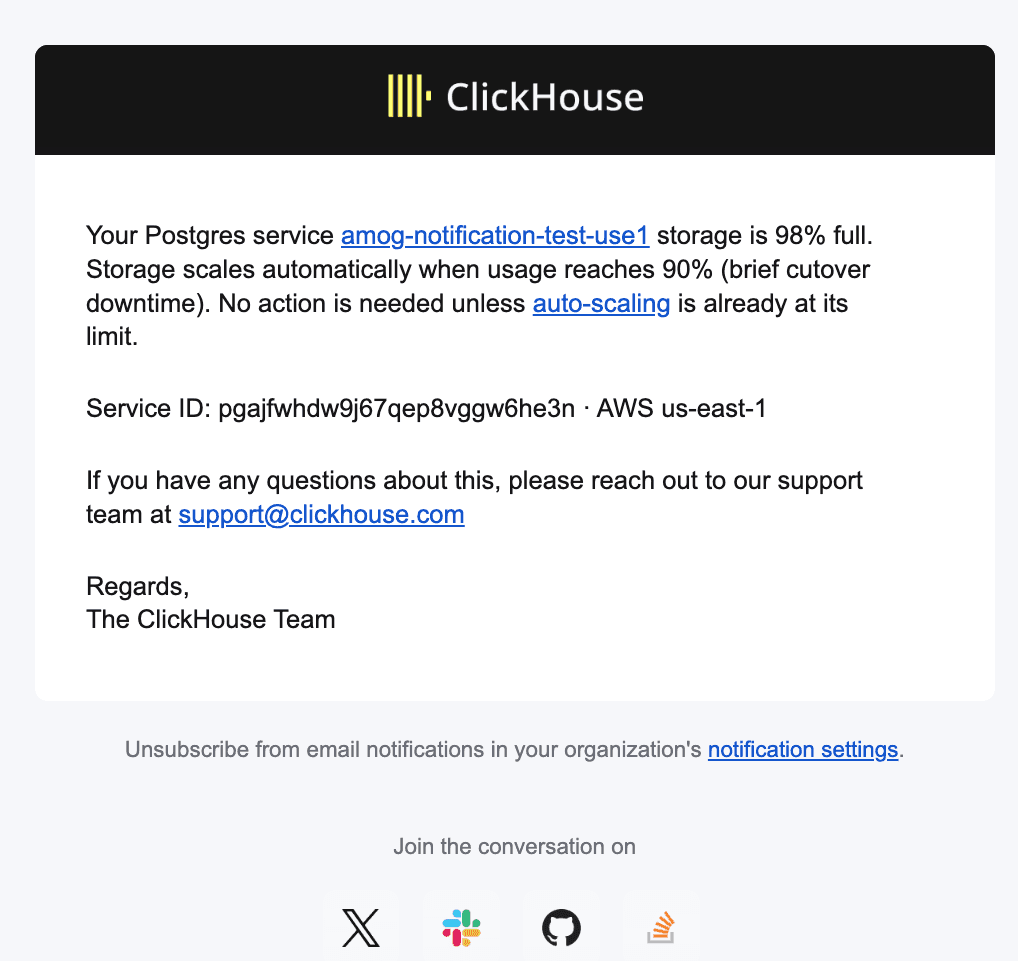
Your storage scales up automatically, so this is a heads-up that your data has grown, so you can decide whether that's expected, and stay ahead of the brief cut-over and costs that come with auto-scaling. Learn more in the documentation: https://clickhouse.com/docs/products/managed-postgres/monitoring/notifications
And this is just the start: replica lag seconds and uptime notifications, built on the same metrics foundation, are coming next. Alongside that we are launching failover notifications, which are emitted as events the moment a failover happens.
Comprehensive observability – Logs, metrics, Prometheus endpoint, and more
We've made it easier than ever to understand exactly how your ClickHouse Managed Postgres services are performing, with comprehensive observability built directly into the ClickHouse Cloud console and seamless integration with the monitoring tools you already use.
Logs
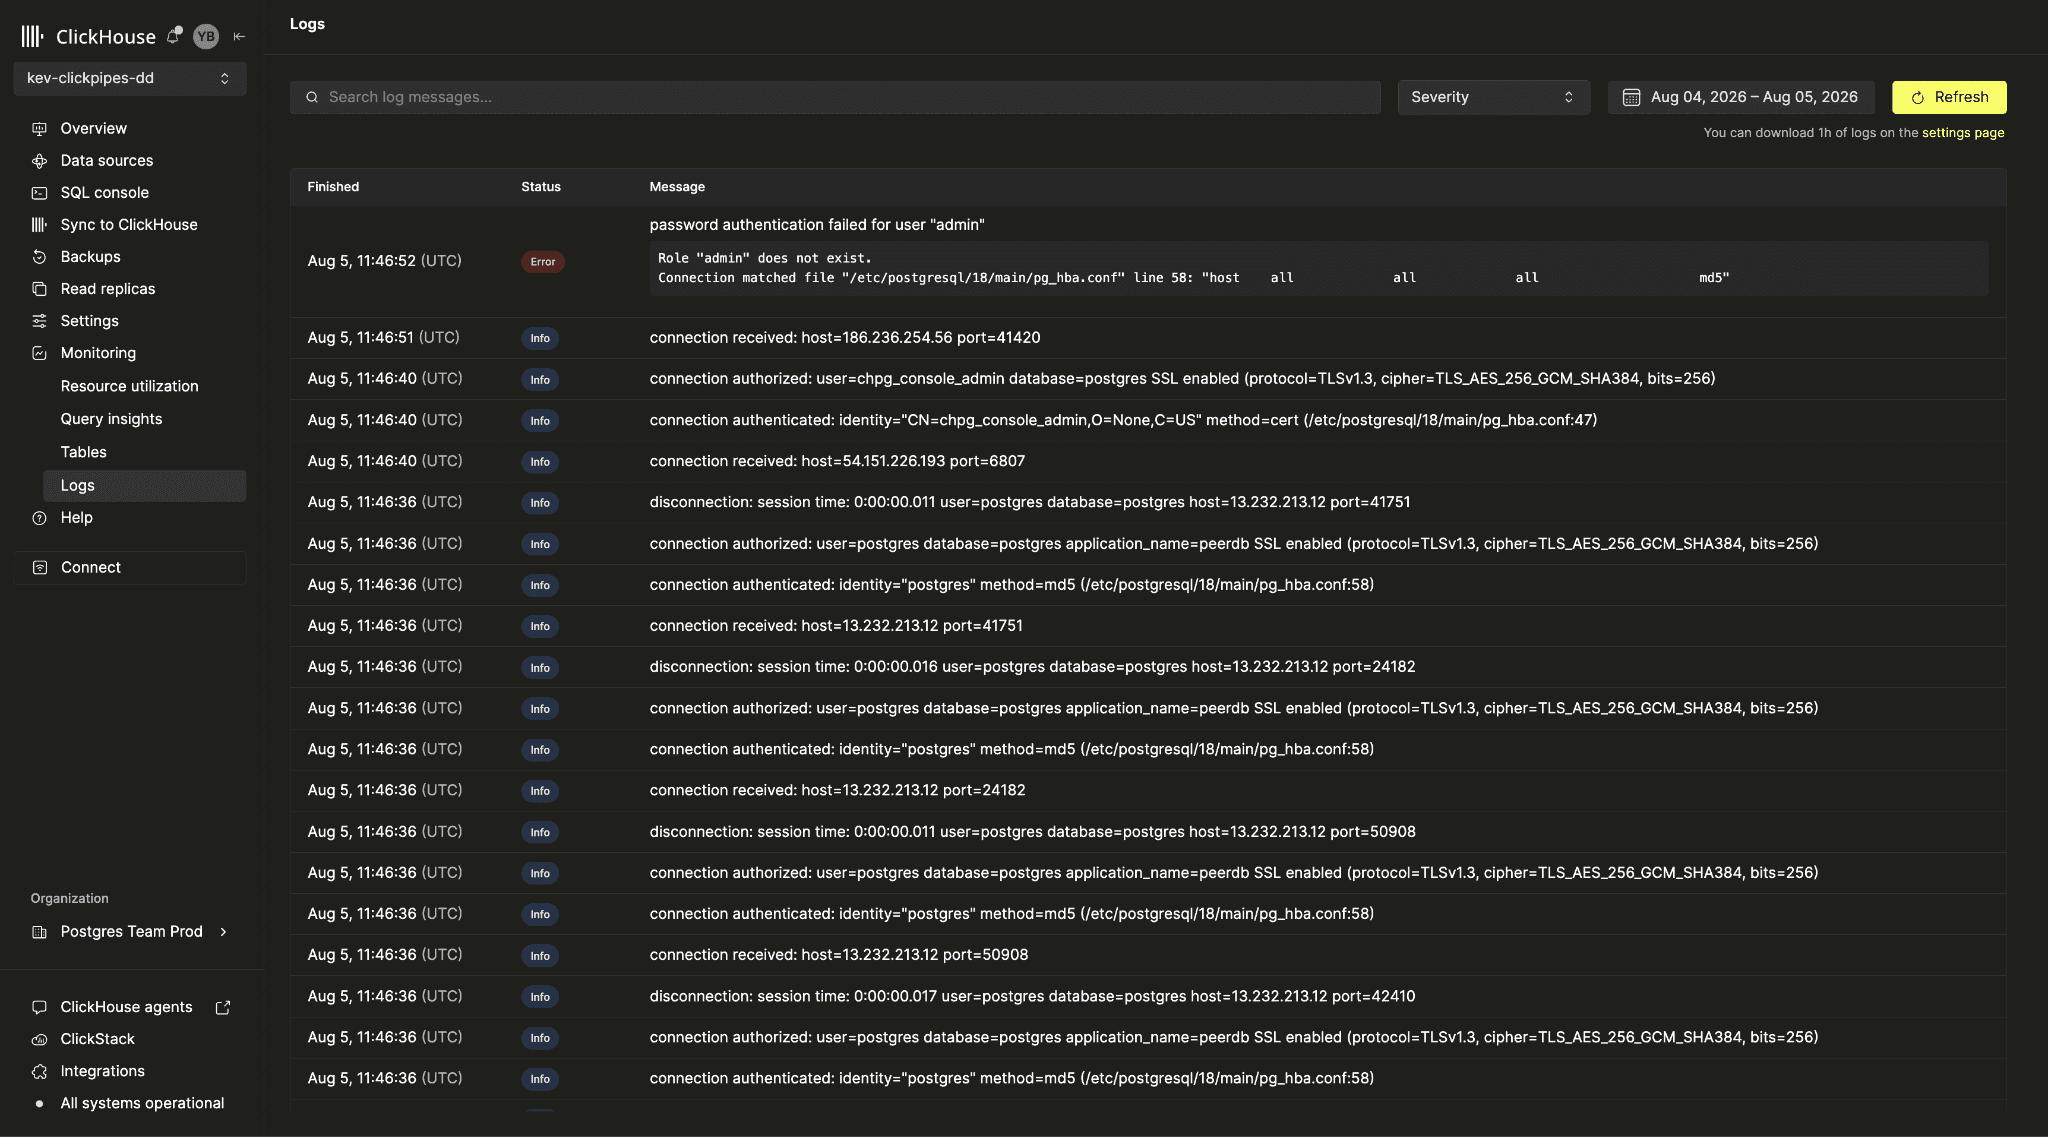
Explore your PostgreSQL server logs directly in the console with the new Logs view, using full-text search and severity and time-range filters to find exactly what you need in seconds.
Metrics
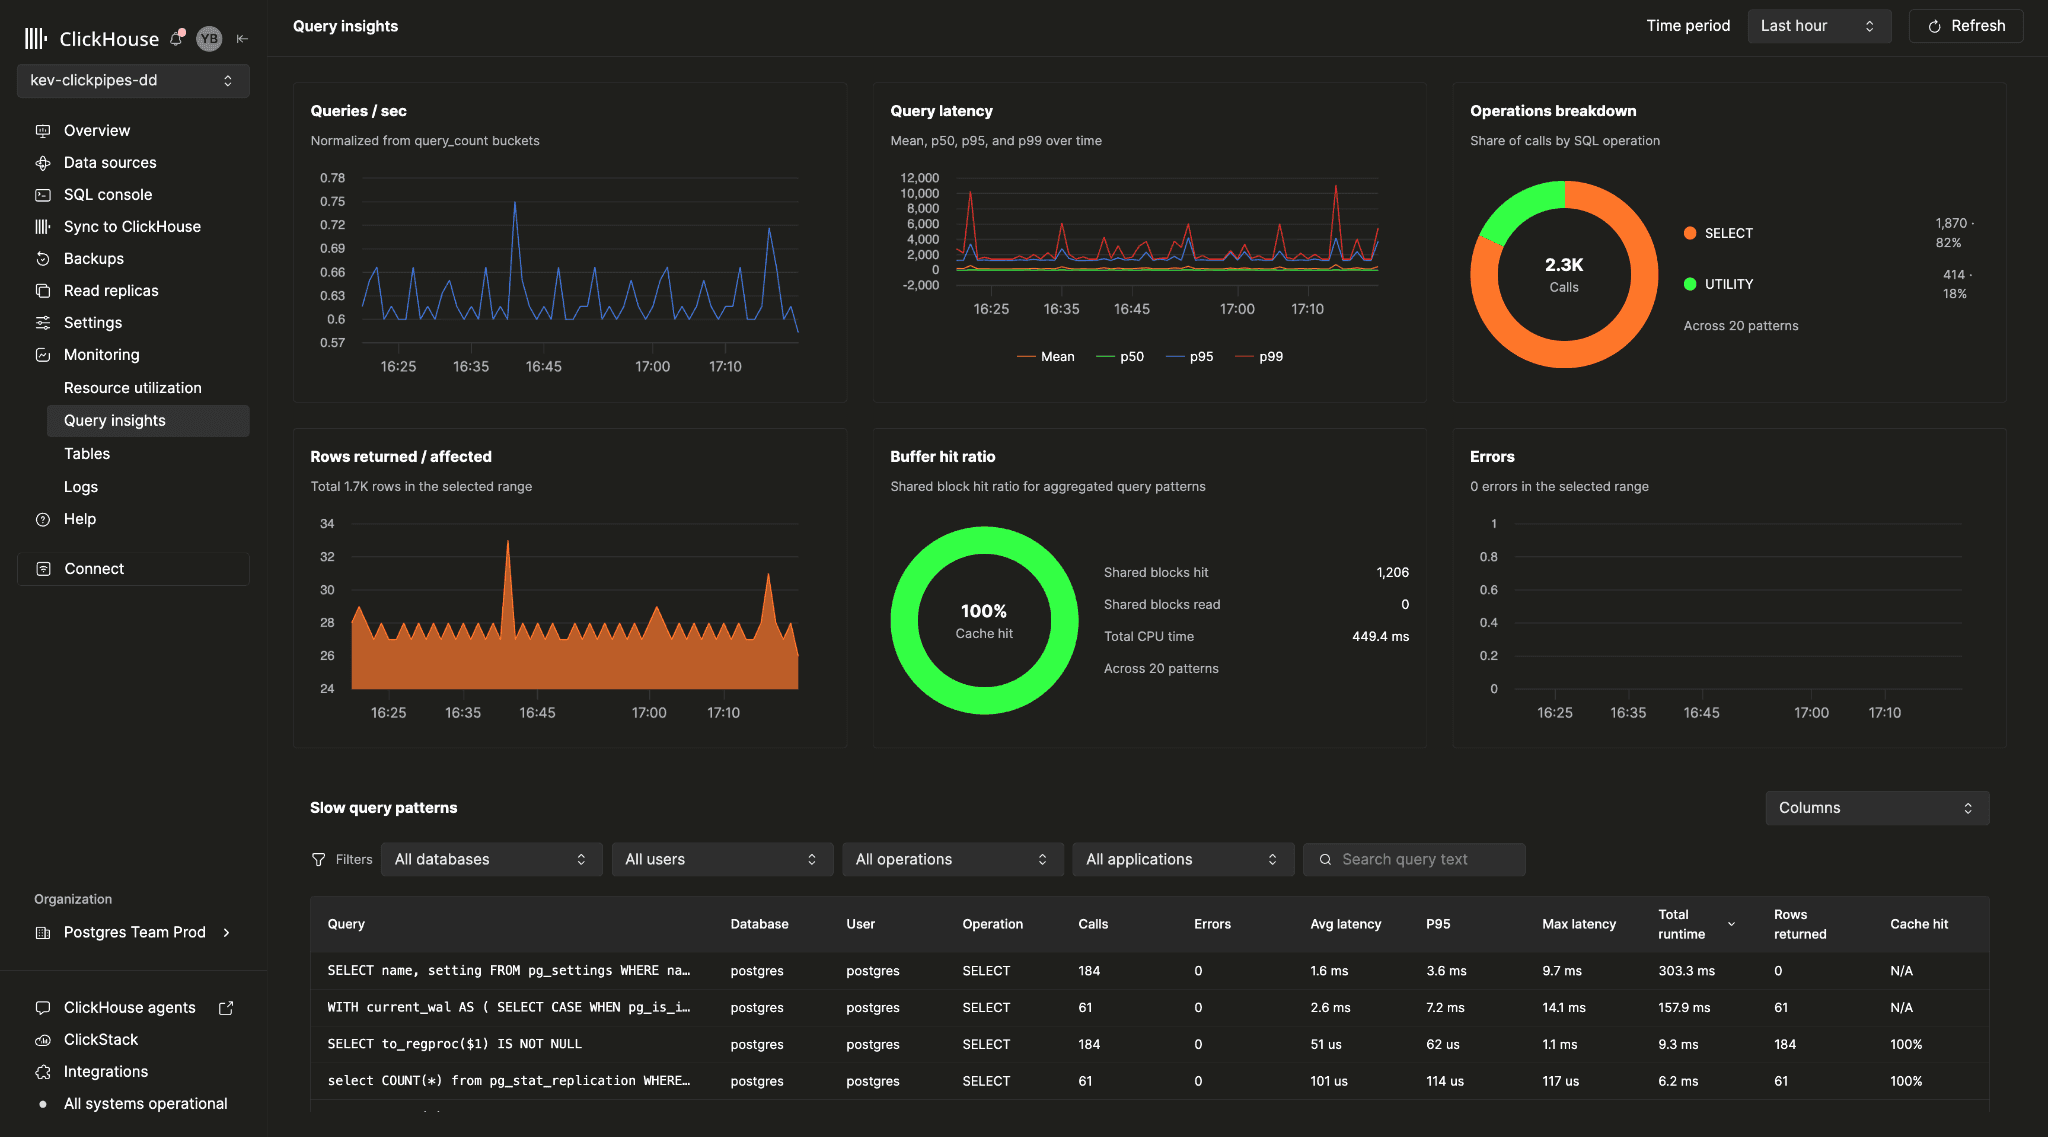
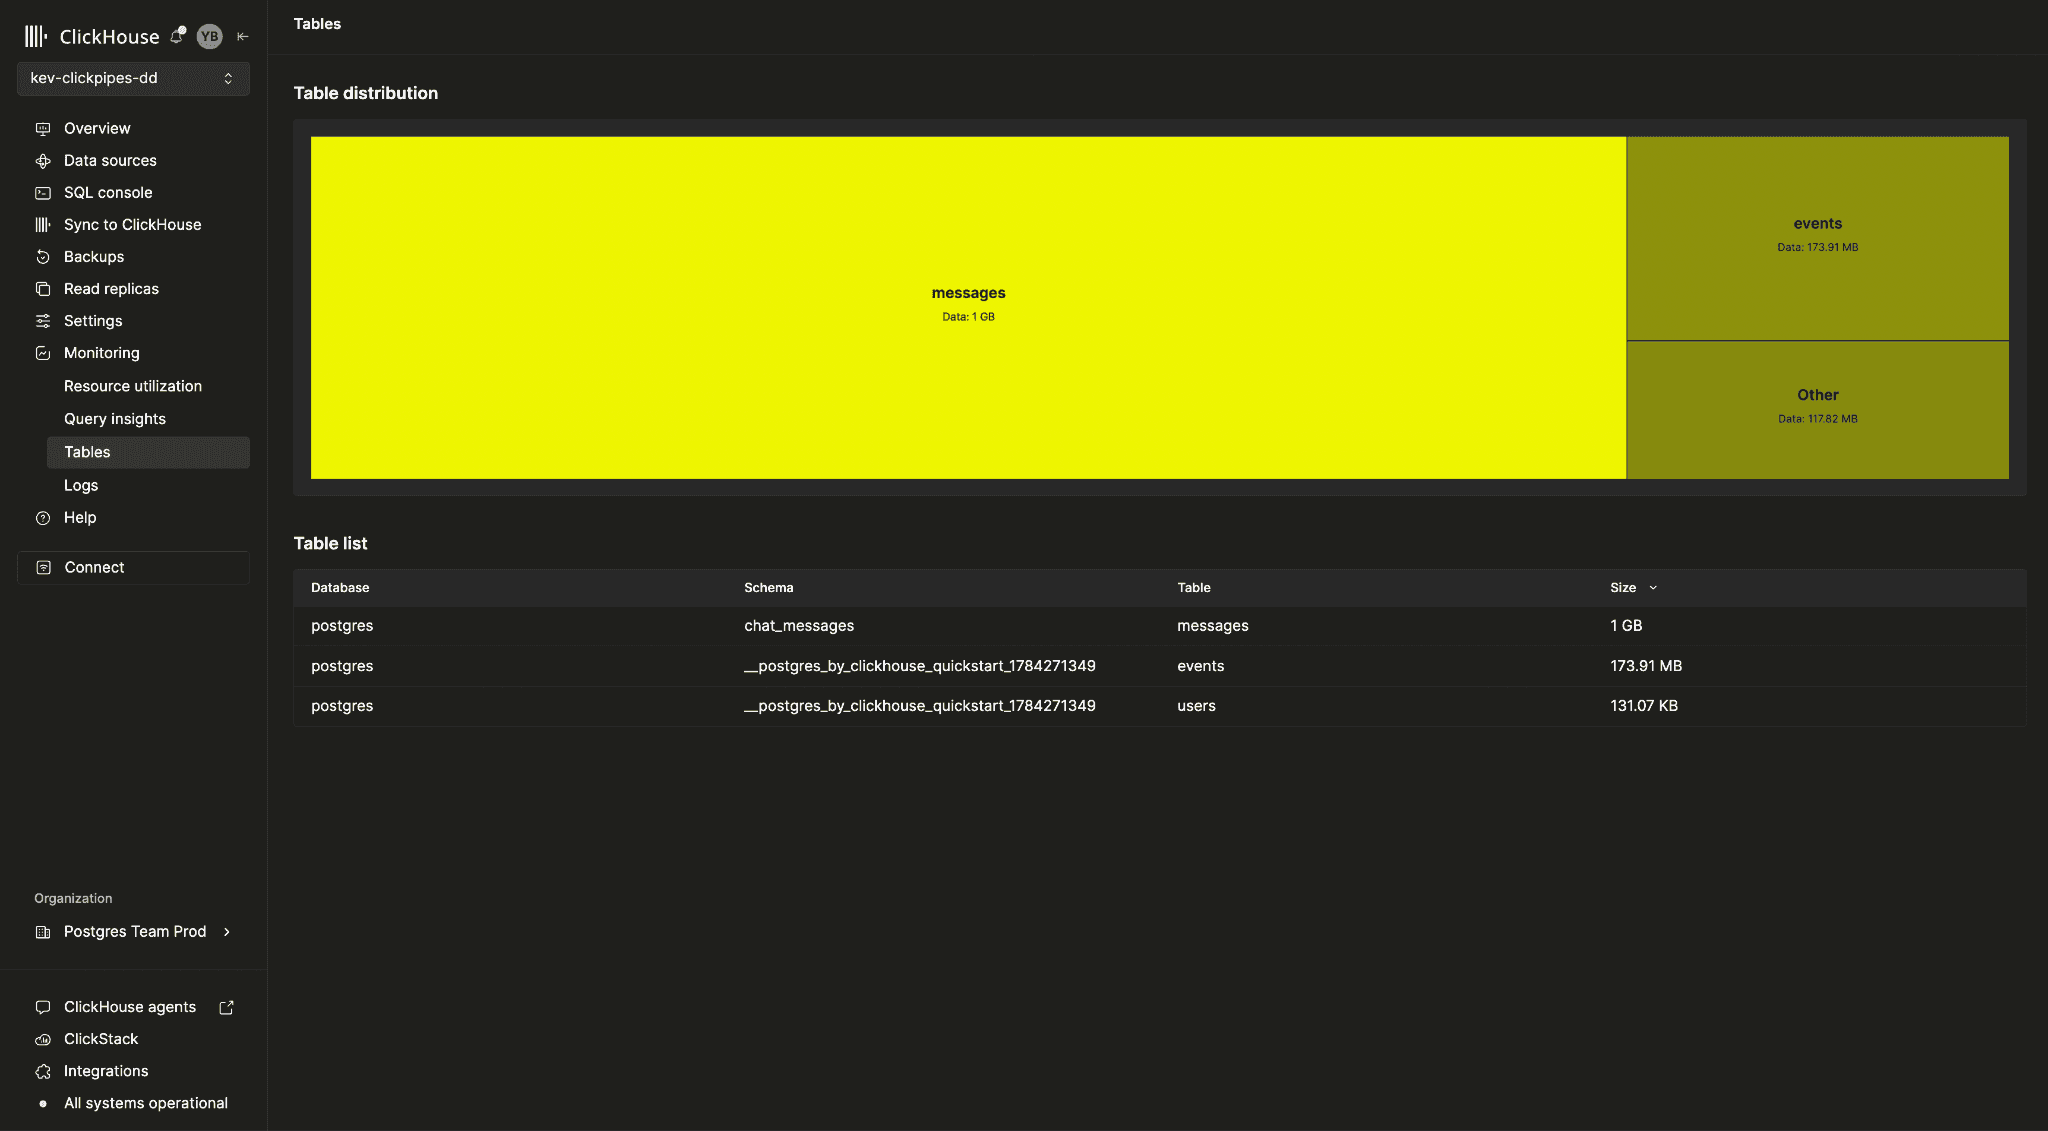
Monitor service health at a glance through a refreshed metrics experience - CPU, memory, disk, IOPS, and connections, with a per-table breakdown that shows exactly where your storage is going. Dig deeper with Query insights, revealing per-query latency, throughput, and your slowest queries in real time.
Prometheus Endpoint
Our OpenAPI exposes a Prometheus-compatible /metrics endpoint that surfaces system and database signals in standard Prometheus exposition format. Point your existing Prometheus server (or any OpenMetrics-compatible scraper) at the endpoint to pull metrics on your normal scrape interval. From there the metrics flow into your existing dashboards and alerting rules, so Managed Postgres health lives alongside the rest of your components instead of in a separate console. See the Prometheus monitoring docs.
OpenAPI for Observability
The ClickHouse Cloud Postgres Slow Query API is an OpenAPI/REST surface built for pulling observability data programmatically, most notably slow query patterns, which exposes the worst-performing query digests along with call counts, mean and total execution time, and rows processed, so you can find the queries actually driving load. Because the API is OpenAPI-specified, you can generate a typed client and wire these signals straight into CI performance gates, regression checks, or custom dashboards instead of eyeballing them in the console.
Faster backups
We’ve updated the wal-g backup and restore configuration to take advantage of more CPU and higher disk throughput on larger server size. With this change, even on the 10+ TB servers backup and restore complete in predictable times. The change may result in daily spikes on CPU usage charts, though the system is configured for PostgreSQL workload to always take priority over backup on system resources.In the future, we plan to replace some of WAL-G's functionality with WAL-RUS, an open source rewrite of WAL-G in Rust, making backups even more resource-efficient.
Expanded extension support
We've expanded the Postgres ecosystem with the new re2 extension for up to 9x faster regular expressions in Postgres, along with continued improvements to pg_clickhouse and pg_stat_ch, making it even easier to combine Postgres and ClickHouse.
pg_re2
This extension duplicates all of the ClickHouse regular expression functions in Postgres, backed by Google’s RE2 regular expression library, just like in ClickHouse. This allows users to get identical regex syntax and matching results on both platforms, with much faster performance than PostgreSQL’s own regex functions. Details in the re2 blog post.
pg_clickhouse
pg_clickhouse provides the “unified query layer” to allow Postgres users to transparently query ClickHouse tables from Postgres. Its first feature is a “foreign data wrapper”, which represents ClickHouse tables similar to views in Postgres, and analyzes queries for optimal execution pushdown to ClickHouse, so they benefit from its analytics query performance. In recent months we’ve integrated it with pg_re2 for transparent pushdown of its functions, implemented pushdown for all compatible aggregate functions, and improved pushdown for subquery joins commonly found in benchmarks such as TPC-H. Details in this recent post** **as well as another release and post next week.
pg_stat_ch
This extension ships query patterns from Postgres to ClickHouse to enable monitoring and query performance analysis. It now exports more quickly using fewer resources thanks to Apache Arrow for batching (#77), and supports sampling (#72) to cut down further on resource footprint (at the cost of missing outliers). For additional runtime safety, we’ve mapped C++ exceptions and signals within the worker process to graceful exits (#86, 87, 88, 93, 94), to avoid disrupting the postmaster. In support of both efforts, we also migrated from the clickhouse-cpp API to a new, lightweight clickhouse-c implementation (#104).
Looking ahead
Our next major platform milestone is bringing ClickHouse Managed Postgres to Google Cloud Platform. Upcoming work also includes managed maintenance and OS updates, broader configuration controls, performance recommendations, continued investment in UX and developer experience, and deeper OpenTelemetry support for integration with existing observability stacks.
On the extensions and data integration front, we are building high-performance COPY support for moving data to and from cloud object stores and file systems through chDB and ClickHouse table functions. We are also advancing initiatives towards a more native replication path into ClickHouse to make analytics faster and more reliable (keep an eye out for this!), alongside intelligent tuning of settings such as autovacuum, shared memory, and connection limits.
Get started with ClickHouse Managed Postgres today
Interested in seeing how ClickHouse Managed Postgres works on your data? Get started with ClickHouse Cloud in minutes and receive $300 in free credits.
Sign up