50.6k
50.6kSummary
- Mercado Libre runs its observability platform, O11y events, on ClickHouse Cloud to answer granular, business-level questions like why a specific payment failed.
- The team built O11y events to take troubleshooting from days to minutes, with full business-flow visibility and high-cardinality filtering on identifiers like payment and user IDs.
- Migrating to ClickHouse Cloud increased query performance by 75x and delivered up to 89% data compression, enabling them to scale from 7 million spans per minute to 400 million and growing in ClickHouse.
Mercado Libre is Latin America’s leading commerce and fintech platform, operating in 18 countries with a regional market share of around 35% (compared to 4% for Amazon). It’s a highly complex environment that spans multiple languages, stacks, regulations, and logistics. The same telemetry that keeps systems running is what the team uses to ship changes, monitor, and improve the experience customers have inside the platform.
At Open House SF 2026, technical leader Daniel Da Rosa and software expert Francislei Reis shared how Mercado Libre rebuilt its observability platform on ClickHouse Cloud on AWS, taking troubleshooting from days to minutes, speeding up queries by 50x, and compressing data by up to 89%.
The need for a new tracing platform
In the first quarter of 2026, Mercado Libre served 126 million unique buyers, delivered 2.7 billion items, and processed $87 billion in payments. The company’s five core business units (commerce, advertising, logistics, acquiring, fintech services) run on the same platform, which also powers Mercado Pago, its payments and banking arm.
All of that runs on the company’s internal developer platform, Fury, which powers more than 35,000 microservices written across Go, Java, Python, JavaScript, native code, and increasingly AI workloads.
Every click, every dollar, every package produces telemetry data. At Mercado Libre’s scale, we support 10,000 deployments and 7,000 pull requests each day, and handle over 15 billion requests per second.
— Daniel Da Rosa, Technical Leader of Observability, Mercado Libre
At Mercado Libre’s scale, a simple-sounding question becomes hard to answer. Why did a certain payment ID fail? Why did a specific user hit an error at checkout? “Maybe for a small business flow with 30 services, we could spend some minutes or hours looking into logs, metrics, and traces,” Daniel says. “But as the architecture grows, it takes longer to solve this kind of problem… we need a complete view of our request.”
They decided tracing was the missing piece in their observability puzzle. Traces could give the team end-to-end visibility of a business flow, with measurable flow health and bottlenecks rather than the health of one service at a time, and let them embed business context directly in the data. With that context, tracing could turn incident response from “service X has an elevated P99” into “this specific payment failed because this specific service timed out,” and lay a foundation for process mining and optimization down the line.
The team set four requirements for the new platform. The first was to reduce troubleshooting from days to minutes. The second was full business-flow visibility, to see the entire flow across services in production. The third was high-cardinality filters (the ability to filter on payment IDs, user IDs, and the many other identifiers the team needs to search by). The fourth was sustainable scale, so the cost of observability wouldn’t be tied to the growth of the business.
The cost of slow observability isn’t only infrastructure, it’s the customer experience.
— Daniel Da Rosa, Technical Leader of Observability, Mercado Libre
The result was a platform the observability team calls O11y events. It samples 100% of traffic for critical applications, so nothing critical is missed, and keeps retention cost-efficient at that volume. It’s built on OpenTelemetry, with business-flow attributes baked into the instrumentation. And as Daniel describes, it was designed from the start for analytics, data governance, and AI, alongside the trend analysis, anomaly detection, and performance monitoring you’d expect from an observability platform at Mercado Libre’s scale.
Outgrowing their previous observability platform
The first version of O11y events followed a standard OpenTelemetry production pattern. Applications sent telemetry through an internal SDK to an OTel collector, into a stream, through a consumer, and into their cloud storage layer, with dashboards and external integrations reading from that storage layer. That design helped the team get to 70 million spans per minute.
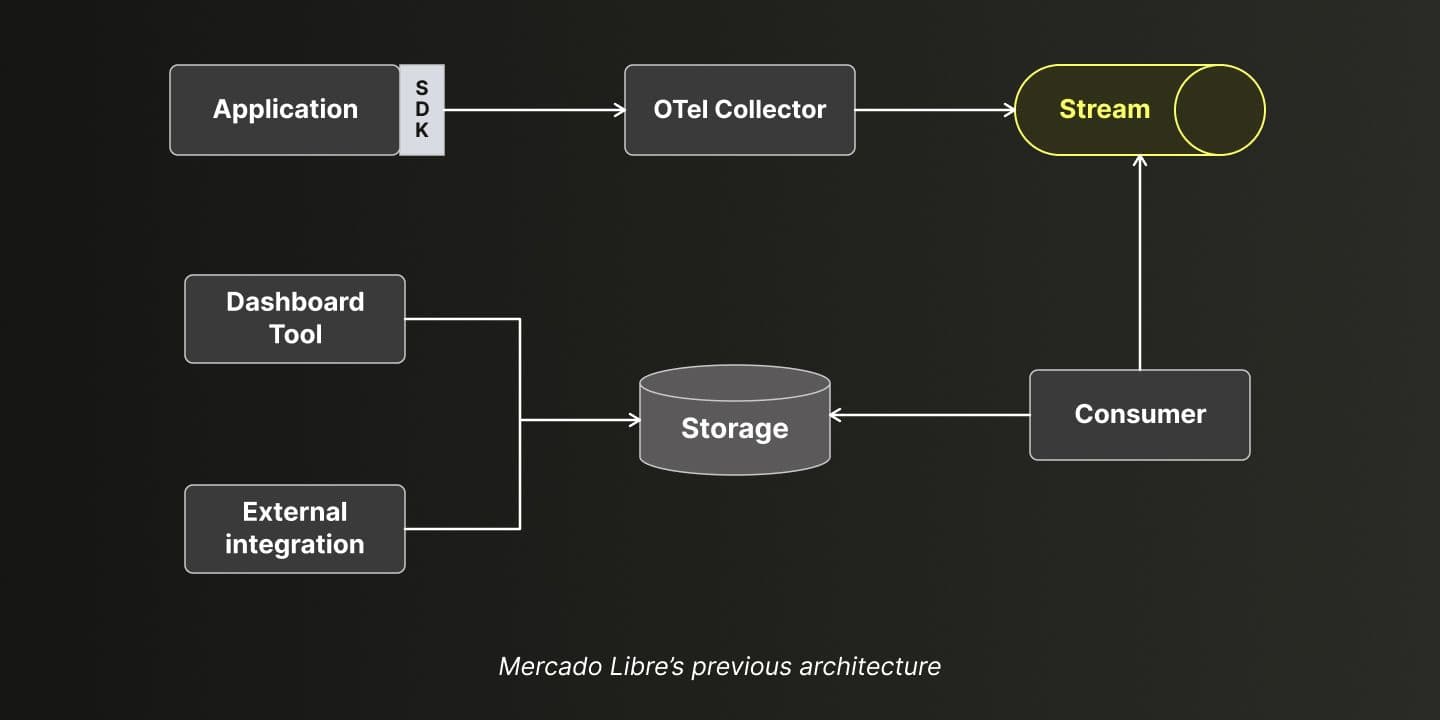
Mercado Libre’s previous architecture
“But when we scaled the application,” Francislei says, “we got a lot of blockers.” The problem, he explains, was that heavy operations like transforming, filtering, and aggregation ran on the client side at query time, against the storage layer.
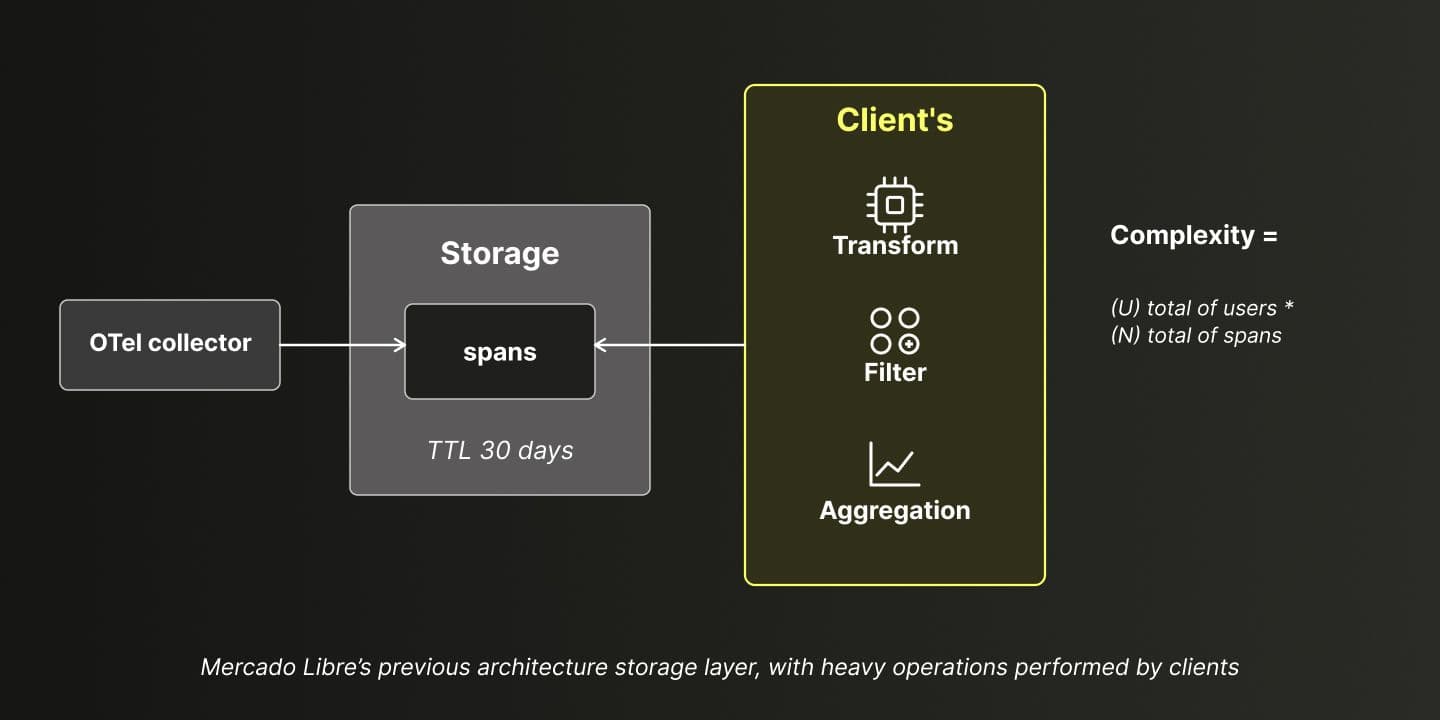
Mercado Libre’s previous architecture storage layer, with heavy operations performed by clients
Queries ran for over five minutes and costs rapidly grew. Indexing new attributes was difficult, data aggregation was expensive, and generating metrics from spans was unfeasible given the high cost. While engineers could fetch spans by any transactional ID, pull aggregated views, and derive metrics from spans, they couldn’t do those things fast or cheaply enough for the platform to meet Mercado Libre’s four requirements. So the team went looking for a new storage layer.
Moving the heavy work inside ClickHouse Cloud
In the next evolution, the team chose ClickHouse Cloud on AWS as the storage layer and kept the rest of the ingestion pipeline intact. Applications, SDK, OpenTelemetry collector, stream, and consumer all stayed where they were. On the read path, the team added a proxy in front of ClickHouse to handle rate limiting and access control, since they were also building an O11y MCP server to expose the data to AI tooling. “Basically, what changed is where the data lands and who does the work,” Francislei says.
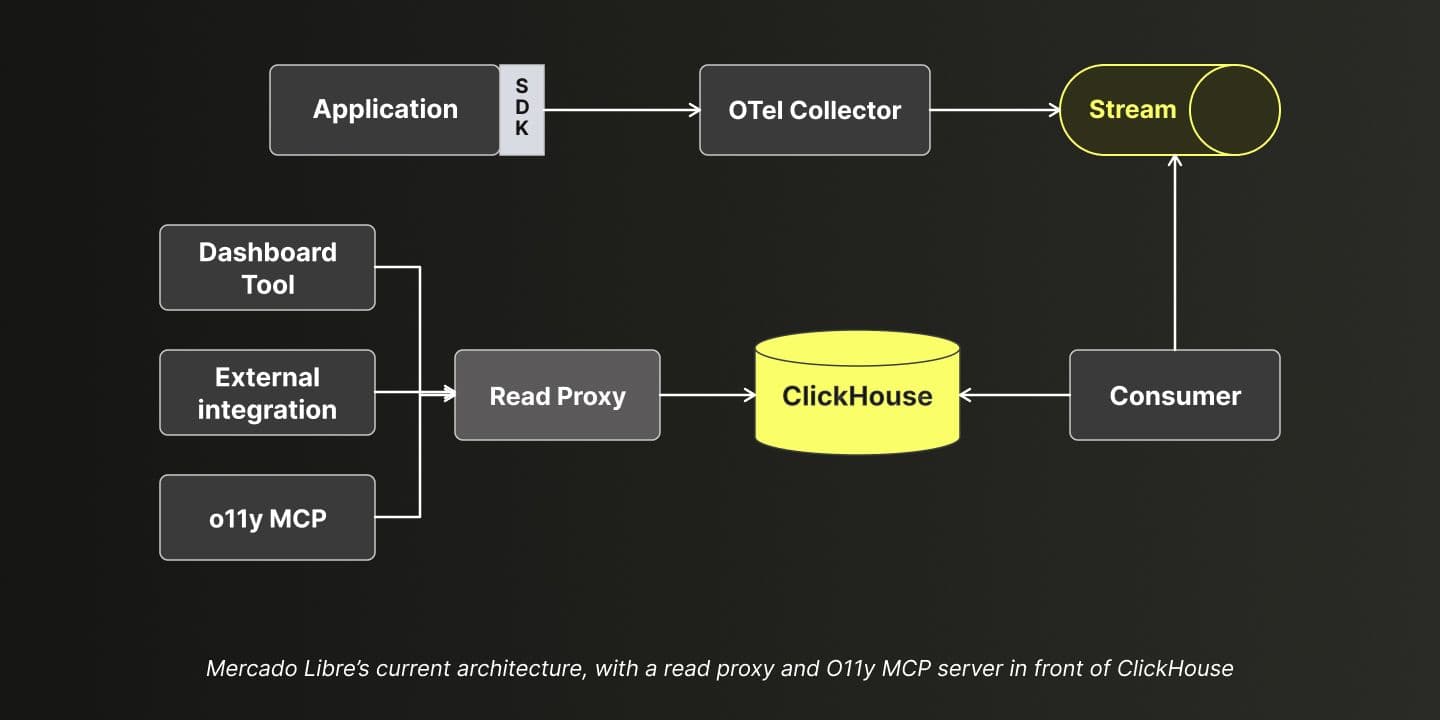
Mercado Libre’s current architecture, with a read proxy and O11y MCP server in front of ClickHouse
In the new setup, the heavy operations moved off the clients and into the database. Transforming, filtering, and aggregation now run inside ClickHouse through materialized views. Where the previous architecture complexity scaled with the total number of users multiplied by the total number of spans, the current architecture scales with the number of users alone.
The storage itself is organized in layers with different retention. Raw data lands first and is kept for a single day. Materialized views read from that raw table and populate the span tables (trace summary, spans, lookup attributes), all retained for 30 days. A separate set of materialized views feeds the metric tables, retained for 90 days, because percentiles become more useful when compared across a longer historical window. Once raw events arrive, Francislei says, “ClickHouse does the rest” through the schema and materialized views.
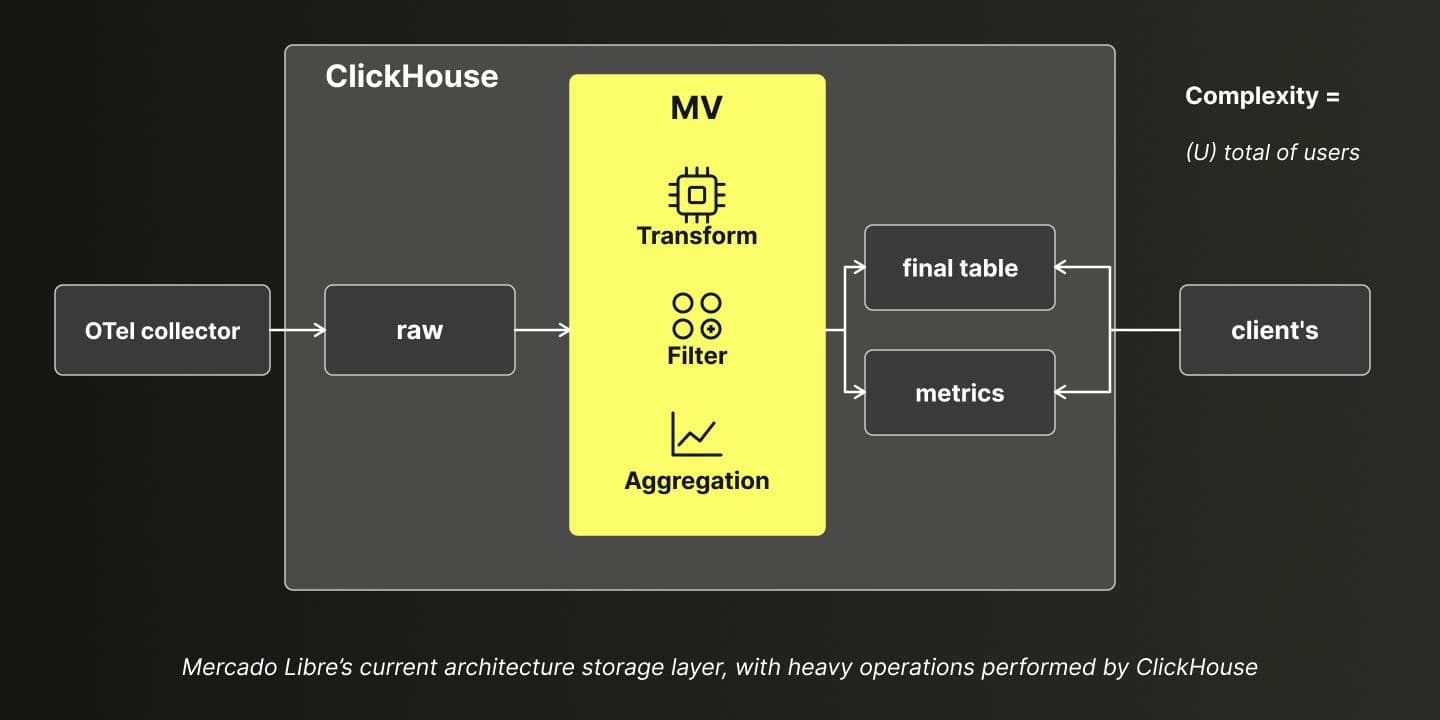
Mercado Libre’s current architecture storage layer, with heavy operations performed by ClickHouse
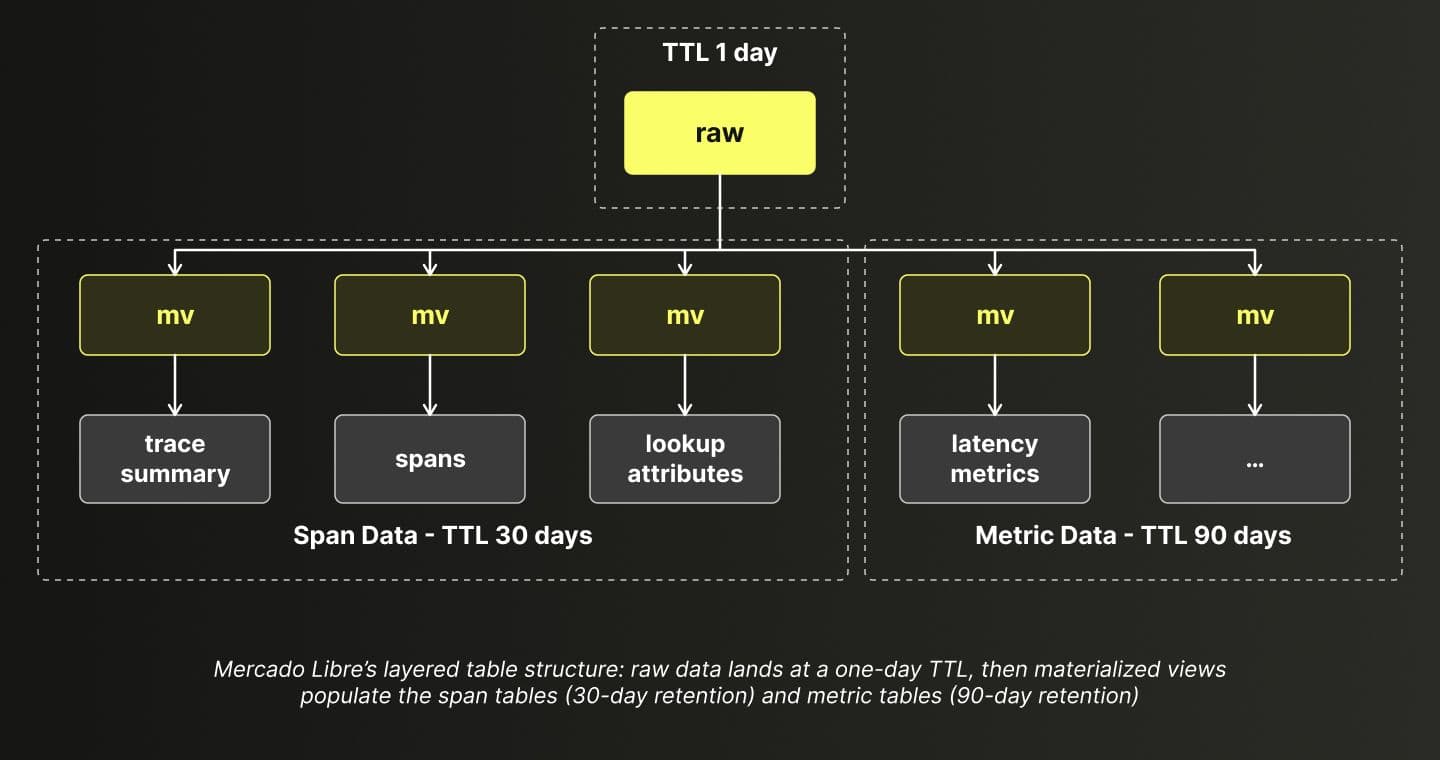
Mercado Libre’s layered table structure: raw data lands at a one-day TTL, then materialized views populate the span tables (30-day retention) and metric tables (90-day retention)
Querying traces at high cardinality
The team’s most difficult problem, Francislei says, was high-cardinality filtering. They solved it with a dedicated lookup table rather than asking one schema to do everything.
The lookup table, span_events_attributes, uses ClickHouse’s ReplacingMergeTree engine. The design lives in its ORDER BY clause, which leads with the attribute key, then timestamp buckets at hour and minute granularity, then the attribute value, then the trace ID. A Bloom filter sits on the attribute value as a skip index. Together these let the table return results in around five seconds regardless of the range or the parameter being filtered.
Querying a trace then becomes a two-step operation. The query first filters on a high-cardinality attribute (a session ID or product ID, for example) against the lookup table, then resolves the matching traces by trace ID and timestamp against the trace summary table, which is built on AggregatingMergeTree.
The schema choices that made this work generalize into a handful of key points. Primary keys should be query-oriented and favor low-cardinality columns. Compression uses ZSTD, which the team found effective. A Bloom filter skip index handles high-cardinality attributes cheaply. AggregatingMergeTree, materialized views, and aggregate functions serve as the analytics engine. And the clusters are segmented into separate services for reading, writing, and merging, rather than running everything on one.
75x faster queries at petabyte scale
Comparing Mercado Libre’s previous setup to their current one on ClickHouse Cloud, the difference is clear. Queries that used to run for over five minutes now return in about four seconds, a 75x speedup. High-cardinality attributes are now efficiently indexed, materialized views arrive pre-aggregated, and engineers can filter on those attributes directly.
The data volumes Francislei shared give a sense of the scale ClickHouse is absorbing. The spans table holds 9.55 trillion rows, compressing 4.34 PiB down to about 621 TiB, an 86% reduction. The lookup attributes table holds 4.9 trillion rows, and the trace summary holds 870 billion. The raw table compresses 181 TiB down to about 20 TiB, an 89% reduction.
And those numbers represent only part of the picture. To date, the team has migrated around 30% of its critical applications to ClickHouse Cloud, and that 30% already produces 400 million spans per minute. Logs and metrics are still to come.
Six lessons from the migration
Daniel shared six lessons from their migration to ClickHouse Cloud. The first is to profile and benchmark first under real conditions rather than in a development environment. “We need to benchmark the same workload under the same conditions to produce real results,” he says.
The second is that index design is iterative. “Primary keys are one of the most important choices in the schema,” Daniel says, noting that the team expects to revisit them, and that they test every skip index before trusting it.
The third lesson is to monitor clusters relentlessly, using the metrics and logs in ClickHouse system tables and the metrics exposed over its HTTP API to drive alerting. The fourth is to tune for your own volume. “Batch size is not a simple setting,” Daniel says, “but it is critical.” The team tuned batching and async insert behavior together to avoid creating too many parts.
The fifth lesson is to segment storage and compute. The team began with a single cluster for reads, writes, and merges, hit problems with too many parts, and moved to dedicated clusters, including a merge cluster with around 50 threads to make better use of CPU. They sized those clusters by mirroring production traffic into a test environment, then scaled vertically before scaling horizontally, following ClickHouse’s recommendation.
The sixth lesson is that schema and query are as important as hardware. “I will keep saying that until somebody hands me a microphone for a different talk,” Daniel says with a smile.
What’s next for observability at Mercado Libre
Looking ahead, the team is exploring an observability backend for their AI telemetry, using Langfuse, the open-source LLM observability and evals platform acquired by ClickHouse in 2026. “Our agents are increasing, and we need to understand what’s happening inside these communications,” Daniel says.
They’re also adding a new layer of intelligence for proactive insights that correlates events like deploys with tracing data, implementing text indexes (also known as inverted indexes), and working to allow filtering and aggregation by any attribute in the span attributes map.
Finally, they’re exploring semantic queries using vector search, so an engineer could ask to see traces that look like a given incident. “The future of observability is not a dashboard conversation,” Daniel says. “The database must be ready for that.”
Get started today
Interested in seeing how ClickHouse works on your data? Get started with ClickHouse Cloud in minutes and receive $300 in free credits.
Sign up