Introduction #
Almost one year ago, we blogged about the state of SQL-based observability, exploring two parallel backgrounds of two established paradigms: SQL and observability. We explained how they had collided and together created a new array of opportunities in the field of observability while attempting to answer "When is SQL-based observability applicable to my use case?" This blog post garnered significant attention and has proved useful in discussing ClickHouse and its role within the observability space to new users.
Although the general themes of the original blog post remain true, a year is a long time in ClickHouse development! As well as multiple new features which we believe will further move ClickHouse to the position as the de-facto database for observability data, the eco-system surrounding ClickHouse has matured, simplifying the adoption for new users.
In this post, we'll explore some of these new features as well as give a glimpse into some experimental work which we hope will form the basis for ClickHouse's use in the less explored pillar of metrics within observability.
The state of SQL-based observability in 2023 #
Our original post proposed that observability is just another data problem, to which SQL and OLAP based systems, such as ClickHouse, are well suited to addressing. We explored the history of centralized logging, and how solutions such as Splunk and the ELK stack had emerged from the both syslog and NoSQL era. Despite the popularization of the former, SQL’s unique strengths have sustained its relevance, making it the third most widely adopted language for structured data management, even amidst the NoSQL boom.
By rethinking observability as a data problem, we can apply OLAP principles and SQL to the storage layer, avoiding the need for cost-saving measures like aggressive log sampling that ultimately undermine visibility. This approach brings key benefits: efficient compression reduces storage demands, accelerated data ingestion and retrieval, and limitless storage enabled by the use of object storage. The versatility of SQL-based observability is amplified by interoperability, with ClickHouse, for instance, supporting a broad range of data formats and integration engines, simplifying its inclusion in diverse observability pipelines. SQL’s extensive functions offer unmatched analytical expressivity, and together, these features lower the total cost of ownership (TCO) of observability data.
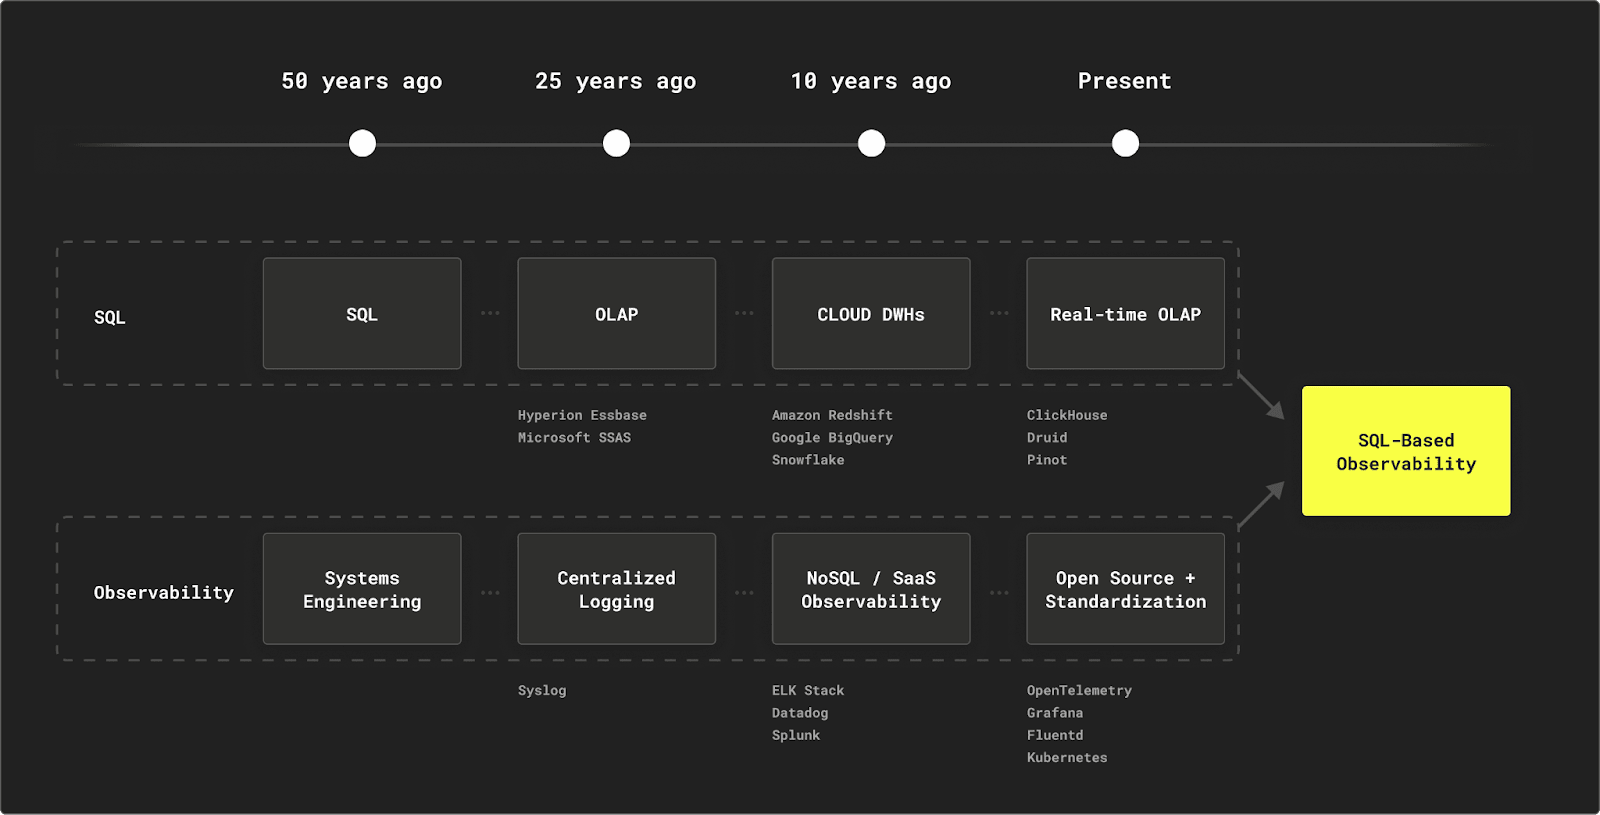
An important enabler of this shift has been OpenTelemetry, which standardized data collection across platforms and has turned data collection from a differentiator into a commodity. A year on we can confidently say OTel is well on its way to winning the "collector wars."
This industry-wide adoption has reduced vendor lock-in and made it easier to integrate observability data with SQL-based storage solutions.

We concluded that the resulting SQL-based observability stack is simple and not opinionated, leaving many options for the users to personalize, adapt, and integrate within an existing IT environment.
With this in mind, and in the interest of ensuring our users are successful, we provided a simple checklist to help users determine if SQL-based observability was them. Specifically,
SQL-based observability is for you if:
- You or your team(s) are familiar with SQL (or want to learn it)
- You prefer adhering to open standards like OpenTelemetry to avoid lock-in and achieve extensibility.
- You are willing to run an ecosystem fueled by open-source innovation from collection to storage and visualization.
- You envision some growth to medium or large volumes of observability data under management (or even very large volumes)
- You want to be in control of the TCO (total cost of ownership) and break free from rising observability costs common with legacy, seat-based platforms.
- You can’t or don’t want to get stuck with small data retention periods for your observability data just to manage the costs.
SQL-based observability may not be for you if:
- Learning (or generating!) SQL is not appealing to you or your team(s).
- You are looking for a packaged, end-to-end observability experience.
- Your observability data volumes are too small to make any significant difference (e.g. <150 GiB) and are not forecasted to grow.
- Your use case is metrics-heavy and needs PromQL. In that case, you can still use ClickHouse for logs and tracing beside Prometheus for metrics, unifying it at the presentation layer with Grafana.
- You prefer to wait for the ecosystem to mature more and SQL-based observability to get more turnkey.
The question, as 2024 draws to a close, is: has this changed given the developments in ClickHouse?
JSON support! A game changer for observability? #
Before discussing the recent developments in JSON support, it's important to outline both what we mean by JSON support, why it's important for observability, and the challenges our users currently face.
What do we mean by JSON support? #
ClickHouse has long supported JSON as both an input and output format, which paved the way for its early integration into observability tools. JSON data can be sent over ClickHouse’s native and HTTP interfaces, with a variety of output formats to fit specific needs. This flexibility made it straightforward to integrate with tools like OpenTelemetry and Grafana, enabling smooth data ingestion and visualization. Furthermore, it allowed users to build custom interfaces easily, making ClickHouse adaptable to many observability use cases.

However, JSON integration differs from full support for JSON as a column type — an increasingly important feature in observability. By this, we mean the ability to designate a column as JSON, which can store nested dynamic structures whose values have potentially different data types (possibly incompatible and unknown beforehand) for the same paths.

Why is JSON support important? #
Users deploying observability solutions need the ability to just "send events" without having to worry about schema refinement or optimizations. Even when time can be spent defining schemas, centralized observability systems commonly aggregate data from diverse sources, each with unique or evolving data structures. This data might come from different applications, teams, or even entirely separate organizations, especially within SaaS solutions. In these scenarios, a universal naming convention or schema for all data is challenging to achieve.
While structured logging and OpenTelemetry schema standards and semantic conventions help address this issue, users still need to capture arbitrary tags and fields. These fields can vary significantly in quantity, type, and level of nesting depending on the source. To address this, a column dedicated to "unstructured JSON" data is invaluable, enabling flexible storage of dynamic attributes such as Kubernetes labels or custom application-specific metadata.
Ideally, ClickHouse would support a JSON column type, enabling users to send semi-structured data directly. This approach would offer the same capabilities, compression, and performance as traditional data types while reducing the effort required for schema management and definition.
Challenges of current approaches #
Currently, the OTel exporter for ClickHouse provides default schemas for logs, traces, and metrics. As shown in the logs schema below, these largely depend on traditional classic types such as DateTime and String (along with optimizations like LowCardinality and codecs):
1CREATE TABLE otel.otel_log (
2	Timestamp DateTime64(9) CODEC(Delta(8), ZSTD(1)),
3	TimestampTime DateTime DEFAULT toDateTime(Timestamp),
4	TraceId String CODEC(ZSTD(1)),
5	SpanId String CODEC(ZSTD(1)),
6	TraceFlags UInt8,
7	SeverityText LowCardinality(String) CODEC(ZSTD(1)),
8	SeverityNumber UInt8,
9	ServiceName LowCardinality(String) CODEC(ZSTD(1)),
10	Body String CODEC(ZSTD(1)),
11	ResourceSchemaUrl LowCardinality(String) CODEC(ZSTD(1)),
12	ResourceAttributes Map(LowCardinality(String), String) CODEC(ZSTD(1)),
13	ScopeSchemaUrl LowCardinality(String) CODEC(ZSTD(1)),
14	ScopeName String CODEC(ZSTD(1)),
15	ScopeVersion LowCardinality(String) CODEC(ZSTD(1)),
16	ScopeAttributes Map(LowCardinality(String), String) CODEC(ZSTD(1)),
17	LogAttributes Map(LowCardinality(String), String) CODEC(ZSTD(1)),
18       --indexes omitted
19) ENGINE = MergeTree
20PARTITION BY toDate(TimestampTime)
21PRIMARY KEY (ServiceName, TimestampTime)
22ORDER BY (ServiceName, TimestampTime, Timestamp)
However, note how the Map type is used for the columns LogAttributes, ResourceAttributes, and ScopeAttributes. These columns in OpenTelemetry capture metadata at different levels: LogAttributes hold details specific to individual log events, ResourceAttributes contain information about the source generating the data, and ScopeAttributes store context about the application code or instrumentation. Together, these attributes provide essential context for filtering and grouping. Importantly, they are entirely use-case dependent and can vary significantly based on the source and application, as well as potentially changing over time.
While the Map type allowed users to store these fields by supporting dynamic addition of keys, it incurs some significant disadvantages:
- Loss of type precision - Field name and values in this representation are held as Strings, with the Map only supporting a single type as the value (users can now use Variant as the value to the Map). The String type is applied here as the "unified" type. This meant more complex comparisons on values that were numeric required a query time cast. This is both more verbose and inefficient, impacting query latency and memory overhead of a query.
- Single-column implementation with linear complexity - All of the nested JSON paths are held in a single-column value. When accessing a specific known key in the Map, ClickHouse is required to load all values in the Map and linearly scan. This incurs a significant IO overhead, which is effectively wasted when only a single path is being read, making queries on maps with large numbers of keys inefficient and slower than users expect. To address this, users would extract values from the Map using materialized columns at insert time.
- Obfuscation of available keys - By storing the JSON paths as map keys, the user is unable to identify the available paths for querying without a query. While possible, this requires an expensive linear scan in order to identify all available keys. While this can be addressed with materialized views to compute this set at insert time, it adds additional complexity and requires UI tooling to integrate with the output in order to provide useful query guidance features.
- Lack of support for nested structures - Using a String as the Map value type limits it to one level only. Other types in ClickHouse, such as Tuple and Nested, supported nested structures but these required specification of the structure in advance of receiving the data.
The new JSON type addresses all of these challenges, providing an efficient means of supporting dynamically nested structures while retaining precision and the performance associated with statically typed columns.
Efficient JSON support #
When our original blog post was published, ClickHouse’s JSON support was in its infancy. The feature had existed as experimental for some time but had significant challenges. Most of these arose from both its inability to handle high numbers of JSON paths efficiently but also its attempt to handle different types for the same path by dynamically unifying their types. This turned out to be a fundamental design flaw, requiring us to rewrite the feature from the ground up. In 24.8, we announced that this rewrite was largely complete and was on the path to being beta with a high degree of confidence its implementation was as good as theoretically possible.
As we detailed in a recent blog, this new JSON implementation in ClickHouse is purpose-built to address the unique challenges of handling JSON in a columnar database while avoiding the pitfalls of type unification or enforcement, which can distort data or make querying more challenging.
Many other data stores aim to address these challenges by inferring the type from the first event in which a path is encountered - an approach our original JSON implementation adopted. Future events with different types for a path are either coerced or rejected. This is sub-optimal for observability as rarely events can be guaranteed to be clean and consistent. The result is either poor query performance or a reduced set of operators exposed to the user unless query-time casting is performed.
As shown below, ClickHouse stores the values of each unique JSON path in a true columnar format, even supporting cases where paths have different types. This is accomplished by creating a separate sub-column for each unique path and type pair.
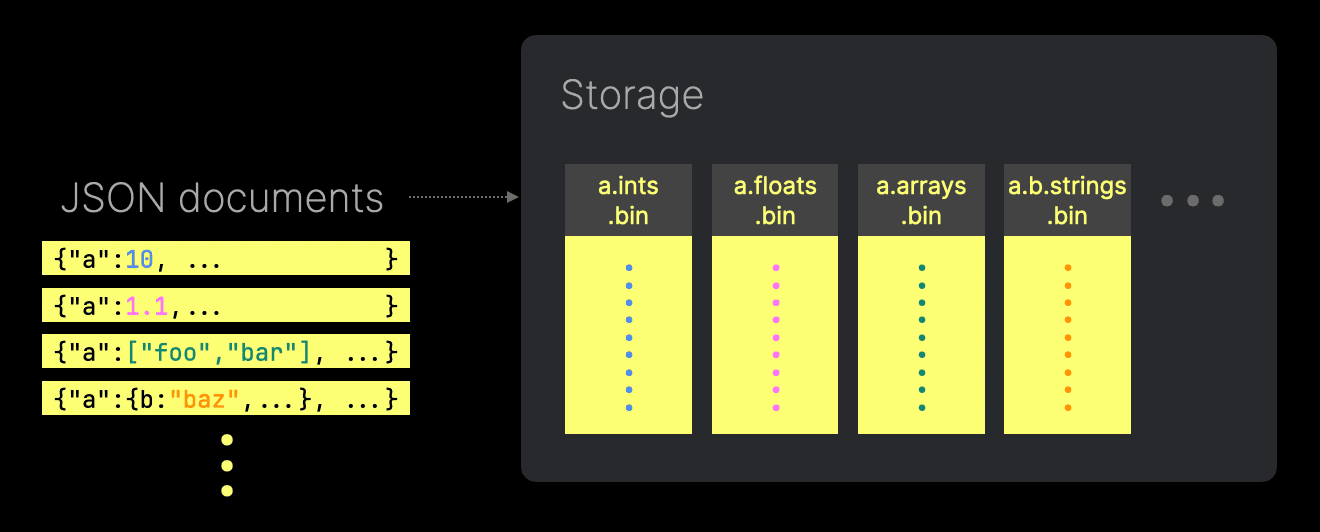
For example, when two JSON paths are inserted with differing types, ClickHouse stores the values of each concrete type in distinct sub-columns. These sub-columns can be accessed independently, minimizing unnecessary I/O. Note that when querying a column with multiple types, its values are still returned as a single columnar response.
Additionally, by leveraging offsets, ClickHouse ensures that these sub-columns remain dense, with no default values stored for absent JSON paths. This approach maximizes compression and further reduces I/O.
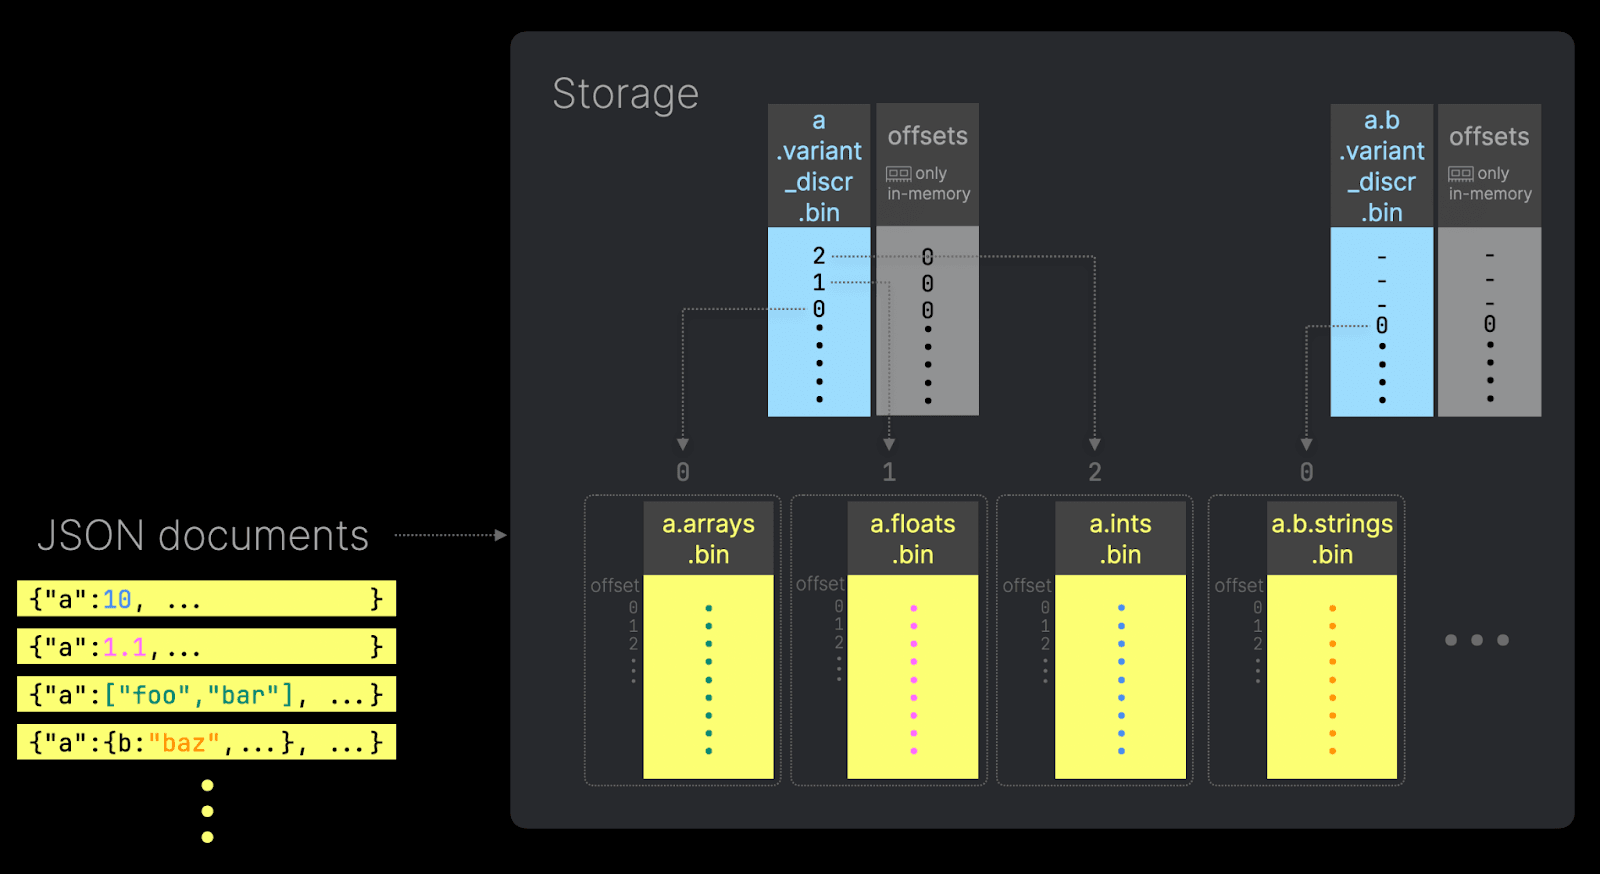
By capturing each unique JSON path as a distinct sub-column, ClickHouse can also efficiently provide a list of available paths, enabling UIs to leverage features like auto-complete.
Furthermore, the type does not suffer from sub-column explosion issues resulting from a higher number of unique JSON paths. Note that this doesn’t prevent storage of these paths; rather, it simply stores new paths in a single shared data column if limits are exceeded (with statistics to accelerate queries).
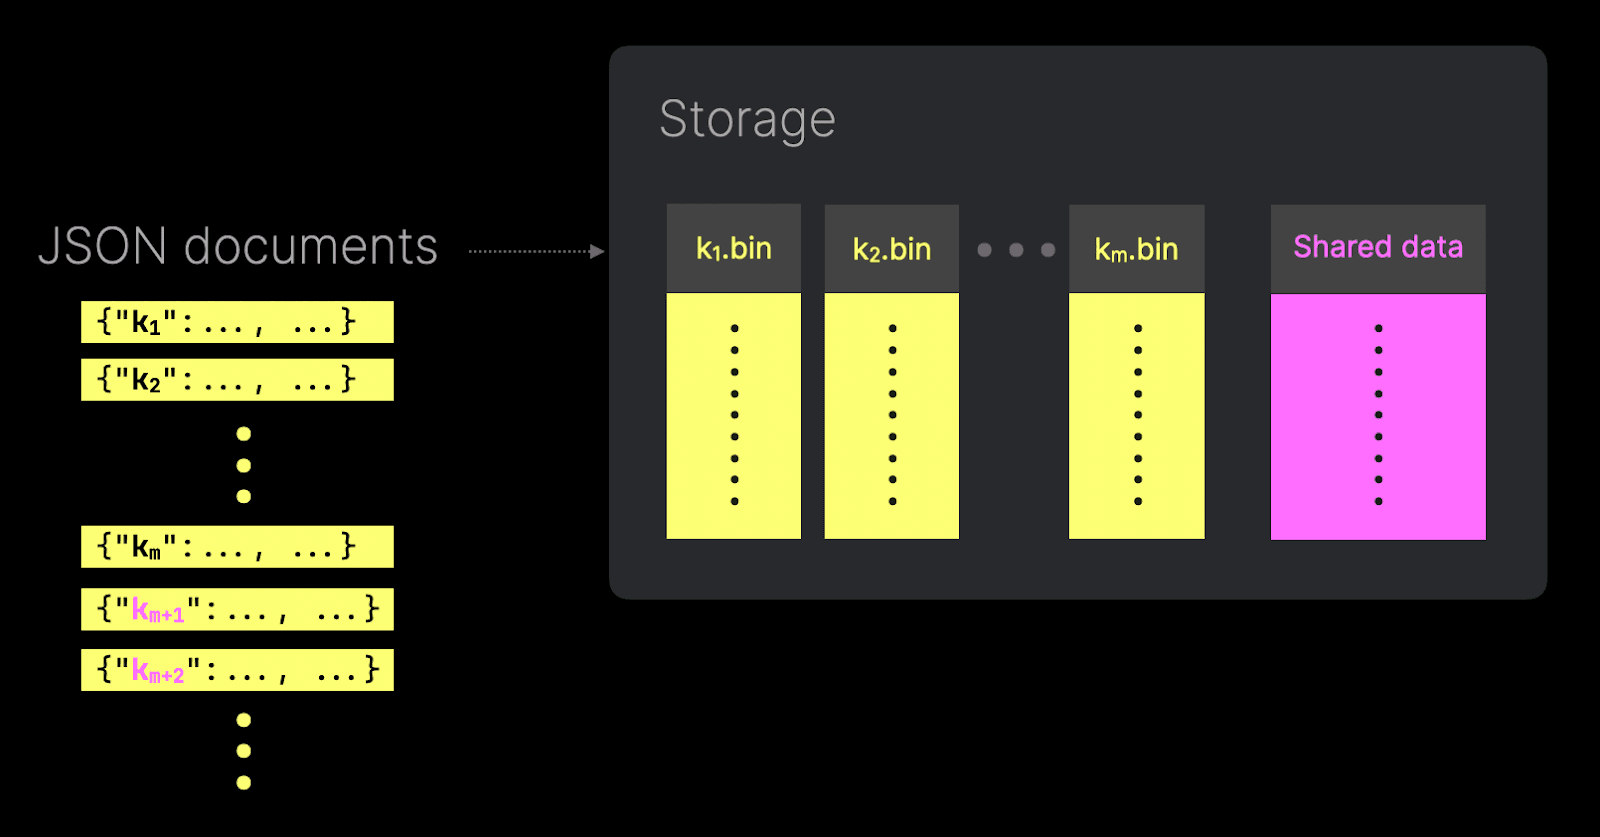
With this enhanced JSON data type, users benefit from scalable, high-performance analytics on complex, nested JSON structures - making ClickHouse’s JSON support as efficient and fast as any classic data type in its system.
For users curious about the implementation of this new column type, we recommend reading our detailed blog post here.
JSON for OTel #
We expect this feature to be exposed in the OpenTelemetry schema for ClickHouse. For example, consider the logs schema below applying the JSON type for our unstructured columns (omitting configuration for the JSON type):
1CREATE TABLE otel_log (
2	Timestamp DateTime64(9) CODEC(Delta(8), ZSTD(1)),
3	TimestampTime DateTime DEFAULT toDateTime(Timestamp),
4	TraceId String CODEC(ZSTD(1)),
5	SpanId String CODEC(ZSTD(1)),
6	TraceFlags UInt8,
7	SeverityText LowCardinality(String) CODEC(ZSTD(1)),
8	SeverityNumber UInt8,
9	ServiceName LowCardinality(String) CODEC(ZSTD(1)),
10	Body String CODEC(ZSTD(1)),
11	ResourceSchemaUrl LowCardinality(String) CODEC(ZSTD(1)),
12	ResourceAttributes JSON,
13	ScopeSchemaUrl LowCardinality(String) CODEC(ZSTD(1)),
14	ScopeName String CODEC(ZSTD(1)),
15	ScopeVersion LowCardinality(String) CODEC(ZSTD(1)),
16	ScopeAttributes JSON,
17	LogAttributes JSON,
18       --indexes omitted
19) ENGINE = MergeTree
20PARTITION BY toDate(TimestampTime)
21PRIMARY KEY (ServiceName, TimestampTime)
22ORDER BY (ServiceName, TimestampTime, Timestamp)
All of this means users will be able to send arbitrary data in these above OTel columns, knowing they will be efficiently stored and easily queried.
Note we still recommend adhering to the broader OTel schema, where columns exist on the root vs just using a single JSON column! These more explicit columns benefit from wider ClickHouse features, such as supporting codecs and secondary indices. It thus may still make sense to extract commonly queried columns to the root.
Example #
Consider a structured logs dataset.
1{"remote_addr":"40.77.167.129","remote_user":"-","run_time":0,"time_local":"2019-01-22 00:26:17.000","request_type":"GET","request_path":"\/image\/14925\/productModel\/100x100","request_protocol":"HTTP\/1.1","status":"500","size":1696.22,"referer":"-","user_agent":"Mozilla\/5.0 (compatible; bingbot\/2.0; +http:\/\/www.bing.com\/bingbot.htm)","response_time":23.2}
2{"remote_addr":"91.99.72.15","remote_user":"-","run_time":"0","time_local":"2019-01-22 00:26:17.000","request_type":"GET","request_path":"\/product\/31893\/62100\/----PR257AT","request_protocol":"HTTP\/1.1","status":200,"size":"41483","referer":"-","user_agent":"Mozilla\/5.0 (Windows NT 6.2; Win64; x64; rv:16.0)Gecko\/16.0 Firefox\/16.0","response_time":""}
While largely well structured, there are differences in types used for columns here - status, response_time, size, and run_time are both numeric and String. Ingesting this sample from file, using a OTel collector configuration, would result in the following:
1SELECT
2	Timestamp,
3	LogAttributes
4FROM otel_logs
5FORMAT Vertical
6
7Row 1:
8──────
9Timestamp: 	2019-01-22 00:26:17.000000000
10LogAttributes: {'response_time':'23.2','remote_addr':'40.77.167.129','remote_user':'-','request_path':'/image/14925/productModel/100x100','size':'1696.22','request_type':'GET','run_time':'0','referer':'-','user_agent':'Mozilla/5.0 (compatible; bingbot/2.0; +http://www.bing.com/bingbot.htm)','time_local':'2019-01-22 00:26:17.000','request_protocol':'HTTP/1.1','status':'500','log.file.name':'simple.log'}
11
12Row 2:
13──────
14Timestamp: 	2019-01-22 00:26:17.000000000
15LogAttributes: {'request_protocol':'HTTP/1.1','status':'200','user_agent':'Mozilla/5.0 (Windows NT 6.2; Win64; x64; rv:16.0)Gecko/16.0 Firefox/16.0','size':'41483','run_time':'0','remote_addr':'91.99.72.15','request_type':'GET','referer':'-','log.file.name':'simple.log','remote_user':'-','time_local':'2019-01-22 00:26:17.000','response_time':'','request_path':'/product/31893/62100/----PR257AT'}
16
172 rows in set. Elapsed: 0.003 sec.
The OTel collector has placed our columns inside our LogAttributes, resulting in all column values being mapped to a String. Even simple queries, as a result, become syntactically complex e.g.
1SELECT LogAttributes['status'] AS status,
2	max(if((LogAttributes['response_time']) != '',
3	  LogAttributes['response_time']::Float32, 0)) AS max
4FROM otel_logs
5GROUP BY status
6
7┌─status─┬──max─┐
8│ 500	│ 23.2 │
9│ 200	│	0 │
10└────────┴──────┘
11
122 rows in set. Elapsed: 0.016 sec.
If this same data is inserted with the OTel schema using the JSON type for our LogAttributes column, we can see the types are preserved.
1SELECT
2	Timestamp,
3	LogAttributes
4FROM otel_logs
5FORMAT Vertical
6SETTINGS output_format_json_quote_64bit_integers = 0
7
8Row 1:
9──────
10Timestamp: 	2019-01-22 00:26:17.000000000
11LogAttributes: {"referer":"-","remote_addr":"91.99.72.15","remote_user":"-","request_path":"\/product\/31893\/62100\/----PR257AT","request_protocol":"HTTP\/1.1","request_type":"GET","response_time":"","run_time":"0","size":"41483","status":200,"time_local":"2019-01-22 00:26:17.000000000","user_agent":"Mozilla\/5.0 (Windows NT 6.2; Win64; x64; rv:16.0)Gecko\/16.0 Firefox\/16.0"}
12
13Row 2:
14──────
15Timestamp: 	2019-01-22 00:26:17.000000000
16LogAttributes: {"referer":"-","remote_addr":"40.77.167.129","remote_user":"-","request_path":"\/image\/14925\/productModel\/100x100","request_protocol":"HTTP\/1.1","request_type":"GET","response_time":23.2,"run_time":0,"size":1696.22,"status":"500","time_local":"2019-01-22 00:26:17.000000000","user_agent":"Mozilla\/5.0 (compatible; bingbot\/2.0; +http:\/\/www.bing.com\/bingbot.htm)"}
17
182 rows in set. Elapsed: 0.012 sec.
By default, 64-bit integers are quoted in output (for Javascript). We disable this for example purposes here with the setting
output_format_json_quote_64bit_integers=0.
Our previous query is now more natural and respects the type differences of the data:
  1SELECT LogAttributes.status as status, max(LogAttributes.response_time.:Float64) as max FROM otel_logs GROUP BY status
2
3┌─status─┬──max─┐
4│ 200	│ ᴺᵁᴸᴸ │
5│ 500	│ 23.2 │
6└────────┴──────┘
7
82 rows in set. Elapsed: 0.006 sec.
As well as explicitly accessing the Float64 variant of the response_time column, we have a slight difference in the response here as our empty value is treated as Null not 0. Finally, we can see the presence of multiple types for the column using the distinctJSONPathsAndTypes function.
1SELECT distinctJSONPathsAndTypes(LogAttributes)
2FROM otel_logs
3FORMAT Vertical
4
5Row 1:
6──────
7distinctJSONPathsAndTypes(LogAttributes): {'referer':['String'],'remote_addr':['String'],'remote_user':['String'],'request_path':['String'],'request_protocol':['String'],'request_type':['String'],'response_time':['Float64','String'],'run_time':['Int64','String'],'size':['Float64','String'],'status':['Int64','String'],'time_local':['DateTime64(9)'],'user_agent':['String']}
8
91 row in set. Elapsed: 0.008 sec.
Increasing maturity of the observability ecosystem #
While the development of the JSON feature in core ClickHouse will simplify adoption and speed up queries, we’ve also continued to invest in the wider Observability ecosystem. This has focused on two efforts: support for ClickHouse in the Open Telemetry Collector and enhancement of the Grafana plugin for ClickHouse.
OpenTelemetry #
In OpenTelemetry, we have focused on the challenge of designing an open-source schema for ClickHouse, which balances versatility with performance. Observability data can vary widely in structure and purpose, and optimizing schemas for ClickHouse requires consideration of the specific use case. We have invested effort in providing default schemas for the OpenTelemetry Collector which are optimized for getting started with a "one size fits most" approach.
It's more important to emphasize these schemas are intended as starting points rather than production implementations. Users with unique needs, such as specific filtering by service or Kubernetes pod names, are encouraged to customize their schemas for optimal performance. To enable this flexibility, the exporter allows users to create custom tables that fit their data requirements without modifying the exporter code itself. Additionally, materialized views can be used to adapt the default schema to support custom attributes, providing tailored table structures that better serve specific query patterns.
With more confidence in our "getting started" schemas, the ClickHouse exporter for logs and traces is now beta. This level of maturity is now consistent with other exporters such as Elasticsearch and Datadog.
Grafana #
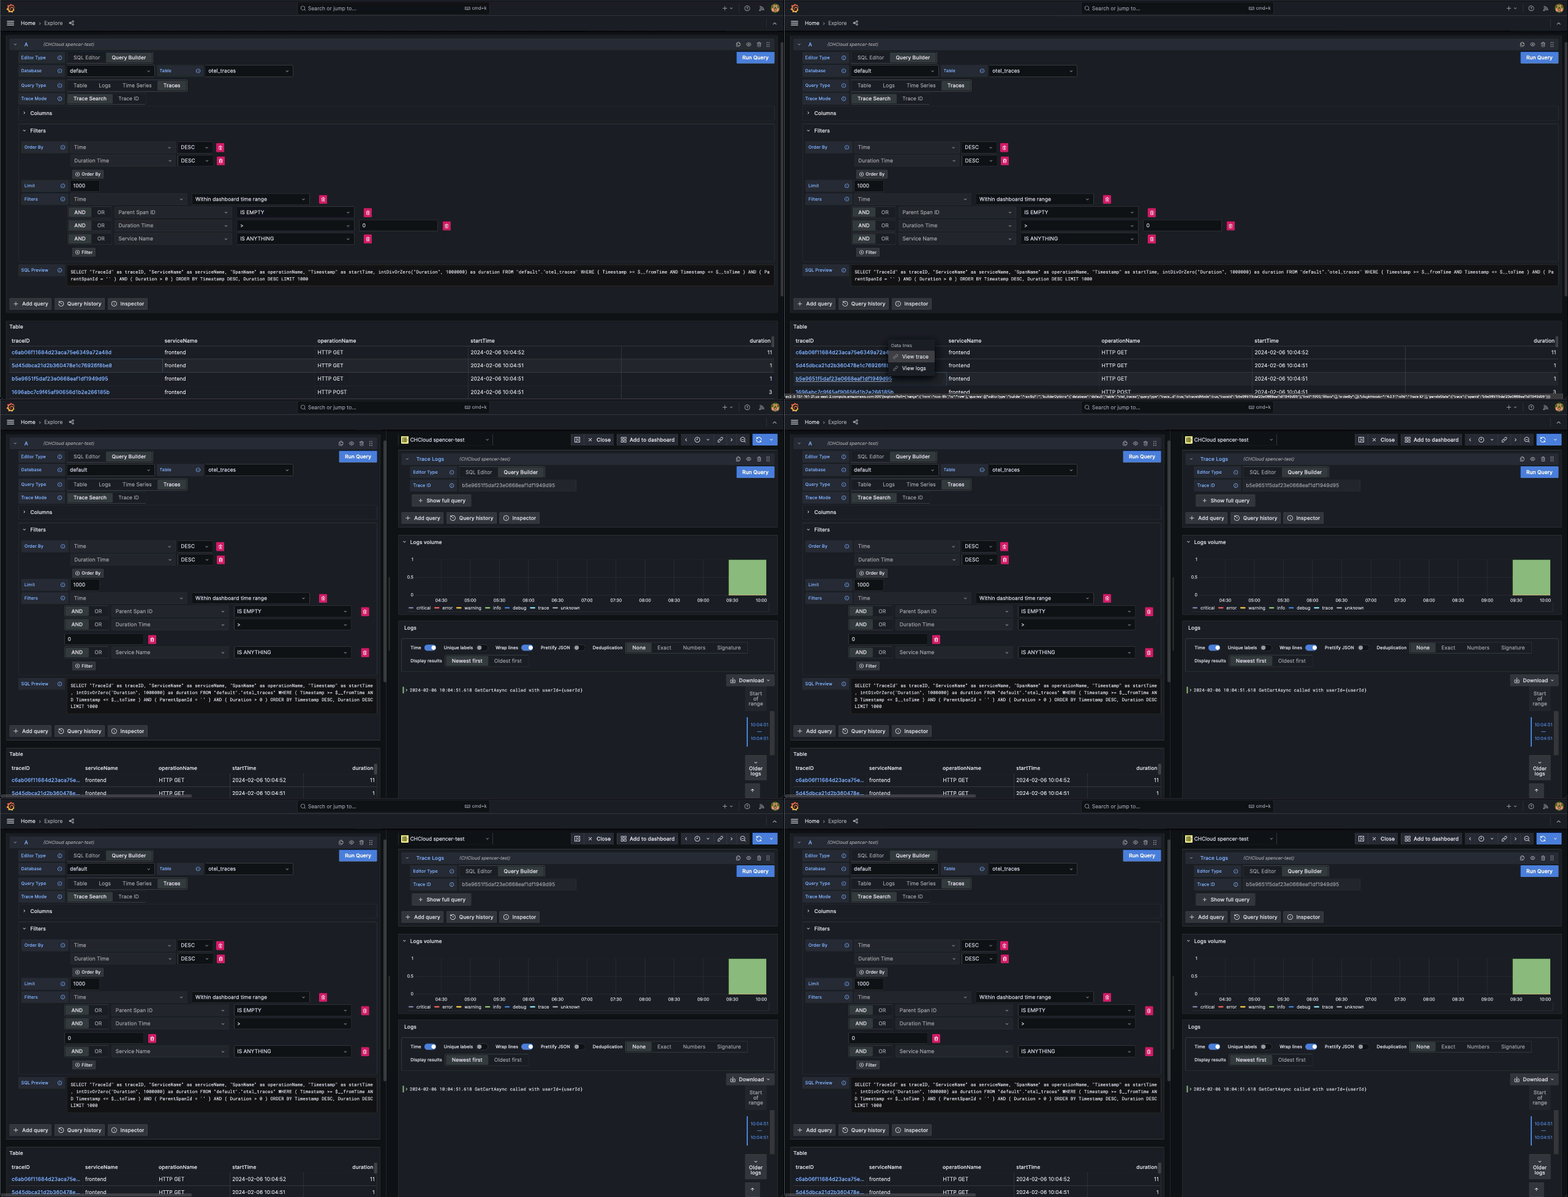
Since the initial release of the ClickHouse plugin for Grafana in May 2022, both platforms have matured significantly. In a blog post earlier in the year, we recognized the challenges of using SQL in observability for new users. In response, the release of version 4 introduced a new query builder experience where logs and traces are treated as first-class citizens. This reimagined interface reduces the need for manual SQL writing, making SQL-based observability more accessible for SREs and engineers.
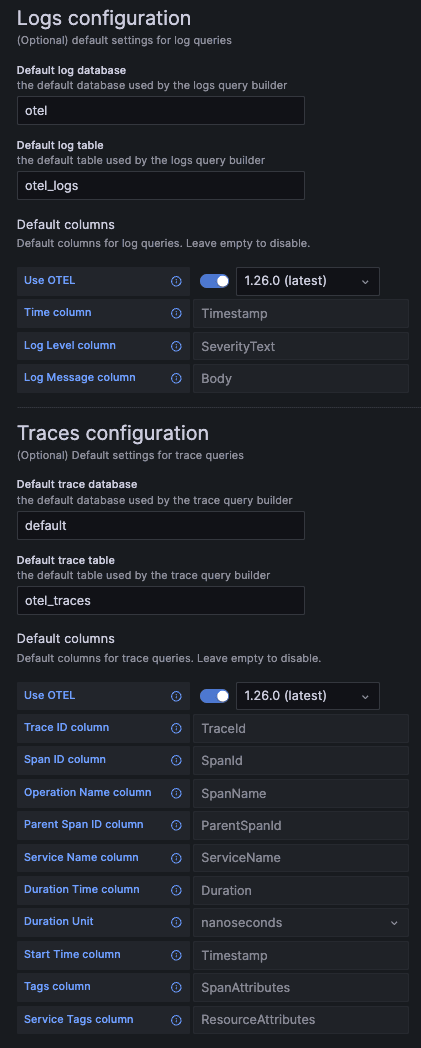
Additionally, version 4.0 emphasizes OpenTelemetry, allowing users to specify logs and trace configurations that align with OTel standards. With this shift, the new plugin offers a more streamlined, intuitive experience for Otel adopters.
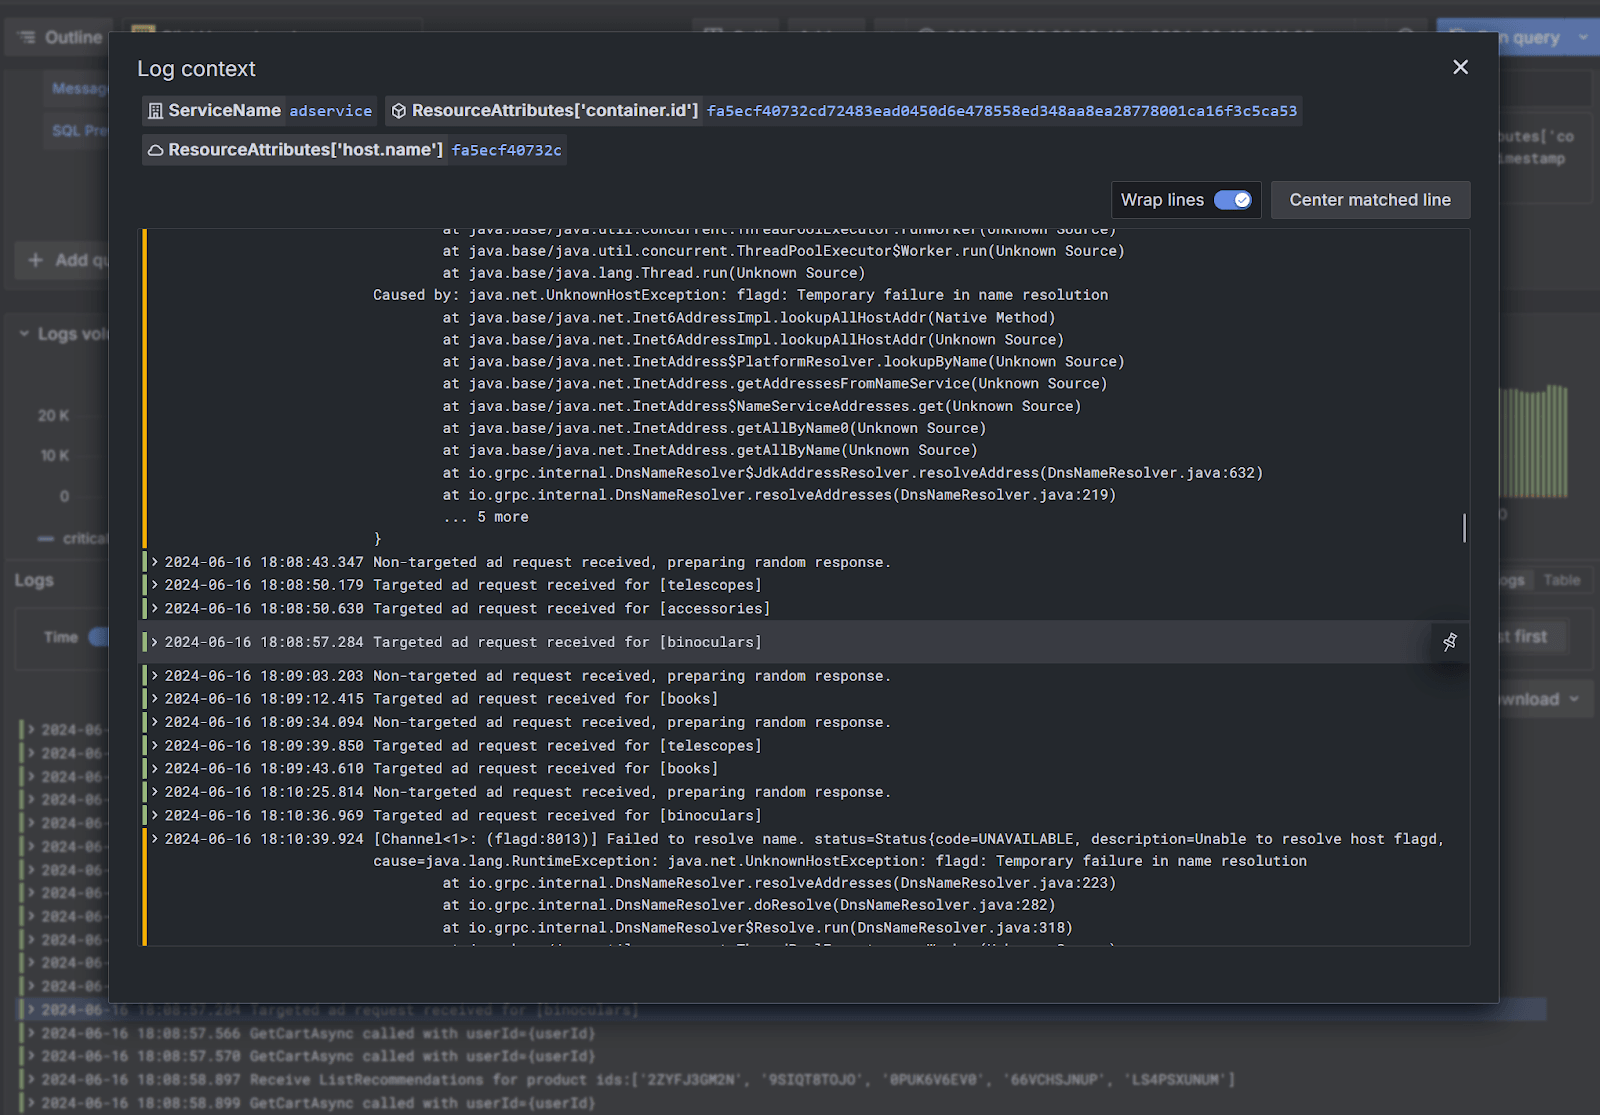
Since the release of version 4.0, efforts have focused on enriching the user experience with the recent addition of support for Log Context. This feature allows users to view logs related to a specific log line, enabling quick, contextual investigation of events.
The implementation works by modifying a base logs query to remove all existing filters and ORDER BY clauses. Context filters are then applied, matching values from the selected log row on key columns defined in the data source configuration - such as service name, hostname, or container ID. A time range filter based on the log’s timestamp is also added, along with an ORDER BY and LIMIT to control the display. Two queries are generated, one for each direction, allowing users to scroll up or down and load additional logs around the initial row.

The result is users are able to quickly attribute the cause of an error log message without needing to manually remove existing filters and find the log within its original stream.
Lessons learned #
Assisting our users in the deployment of the OTel-ClickHouse stack has led to a number of useful lessons learned.
The predominant lesson is ensuring users identify their query access patterns early and thus choose a sensible primary/ordering key for their tables. While ClickHouse is fast for linear scans, on larger deployments this becomes unrealistic if users expect sub second response times. Typically filtered columns should always be located in the primary key, sensibly ordered to align with the drill down behavior i.e. the first and most common filtered column should be first. This aligns with our earlier efforts to produce a better getting-started schema for users.
Additionally, it has become clear that materialized views are essential to meeting performance expectations and transforming OTel data to fit users' access patterns. We increasingly see users sending their data to a Null table engine, with a materialized view executing a query on the inserted rows. The results of this view are sent to target tables, which are responsible for serving user queries.

This has a few clear benefits:
-
Transformation - allowing users to modify the structure of data prior to storage. While the OTel schema is broadly applicable, users often need to extract fields from unstructured data e.g. the
Body, for efficient querying or use in the primary key. While transformations such as parsing strings or processing JSON can be done in the OTel collector, this work is more efficiently performed in ClickHouse where it consumes less resources and is faster. For an example, see the Extracting structure with SQL section of the schema design guide. -
Alternative ordering keys - Often, users' access patterns are too diverse to align with a single primary key. In this case, we see users either exploiting projections or using a materialized view that replicates subsets of the data to tables with a different ordering key. These separate tables then serve sub-teams or specific dashboards with known workflows. Alternatively, we find users using these sub tables to act as fast lookup tables for values then used to filter on the main table. For an example, see the Using Materialized views (incremental) for fast lookups section of the schema design guide.
-
Filtering subsets - Materialized views are increasingly used to filter subsets, sending these to tables on which alerts are generated. This allows the cost of these queries to be shifted from query to insert time.
-
Precomputing aggregations - Similar to filtering, precomputing aggregations queries in materialized views, such as error counts over time, allows the computational overhead to be shifted from insert to query time. For an example, see the Using Materialized views (incremental) for aggregations section of the schema design guide.
Finally, we’ve found users exploiting Column Alias’ in ClickHouse - especially in cases where the map columns identified earlier have many keys. This simplifies querying for users and avoids the need for users to remember available keys. While we expect this to be less of an issue with the development of JSON support, we still expect these to be relevant. Aliases are, as a result, also supported in the ClickHouse plugin for Grafana for users who prefer to manage these through the interface layer.
We have reflected these lessons in our Observability guide published earlier this year.
One size doesn’t fit all, not always OTel #
While OpenTelemetry brings a standardized, flexible, and open approach to telemetry data, using a powerful real-time analytics database such as ClickHouse enables it to store telemetry data beyond the OTel paradigm efficiently. By centralizing different datasets in the same location, users can achieve a holistic view of a complex system's internals.
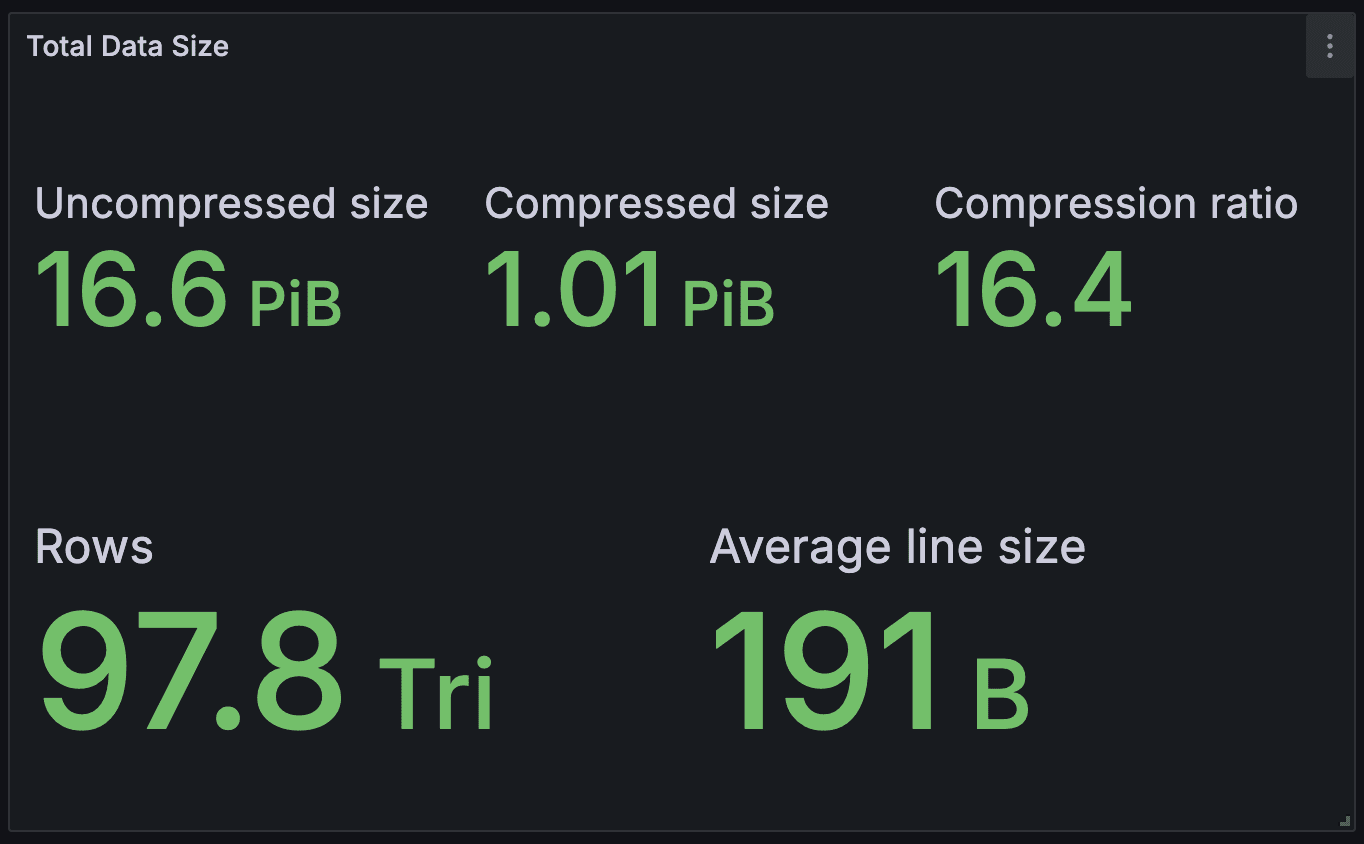
A good example of this approach is our internal logging use case at ClickHouse. We already documented in a separate blog post, LogHouse, our OTel-based logging platform which manages more than 43 petabytes of data (as of October 2024). Earlier this year, we also shipped another companion system to LogHouse: SysEx (short for Systems Tables Exporter), a specialized collector that centralizes signals from all the ClickHouse Cloud database services and is based on collecting the ClickHouse system database _log tables. As of today (Nov 2024), SysEx manages almost 100 Trillion rows and helps our teams efficiently run ClickHouse Cloud.
Time series engine - ClickHouse as a storage engine for Prometheus data #
As a toolkit for collecting, storing, and analyzing time-series metrics, Prometheus has become ubiquitous across industries for tracking application and infrastructure performance. Valued for its flexible data model, powerful query language (PromQL), and seamless integration with modern containerized environments like Kubernetes, Prometheus excels in reliability and simplicity with its pull-based model minimizing dependencies. Despite its huge adoption and success, it has well-acknowledged limitations: No multi-node support, with only vertical scaling supported and a memory-hungry implementation. Furthermore, it notoriously struggles with high cardinality data and has limited multi-tenant support.
24.8 of ClickHouse introduced the Timeseries table engine as experimental. This table engine allows ClickHouse to be used as the storage later for Prometheus metrics. This aims to allow users to continue to enjoy the benefits and experience of Prometheus while directly addressing its limitations: offering scalable, high-performance storage with native multi-node support in a memory-efficient architecture with support for high cardinality data. With ClickHouse as the storage backend, users can maintain the familiar Prometheus interface and functionality while benefiting from ClickHouse’s horizontal scalability, efficient data compression, and query performance.
This is achieved through the remote-write and remote-read protocols.

We provided a full example of configuring the table engine in our recent release post. This requires a read-and-write endpoint to be specified in the ClickHouse configuration file, with the same endpoints then used in the Prometheus configuration. With this, a table of the Timeseries engine type can be created.
1CREATE TABLE test_time_series ENGINE=TimeSeries
This creates three target tables responsible for storing metrics, tags/labels, and data points.
1SHOW TABLES LIKE '.inner%'
2
3┌─name───────────────────────────────────────────────────┐
4│ .inner_id.data.c23c3075-5e00-498a-b7a0-08fc0c9e32e9	│
5│ .inner_id.metrics.c23c3075-5e00-498a-b7a0-08fc0c9e32e9 │
6│ .inner_id.tags.c23c3075-5e00-498a-b7a0-08fc0c9e32e9	│
7└────────────────────────────────────────────────────────┘
8
93 rows in set. Elapsed: 0.002 sec.
This aims to normalize the Prometheus data to reduce replication (e.g. of tags) and maximize compression. However, when a metric is retrieved (over the remote-read protocol) this schema requires a join at query time - usually on a generated identifier. Users who have followed the instructions from the release post, can either visualize metrics though the simple Prometheus UI or via Grafana.
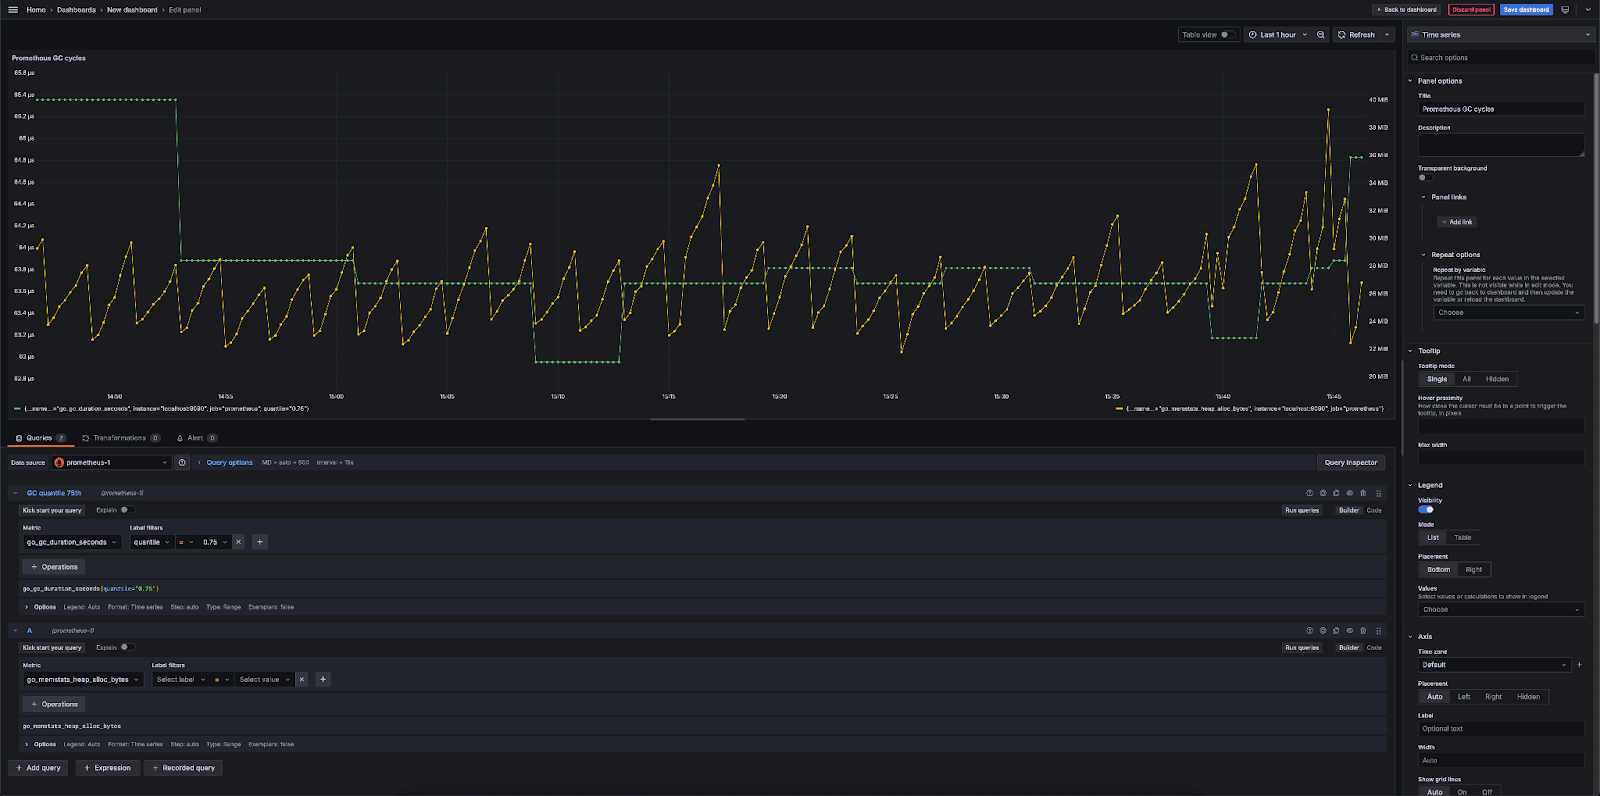
By default Prometheus generates internal metrics allowing users to perform a functional test. Above, we visualize metrics concerning the Prometheus go process.
Above, we plot the go_memstats_heap_alloc_bytes metric describing the number of bytes allocated in the Prometheus go heap. This requires a SEMI LEFT JOIN between our data and tags table, grouping by the metric_name and tags fields.
With the Prometheus remote-read integration to ClickHouse, users can query historical data stored in ClickHouse using PromQL directly from Prometheus. This integration enables time-series queries, letting users access recent and older data in one place. However, the current implementation means Prometheus pulls all raw data from ClickHouse and performs filtering, aggregation, and PromQL operations locally. This works well for small or short-duration queries, but querying larger datasets over wider periods quickly becomes inefficient. Prometheus doesn't push down aggregation operations to fully leverage ClickHouse, so complex or high-cardinality queries over long time ranges are currently not optimal.
In summary, the time series table engine provides a foundational capability for storing and querying Prometheus data. We should emphasize that this integration is highly experimental, serving as a basis for future work and enhancements. With ongoing improvements planned in the coming months, we aim to unlock more of ClickHouse's performance potential within Prometheus, providing a more efficient, scalable solution for robust, long-term metrics storage and analytics.
Looking forward & closing remarks #
For the remainder of 2024 and early 2025, our observability efforts will concentrate on three major initiatives: production-ready JSON, inverted indices, and the time series table engine.
Moving JSON to production-ready and making this the default in the OTel Collector schema remains our main priority. This requires significant development to support efficiently in the underlying go client. This client is also used by Grafana, so this work will allow us to also visualize this column type.
Inverted indices have been supported in ClickHouse in experimental form for some time. While we don’t expect users to use this feature on all data, inverted indices are essential for fast text queries on more recent data. This avoids a linear scan, and similar to skipping indices, it should allow us to minimize the number of granules required to read (especially for rarer terms). Similar to JSON, we feel this feature needs significant improvements to become production-ready, but we expect to see improvements in the new year.
Note that we have no intention of supporting relevancy statistics and becoming a search engine! These features are not required in observability use cases, with users typically sorting by time. Inverted indices will remain a secondary index designed purely to speed up LIKE and token matching queries for strings.
In conclusion, have the recent developments changed the criteria as to whether ClickHouse is an appropriate choice for your observability solution? Yes and No.
While users can still follow the decision-making process we outlined at the start of this blog, they can do so with greater confidence. The recent developments address the last criteria: “You prefer to wait for the ecosystem to mature more and SQL-based observability to get more turnkey.”
With the addition of JSON support and increasingly robustness of OTel and usability of Grafana, we feel the ClickHouse observability story has been leveled up from both ends of the pipeline. These features, while not changing the fundamental decisions, ensure ClickHouse is more accessible, simpler to adopt and more robust than ever for observability workloads.


