TL;DR
Standard SQL UPDATEs come to ClickHouse: up to 1,000× faster than mutations thanks to lightweight patch‑part updates.
-
Part 1: Purpose-built engines
Learn how ClickHouse sidesteps slow row-level updates using insert-based engines like ReplacingMergeTree, CollapsingMergeTree, and CoalescingMergeTree. -
Part 2: Declarative SQL-style UPDATEs
Explore how we brought standard UPDATE syntax to ClickHouse with minimal overhead using patch parts. -
This part: Benchmarks and results
See how fast it really is. We benchmarked every approach, including declarative UPDATEs, and got up to 1,000× speedups. -
Bonus: ClickHouse vs PostgreSQL
We put ClickHouse’s new SQL UPDATEs head-to-head with PostgreSQL on identical hardware and data—parity on point updates, up to 4,000× faster on bulk changes.
Fast SQL UPDATEs in ClickHouse: benchmarks and squirrels on espresso #
Imagine a squirrel. Small, quick, darting between stashes, dropping in new nuts.
Now picture that squirrel on espresso, ridiculously fast, zipping between stashes before you can blink.
That’s what lightweight updates in ClickHouse feel like: zipping between data parts, stashing tiny patches that apply instantly and keep queries fast.
Spoiler: These are full standard SQL UPDATEs, implemented with a lightweight patch‑part mechanism. In our benchmark, a bulk standard SQL UPDATE finished in 60 ms instead of 100 s, 1,600× faster than classic mutations, while worst‑case queries run almost like on fully rewritten data.
This post is Part 3 of our deep‑dive on fast UPDATEs in ClickHouse, and it’s all about benchmarks.
(If you want to see how we achieved this speedup, check out Part 2: SQL‑style UPDATEs.)
Here, we benchmark every UPDATE method side by side:
- Classic mutations & on‑the‑fly mutations
- Lightweight updates (patch parts)
- ReplacingMergeTree inserts
We focus on:
-
Update speed and visibility – how quickly each method applies changes
-
Query impact before merges – how updates affect latency before materialization
Everything is fully reproducible, with open‑sourced scripts and queries.
To start, we’ll introduce the dataset and benchmark setup, then go through the results.
Dataset and benchmark setup #
Dataset #
In Part 1 and Part 2, we used a small orders table to illustrate basic update scenarios.
For this benchmark, we continue the same “orders” theme but scale it up using the TPC-H lineitem table, which models the items from customer orders. This is a prototypical scenario for updates, where quantities, prices, or discounts might change after the initial insert:
CREATE TABLE lineitem (
    l_orderkey       Int32,
    l_partkey        Int32,
    l_suppkey        Int32,
    l_linenumber     Int32,
    l_quantity       Decimal(15,2),
    l_extendedprice  Decimal(15,2),
    l_discount       Decimal(15,2),
    l_tax            Decimal(15,2),
    l_returnflag     String,
    l_linestatus     String,
    l_shipdate       Date,
    l_commitdate     Date,
    l_receiptdate    Date,
    l_shipinstruct   String,
    l_shipmode       String,
    l_comment        String)
ORDER BY (l_orderkey, l_linenumber);
We use the scale factor 100 version of this table, which contains roughly 600 million rows (~600 million items from ~150 million orders) and occupies ~30 GiB compressed (~60 GiB uncompressed).
For our benchmarks, the lineitem table is stored as a single data part. Its ~30 GiB compressed size is well below ClickHouse’s 150 GiB compressed merge threshold, the point up to which background merges will combine smaller parts into one. This ensures the table naturally exists as a single, fully‑merged part, making it a realistic update scenario.
Here’s a quick look at the lineitem base table we used for all benchmark runs, confirming its single‑part size:
SELECT
    formatReadableQuantity(sum(rows)) AS row_count,
    formatReadableQuantity(count()) AS part_count,
    formatReadableSize(sum(data_uncompressed_bytes)) AS size_uncomp,
    formatReadableSize(sum(data_compressed_bytes)) AS size_comp
FROM system.parts
WHERE active AND database = 'default' AND `table` = 'lineitem_base_tbl_1part';
┌─row_count──────┬─part_count─┬─size_uncomp─┬─size_comp─┐
│ 600.04 million │ 1.00       │ 57.85 GiB   │ 26.69 GiB │
└────────────────┴────────────┴─────────────┴───────────┘
Hardware and OS #
We used an AWS m6i.8xlarge EC2 instance (32 cores, 128 GB RAM) with a gp3 EBS volume (16k IOPS, 1000 MiB/s max throughput) running Ubuntu 24.04 LTS.
ClickHouse version #
All tests were performed with ClickHouse 25.7.
Running it yourself #
You can reproduce all results with our benchmark scripts on GitHub.
The repository includes:
- Update statement sets (bulk and single-row)
- Scripts to run benchmarks and collect timings
- Helpers to inspect data part sizes and query impact
With our environment and dataset ready, we can now explore how different update methods behave, starting with bulk updates, the backbone of most pipelines.
Bulk UPDATEs #
We’ll start with bulk updates, since they’re the backbone of batch pipelines and the most common workload for classic mutations.
We benchmarked 10 typical bulk updates using three methods, each linked to its SQL scripts on GitHub:
-
Mutations – trigger a full rewrite of affected data parts.
-
Lightweight updates – write only small patch parts to disk.
(Uses standard SQL UPDATE statements; the ‘lightweight’ name only refers to the efficient patch‑part implementation.) -
On-the-fly mutations – use the same syntax as mutations, but only store the update expressions in memory and apply them on read. Full column rewrites happen asynchronously.
Note:
-
We focus on declarative updates here. Purpose‑built engines like ReplacingMergeTree are excluded from multi‑row benchmarks, since bulk updates are impractical with row‑by‑row inserts. (Later, we’ll cover single‑row updates for these engines.)
-
We didn’t benchmark
DELETEs separately. ADELETEis either a classic mutation that rewrites_row_existsor a lightweight patch of that mask, and both mechanisms are already represented above.
(Charts ahead! Skip the “How we measured” boxes in each section if you just want the results.)
How we measured – Bulk Updates Runtime (click to expand)
1. Drop the lineitem table if it exists.
2. Clone a fresh lineitem table from the base table.
3. Run the update and measure its runtime.
Repeat 3× per method to compute average runtime.
Procedure repeated for all 10 bulk updates.
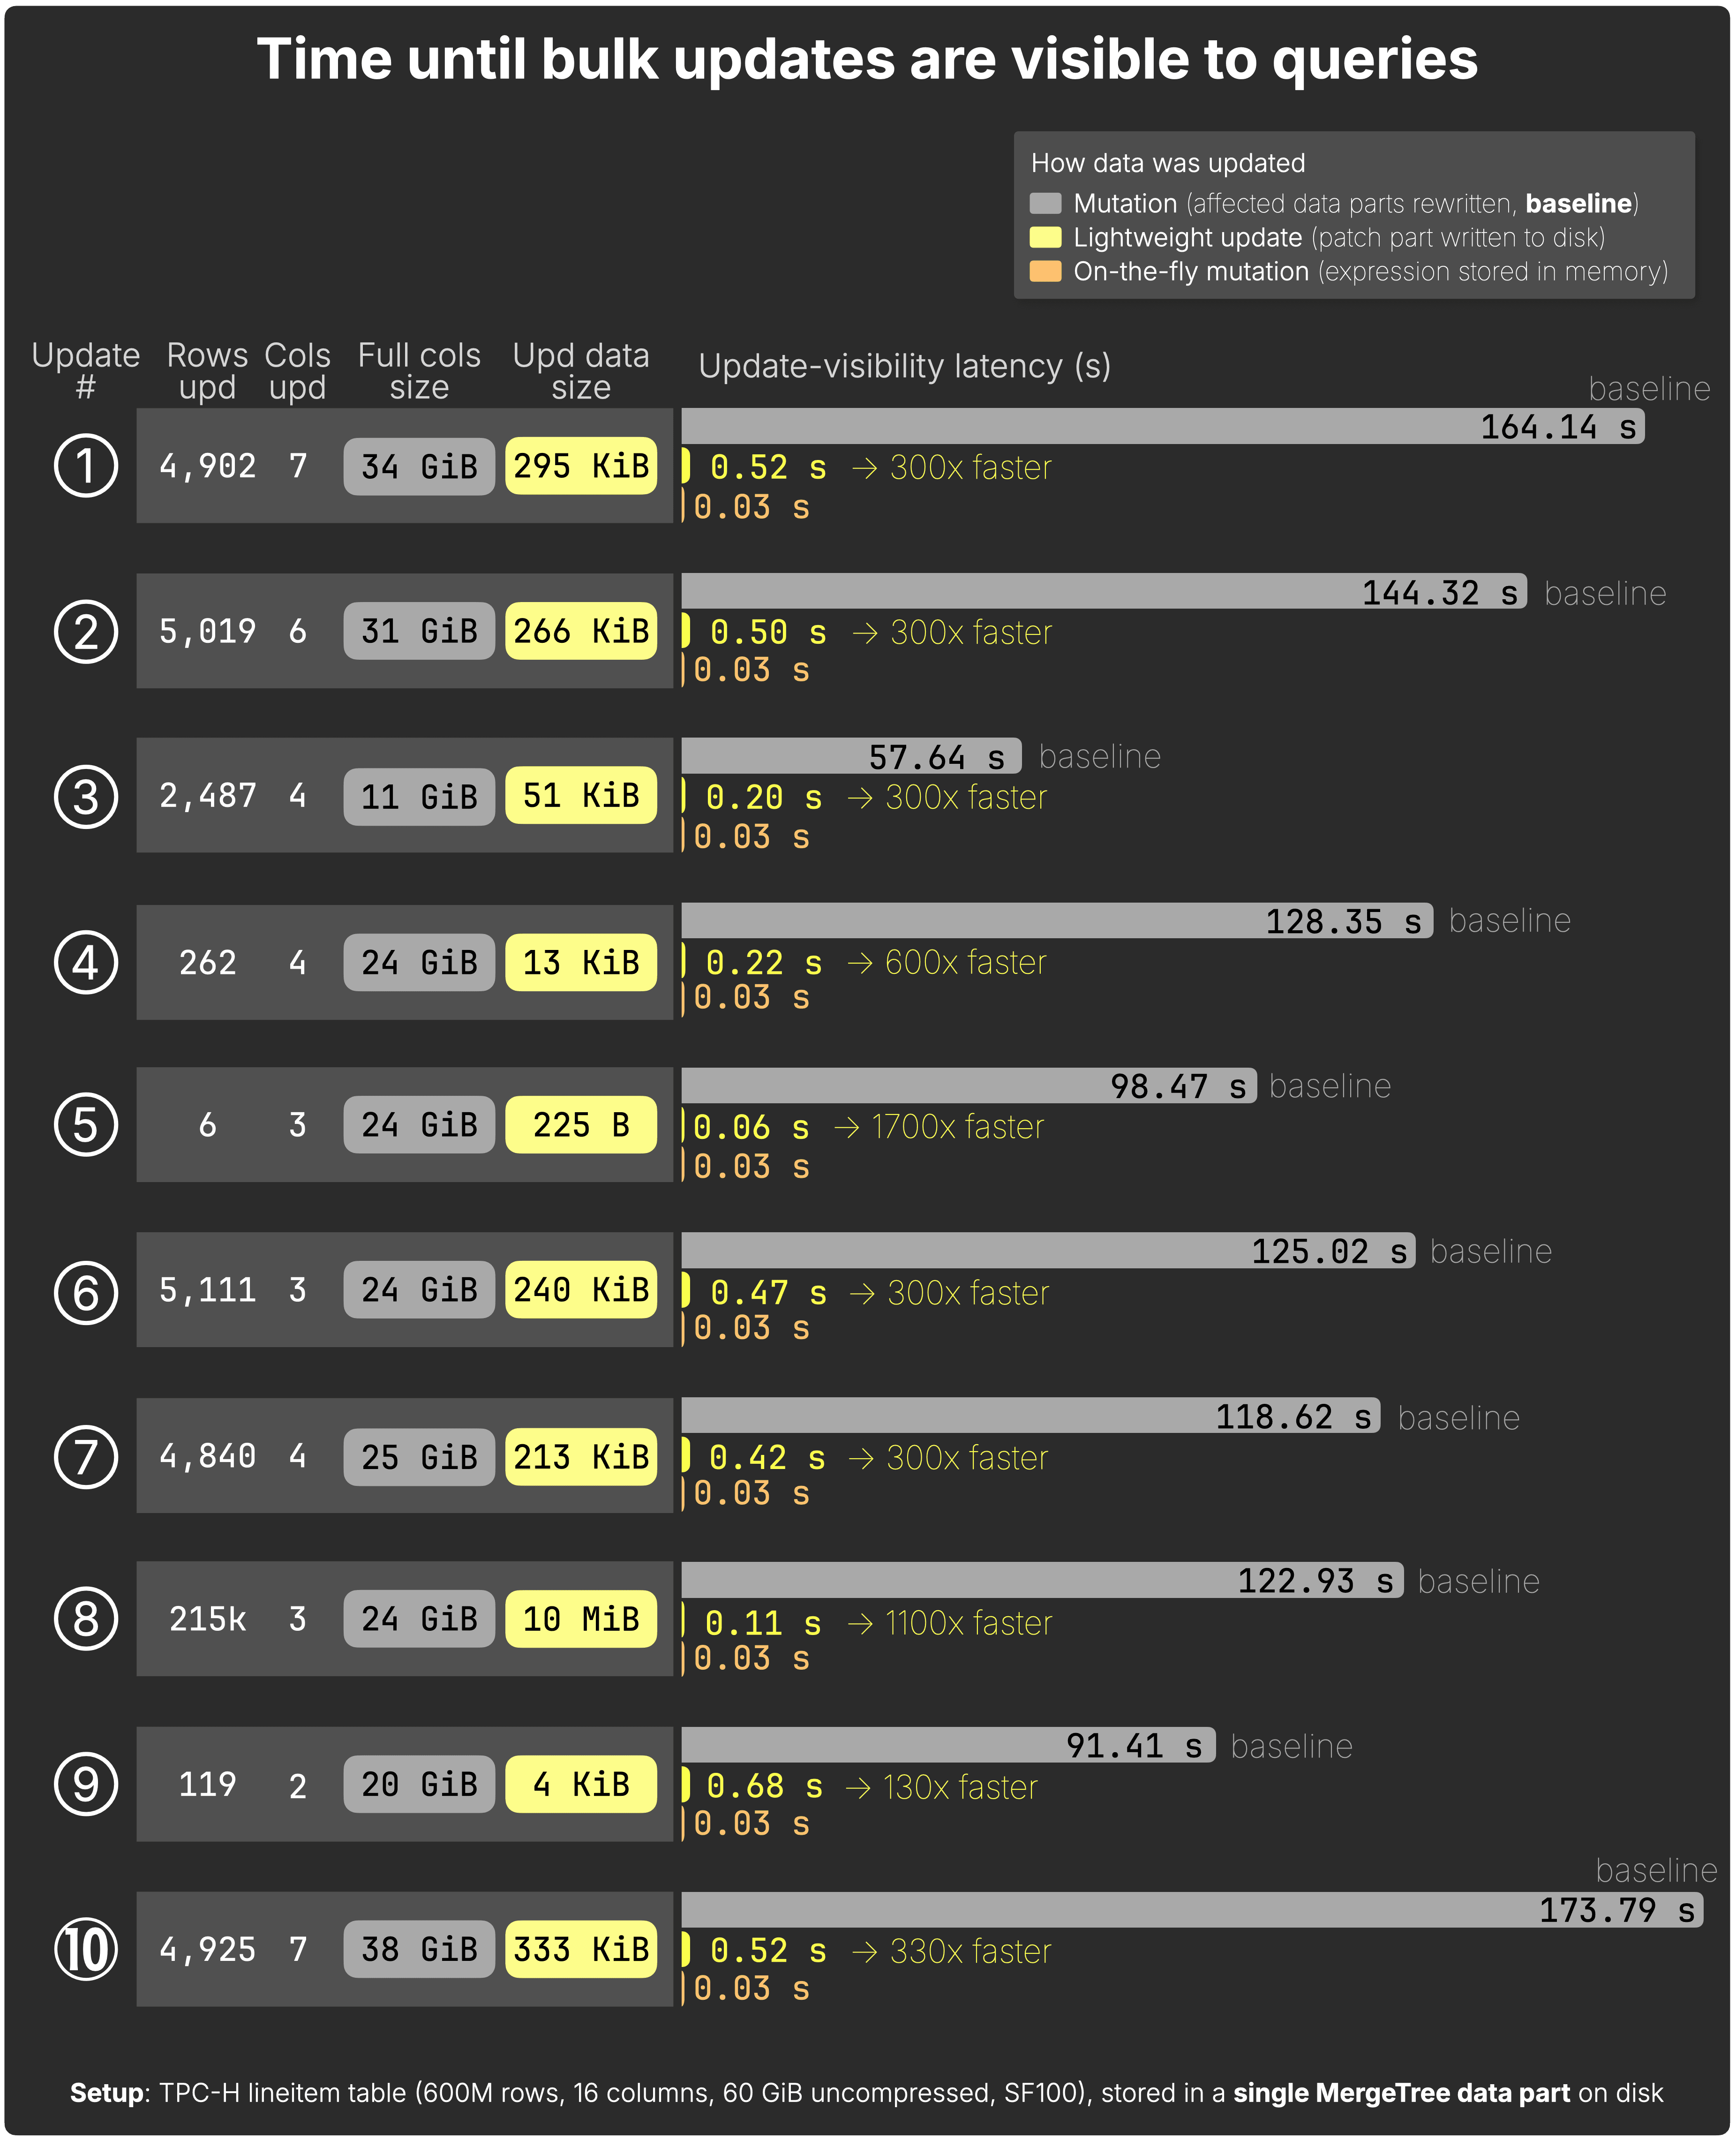
Time until bulk updates are visible to queries #
For every one of the 10 bulk UPDATEs, the chart below measures the time from issuing the UPDATE to the moment its changes are visible to queries, comparing all three methods.
We also show how much faster (in %) lightweight updates are relative to classic mutations, which must finish rewriting the affected data parts before queries see the changes.
Additional key metrics on the chart (click to expand)
-
On-the-fly mutations — update expressions are stored in memory to be immediately applicable to queried data.
-
Classic mutations — slowest path; every change rewrites full columns on disk before queries can see the new data.
-
Lightweight updates — up to 1,700× faster by writing tiny “patch parts” that slot in instantly for queries.
See the raw benchmark results for the JSON files behind these charts.
We’ll break down exactly why the methods differ in speed in the deep dive later.
Fast updates are great, but only if they don’t hurt queries. Let’s see how each method impacts query performance.
Worst-case post-update query time — bulk updates #
After full materialization, query performance is identical, regardless of the used update method.
Once background processing is complete, the table’s data parts are fully updated, and queries run at baseline speed regardless of the UPDATE method:
-
Mutations – data parts are rewritten immediately.
-
On‑the‑fly mutations – background column rewrites eventually materialize the in-memory update expressions.
-
Lightweight updates – patch parts are merged into the main data parts by regular background merges.
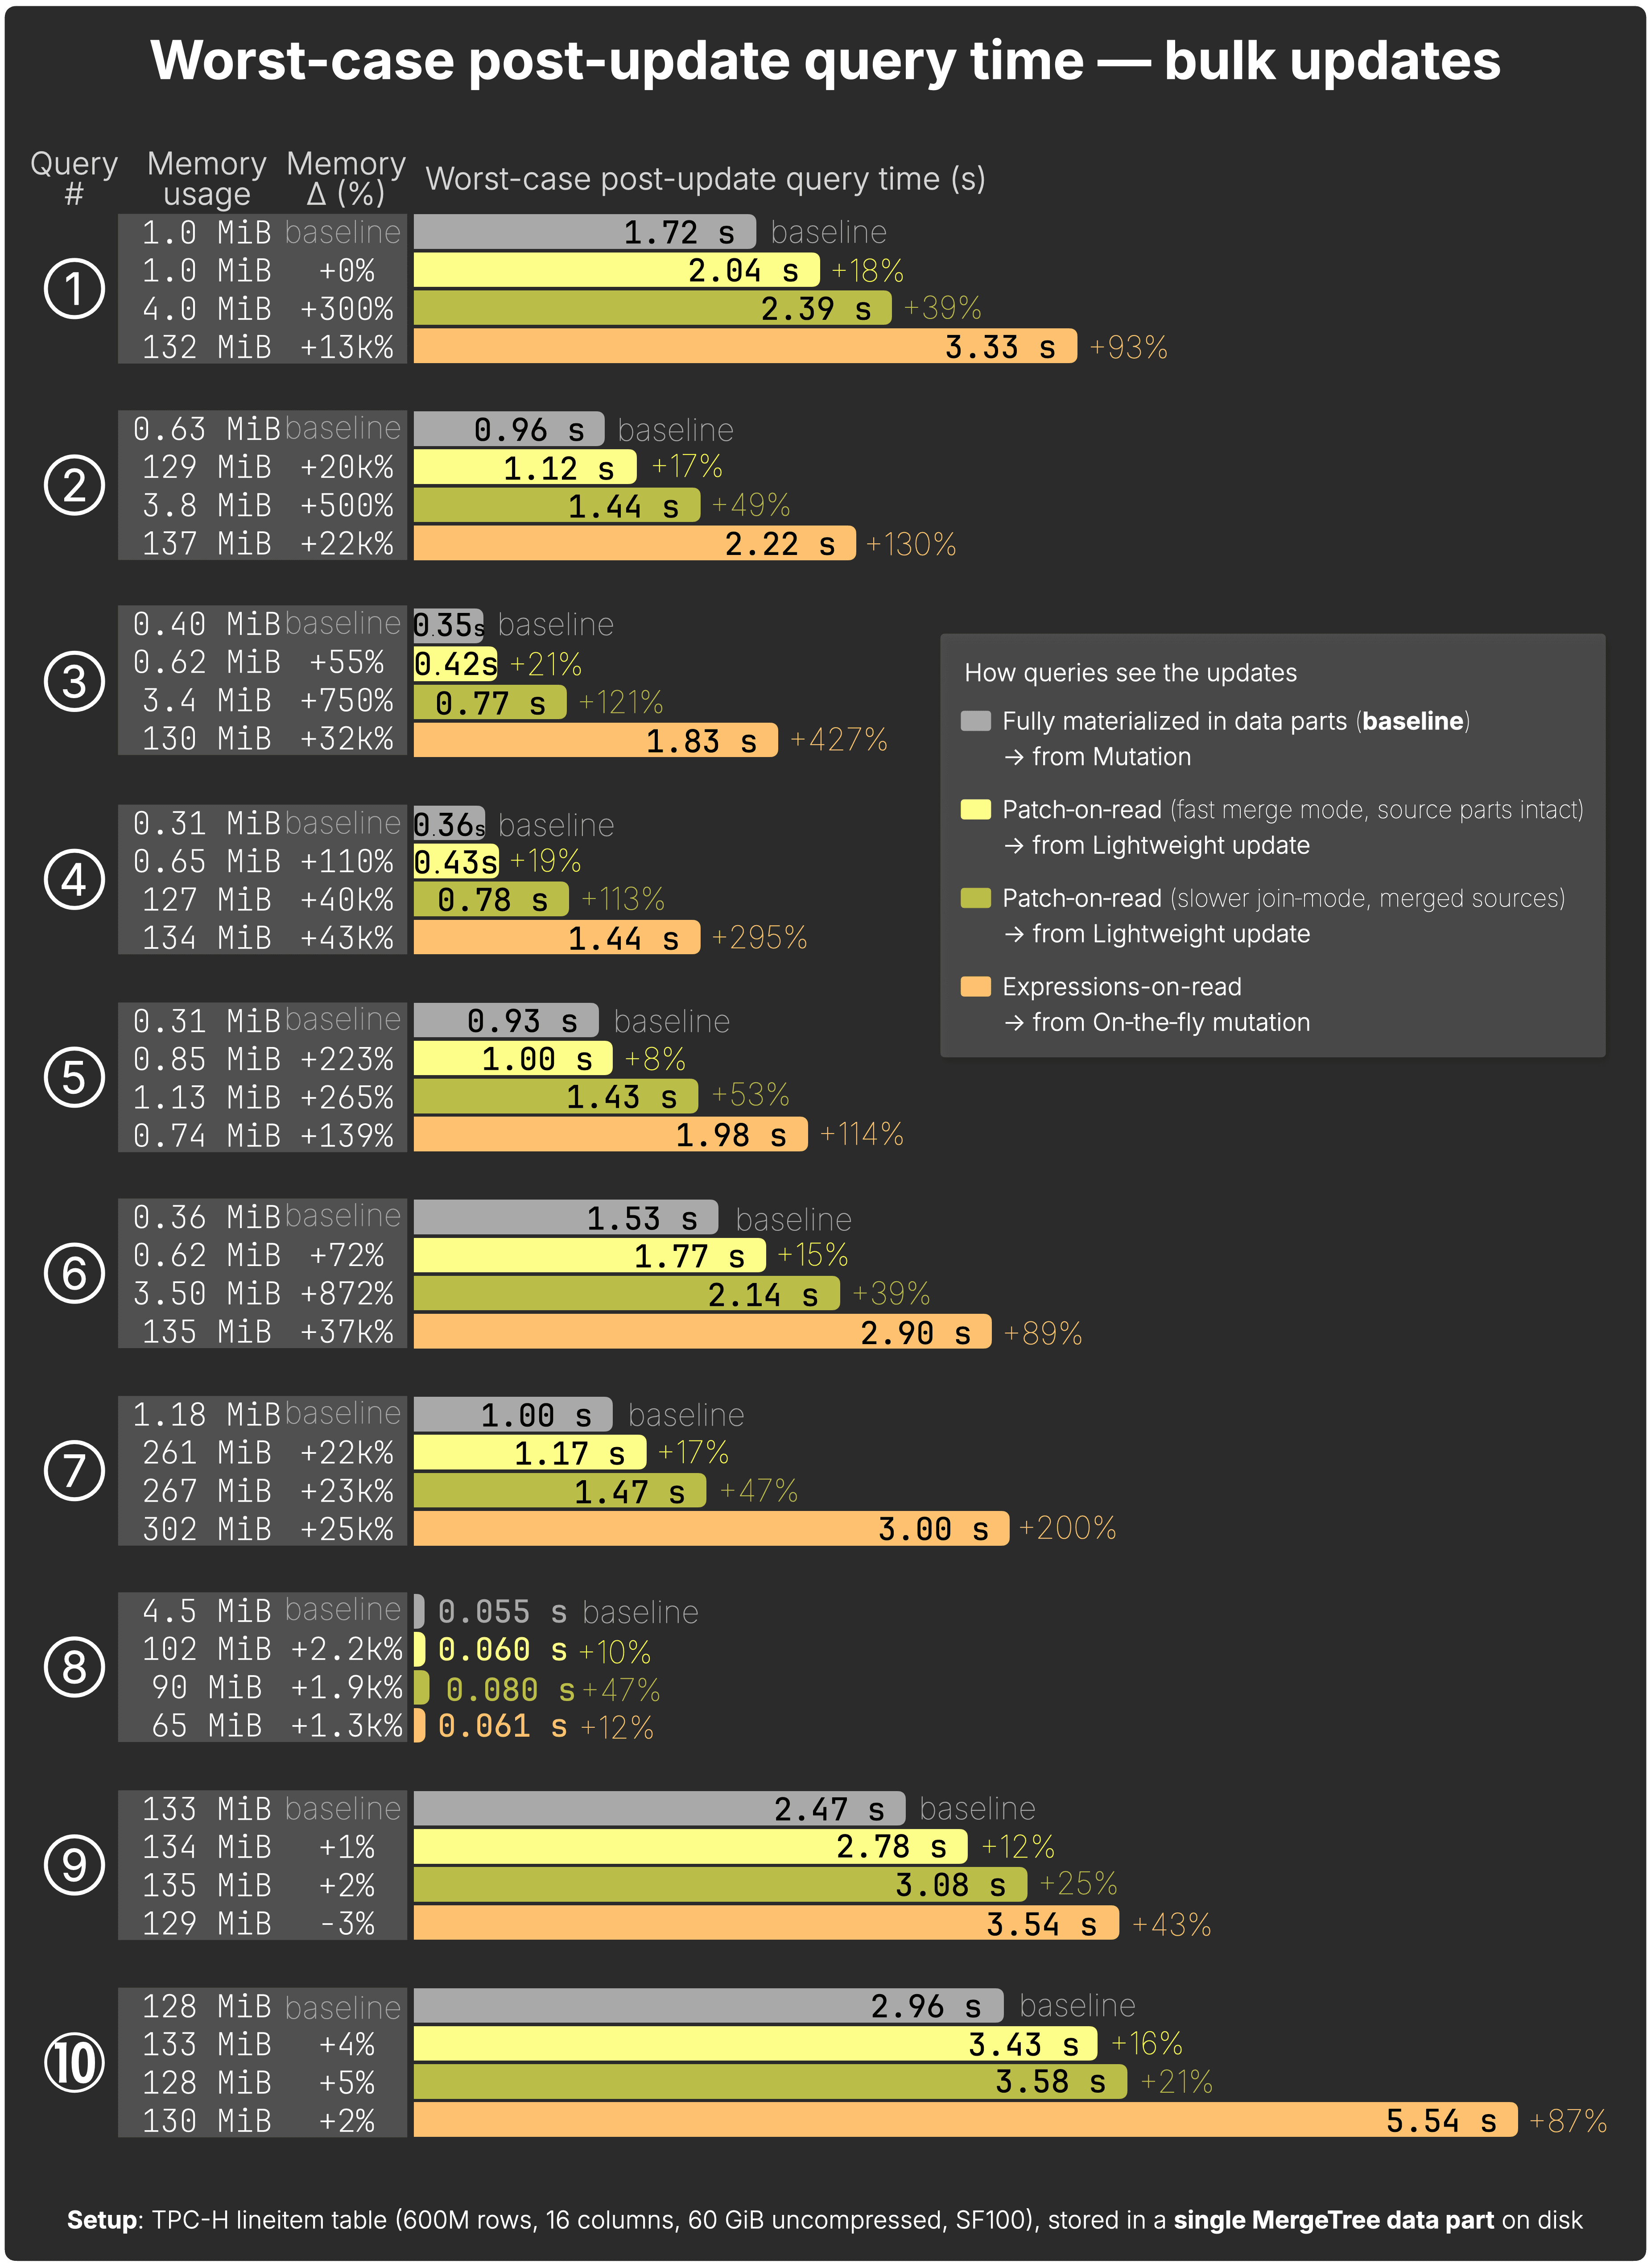
Therefore, we report the worst-case post-update query time, which is our most conservative view of performance, defined as the runtime of a query that hits the freshly updated rows before those changes have been fully materialized on disk.
We then show how much slower this is (expressed as a slowdown percentage) relative to the baseline time for the same query hitting the data once a classic mutation has finished writing all updates to disk.
How we measured – Worst-case post-bulk-update query time (click to expand)
• We use 10 analytical queries, paired 1:1 with the 10 updates.
• After each update, its paired query runs 3× to measure average runtime and memory usage.
• Each query touches at least the updated rows and columns, but many scan broader data for realistic analytics.
• To capture the worst-case latency, the benchmark disables background merges:
• Lightweight updates rely on Patch-on-read (implicit FINAL).
The next chart shows worst-case post-update query time for all 10 queries after each type of bulk UPDATE, compared to the baseline of fully materialized updates:
Additional key metrics on the chart (click to expand)
-
Classic mutations (baseline) → the query runtime once a synchronous mutation has fully rewritten the affected data parts on disk.
-
Lightweight updates → Minimal overhead by default (avg. 15%), only 8–21% slowdown in fast-merge mode.
-
Rare lightweight updates fallback → Slower join-mode can occur (39–121% overhead) if source parts merge concurrently to patch creation.
-
On-the-fly mutations → Visible instantly but cause the highest slowdown (12–427%, avg. 149%).
Memory impact → On-the-fly can spike from ~0.7 MiB to ~302 MiB; lightweight stays very modest.
Raw benchmark results are here →
The mechanics behind these slowdowns and memory changes will be explored in the deep dive section later.
Bulk updates are the backbone of batch pipelines, but many real applications rely on frequent single-row updates. Let’s see how the methods compare there.
Single-row updates #
We also benchmark single‑row updates to represent workloads suited for ReplacingMergeTree or CoalescingMergeTree.
-
Each of the 10 updates from before now targets 1 row (instead of thousands). View SQL files →
-
For ReplacingMergeTree, we insert a new row for each update; non‑updated columns repeat existing values. Replacing inserts →
- (CoalescingMergeTree could avoid this repetition of non-updated columns but requires all updated columns to be Nullable.)
Note: We benchmarked only ReplacingMergeTree here as a representative of purpose‑built update engines from Part 1. Performance would be similar for CoalescingMergeTree and CollapsingMergeTree.
To compare the UPDATE performance of ReplacingMergeTree with the other methods, we also expressed the same 10 single‑row updates as mutations, on-the-fly mutations, and lightweight updates (standard SQL UPDATE syntax, implemented with patch parts). View SQL files →
How we measured – Single‑Row Updates Runtime (click to expand)
For single‑row (point) updates we used the same procedure: drop & clone the table, apply the update, measure runtime three times, and average the results, repeated for 10 updates per method.
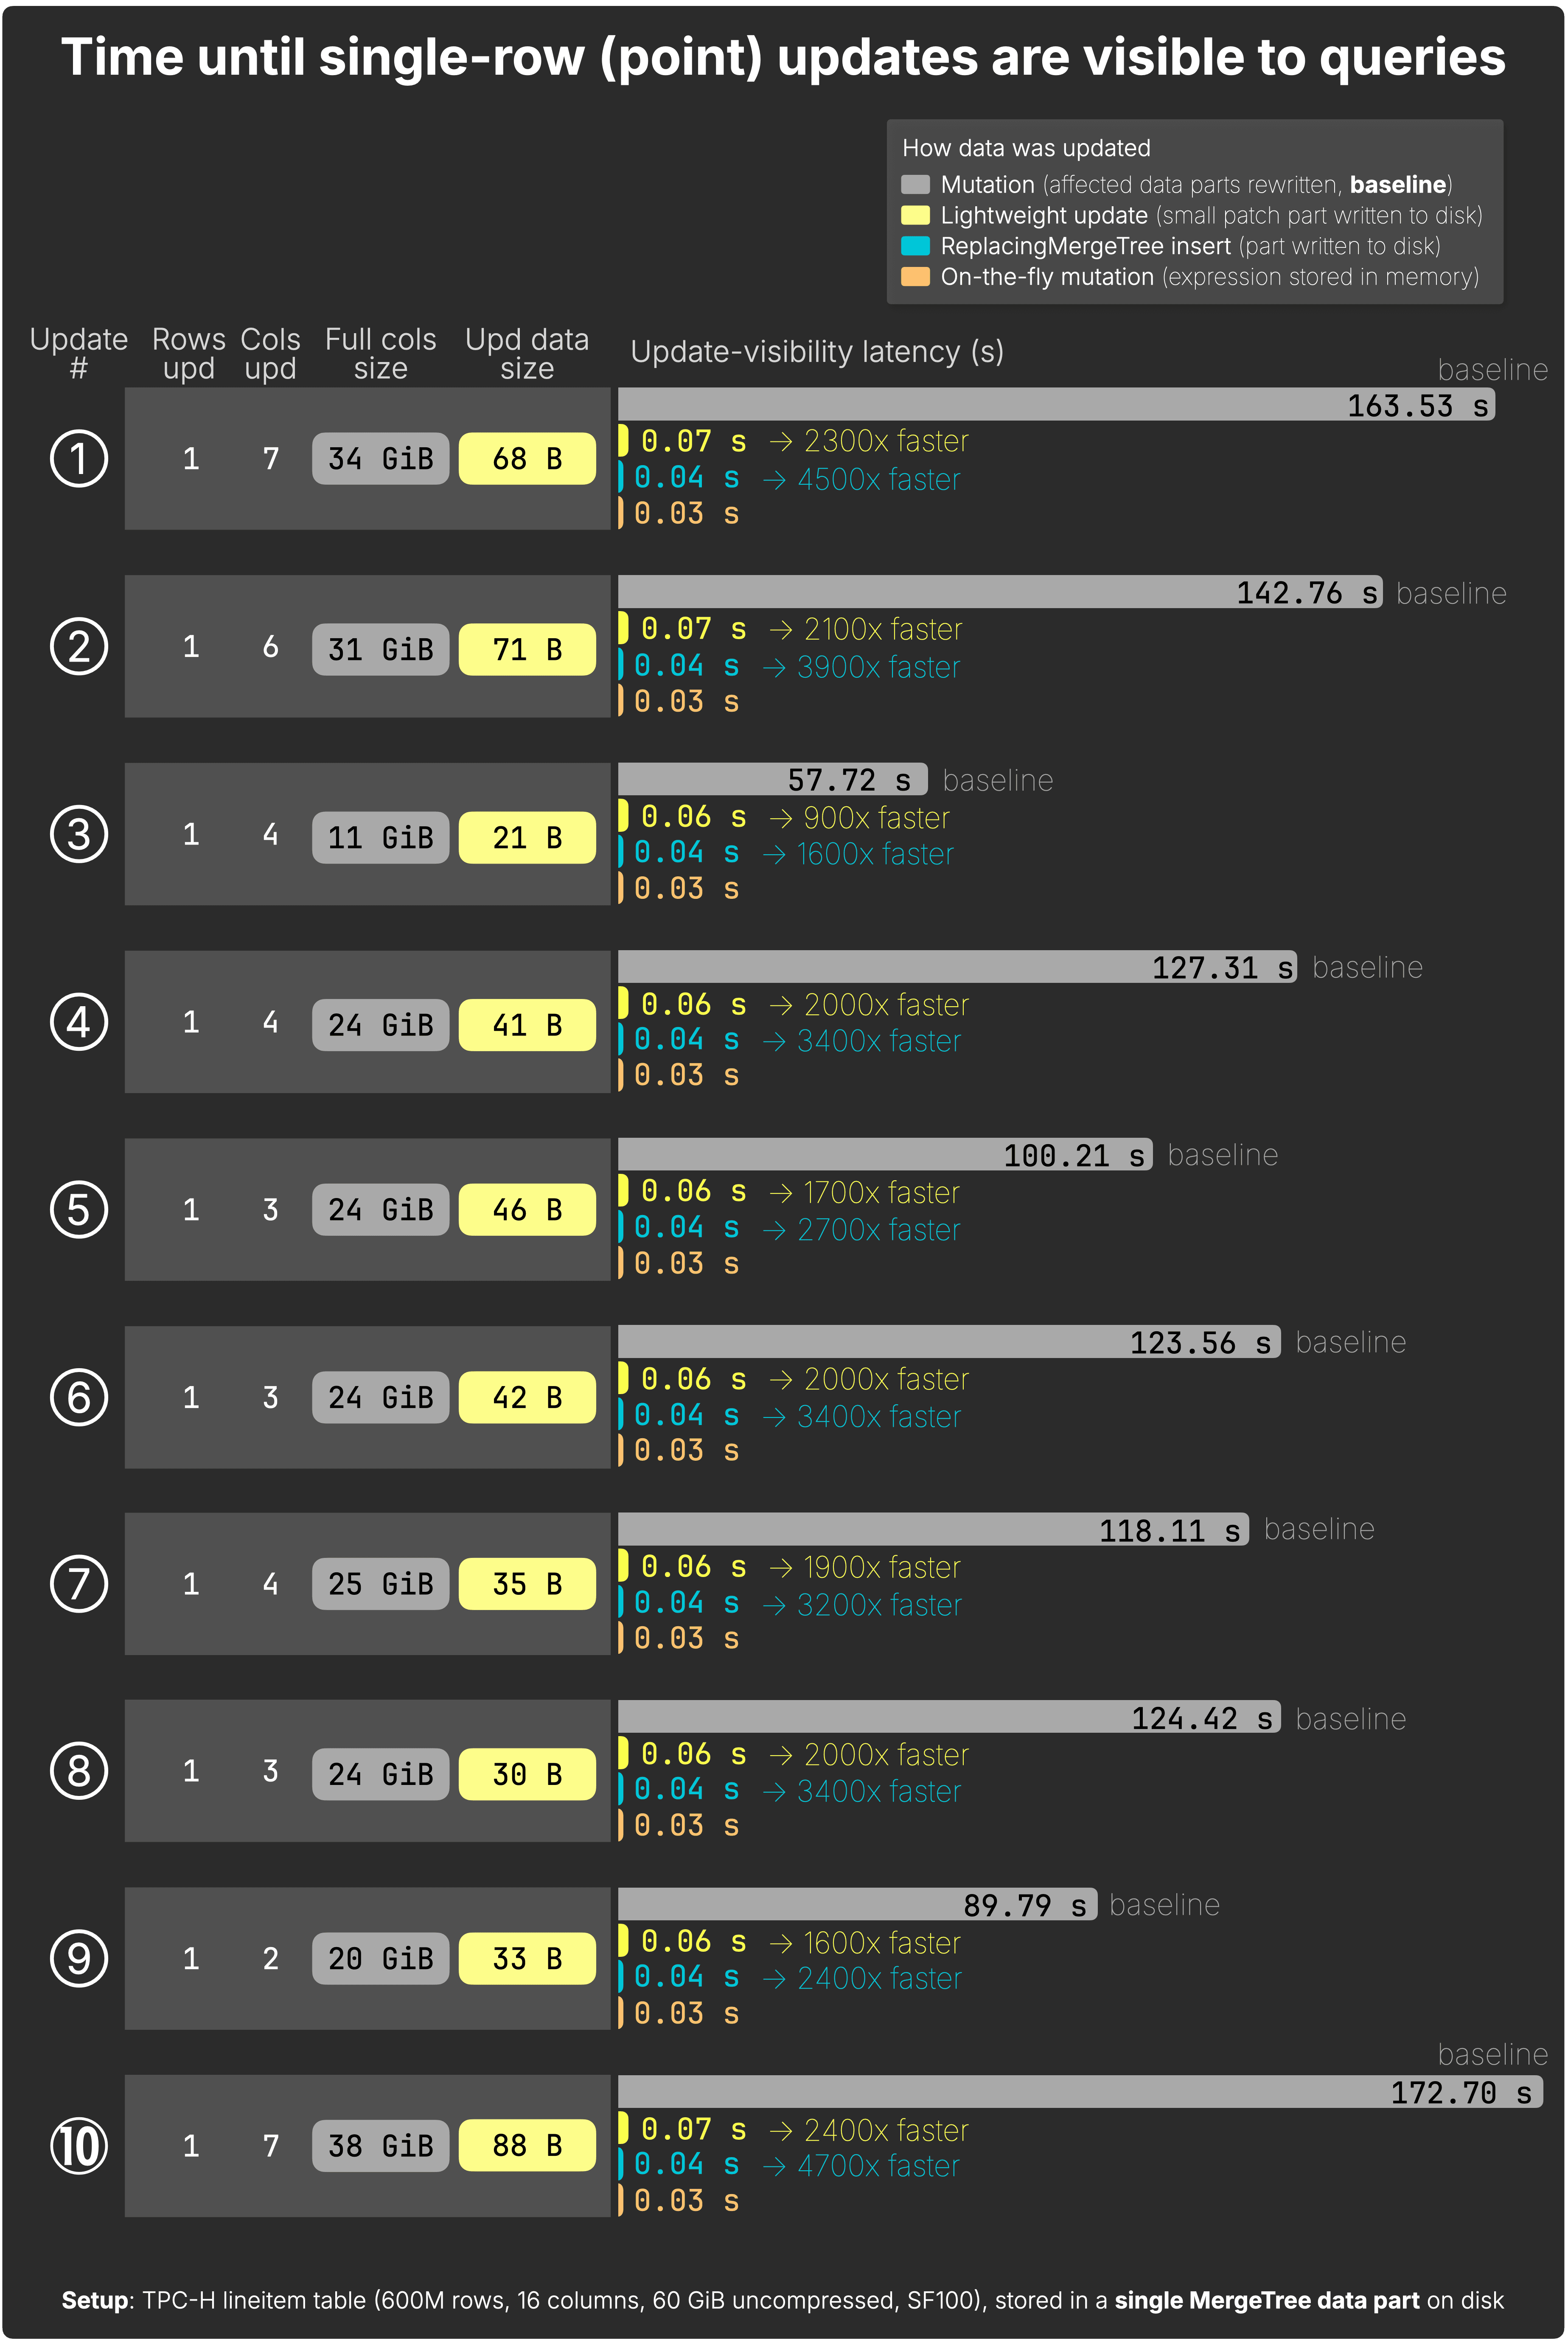
Time until single-row (point) updates are visible to queries #
As with bulk updates, for each of the 10 single-row (point) UPDATEs the next chart shows the elapsed time from issuing the UPDATE to when its changes become visible to queries, across all four methods.
We also show how much faster (in %) lightweight updates and replacing inserts are compared to the baseline of classic mutations, which only become visible once all affected data parts are rewritten.
Additional key metrics on the chart (click to expand)
-
On‑the‑fly mutations → Instantly visible (~0.03 s), since update expressions are just stored in memory; full rewrites happen later in the background.
-
ReplacingMergeTree inserts → Fastest raw speed (0.03–0.04 s) by writing new rows only; up to 4,700× faster than full mutations; no row-lookup at all, but later queries must resolve multiple row versions until background merges complete.
-
Lightweight updates → Almost as fast (0.04–0.07 s), up to 2,400× faster than full mutations, writes tiny patch parts; slightly slower due to row‑lookup, but far more efficient at query time.
-
Mutations → Slowest (90–170 s), as they rewrite all affected columns, even for a single row.
Raw benchmark results are here →
As with the bulk results, we’ll explain the reasons for these patterns later in the deep dive.
Again, update speed is only half the picture, how do single‑row updates affect queries?
Worst-case post-update query time — single-row updates #
For the single‑row benchmark, we reuse the same 10 analytical queries as in the multi‑row test.
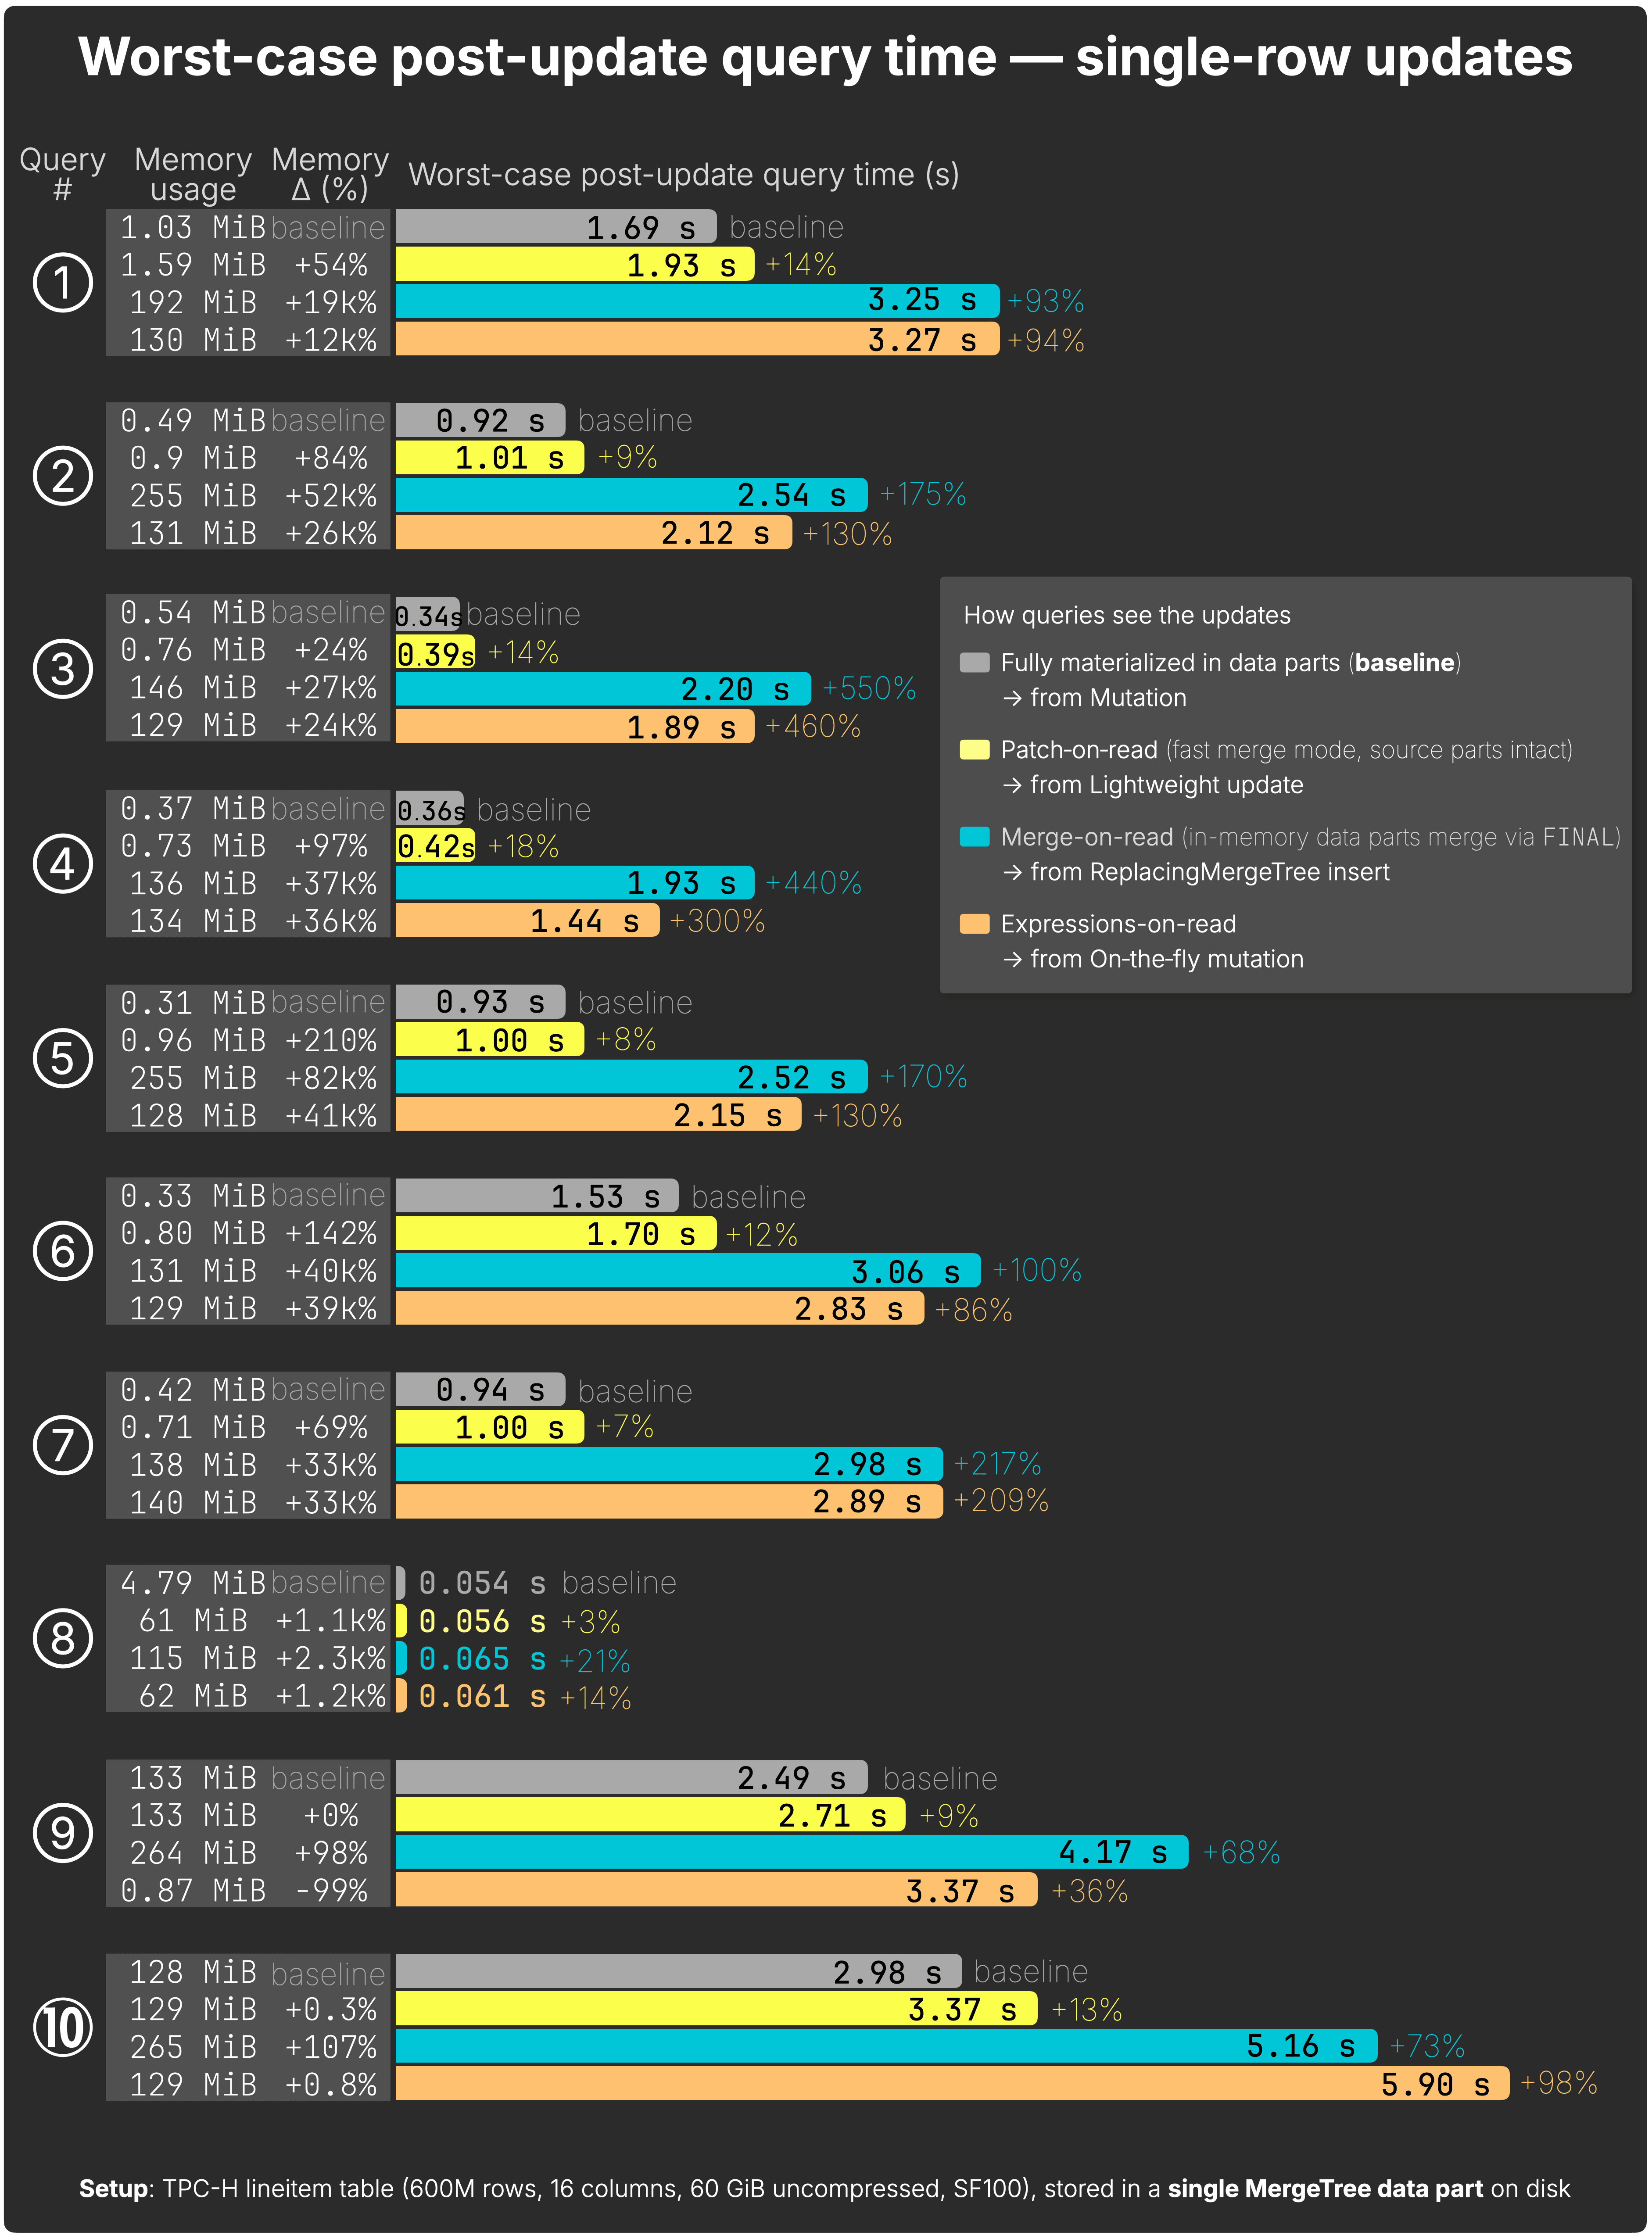
In this section, as with our bulk-update tests, we benchmark worst-case post-update query time, the time a query takes when it touches freshly updated rows before those changes are fully materialized on disk, and report the slowdown %, i.e. how much slower this is versus the same query’s runtime once a classic mutation has fully materialized the updates (the baseline).
How we measured – Worst-case post-point-update query time (click to expand)
• Each query is paired 1:1 with its update; we record average runtime and memory over three runs.
• Each query touches at least the updated rows and columns, but many scan broader data for realistic analytics.
• To capture the worst‑case latency, the benchmark disables background merges:
• Lightweight updates rely on Patch‑on‑read (implicit FINAL).
• ReplacingMergeTree queries run with explicit FINAL.
The following chart shows for all 10 analytical queries the worst-case post-update query time after each type of bulk UPDATE, compared to the baseline of fully materialized updates:
Additional key metrics on the chart (click to expand)
-
Classic mutations (baseline) → the query runtime once a synchronous mutation has fully rewritten the affected data parts on disk.
-
Lightweight updates → Most efficient for queries; slowdown 7 – 18 % (avg ~12 %), memory +20 % – 210 %. Only fast‑merge mode is shown to keep the chart readable.
-
On‑the‑fly mutations → Visible instantly and often faster than ReplacingMergeTree + FINAL, but slow down sharply if many updates pile up in memory (not shown here).
-
ReplacingMergeTree + FINAL → Heaviest queries; slowdown 21 – 550 % (avg ~280 %), memory 20 × – 200 × baseline, as queries must read all row versions.
Raw benchmark results are here →
The results are striking. Now, let’s peek under the hood to understand why ClickHouse behaves this way.
Deep dive: Why the results look this way #
Parts 1 and 2 already explored how each update method works under the hood, classic mutations, lightweight updates, and purpose-built engines like ReplacingMergeTree.
Here, we take an additional deep dive, comparing these methods side by side to reveal why the benchmark charts look the way they do, and what’s really happening inside ClickHouse.
Why lightweight updates feel like inserts #
Despite the name, these are ordinary SQL UPDATE statements, ClickHouse just optimizes them by writing patch parts instead of rewriting full columns.
Lightweight updates write tiny patch parts instead of rewriting full columns.
Queries simply overlay these patches in memory (patch‑on‑read), so applying a small change feels almost as fast as inserting new rows.
Specifically, a lightweight update writes a patch part that only contains:
- The updated values
- A tiny bit of targeting metadata: _part, _part_offset, _block_number, _block_offset, and _data_version
This metadata points exactly to the rows that need updating, so ClickHouse avoids scanning or rewriting any unrelated data.
Update performance is roughly comparable to an INSERT INTO … SELECT that writes only the changed values plus their row’s metadata:
-- Lightweight update statement:

UPDATE lineitem
SET l_discount = 0.045, l_tax = 0.11, ...
WHERE l_commitdate = '1996-02-01' AND l_quantity = 1;
≈
-- Roughly equivalent:

INSERT INTO patch
SELECT 0.045 as l_discount, 0.11 as l_tax, ...,
       _part, _part_offset, _block_number, _block_offset

FROM lineitem
WHERE l_commitdate = '1996-02-01' AND l_quantity = 1;
This is why lightweight updates feel as fast as small inserts, they avoid scanning or rewriting unrelated data.
Because their mechanics are intentionally based on ClickHouse’s fast and efficient insert mechanics, you can make lightweight updates as frequently as you can do inserts.
When to use lightweight updates (and when not to) #
Lightweight updates are designed for frequent, small changes (≈ ≤ 10% of a table).
Use them when you want updates to appear almost instantly with almost no worst-case post-update query slow-down.
Lightweight updates shine for small, frequent corrections, like updating a few percent of a table at a time.
Large updates, however, create big patch parts which:
-
Must be applied in memory on every query (patch‑on‑read) until they merge,
-
add CPU and RAM overhead before materialization, and
-
will merge into the source part eventually.
For large changes, this means queries can become much slower until the patches are materialized with the next regular background merge. It is often better to run a classic mutation, wait longer once (for the update to rewrite the part), and then enjoy baseline query performance afterward.
Think of lightweight updates as sticky notes, perfect for quick, precise edits. But if you’re re-papering the whole wall, new wallpaper (a mutation) is faster and cleaner.
We use two schematic charts to visualize the trade-off.
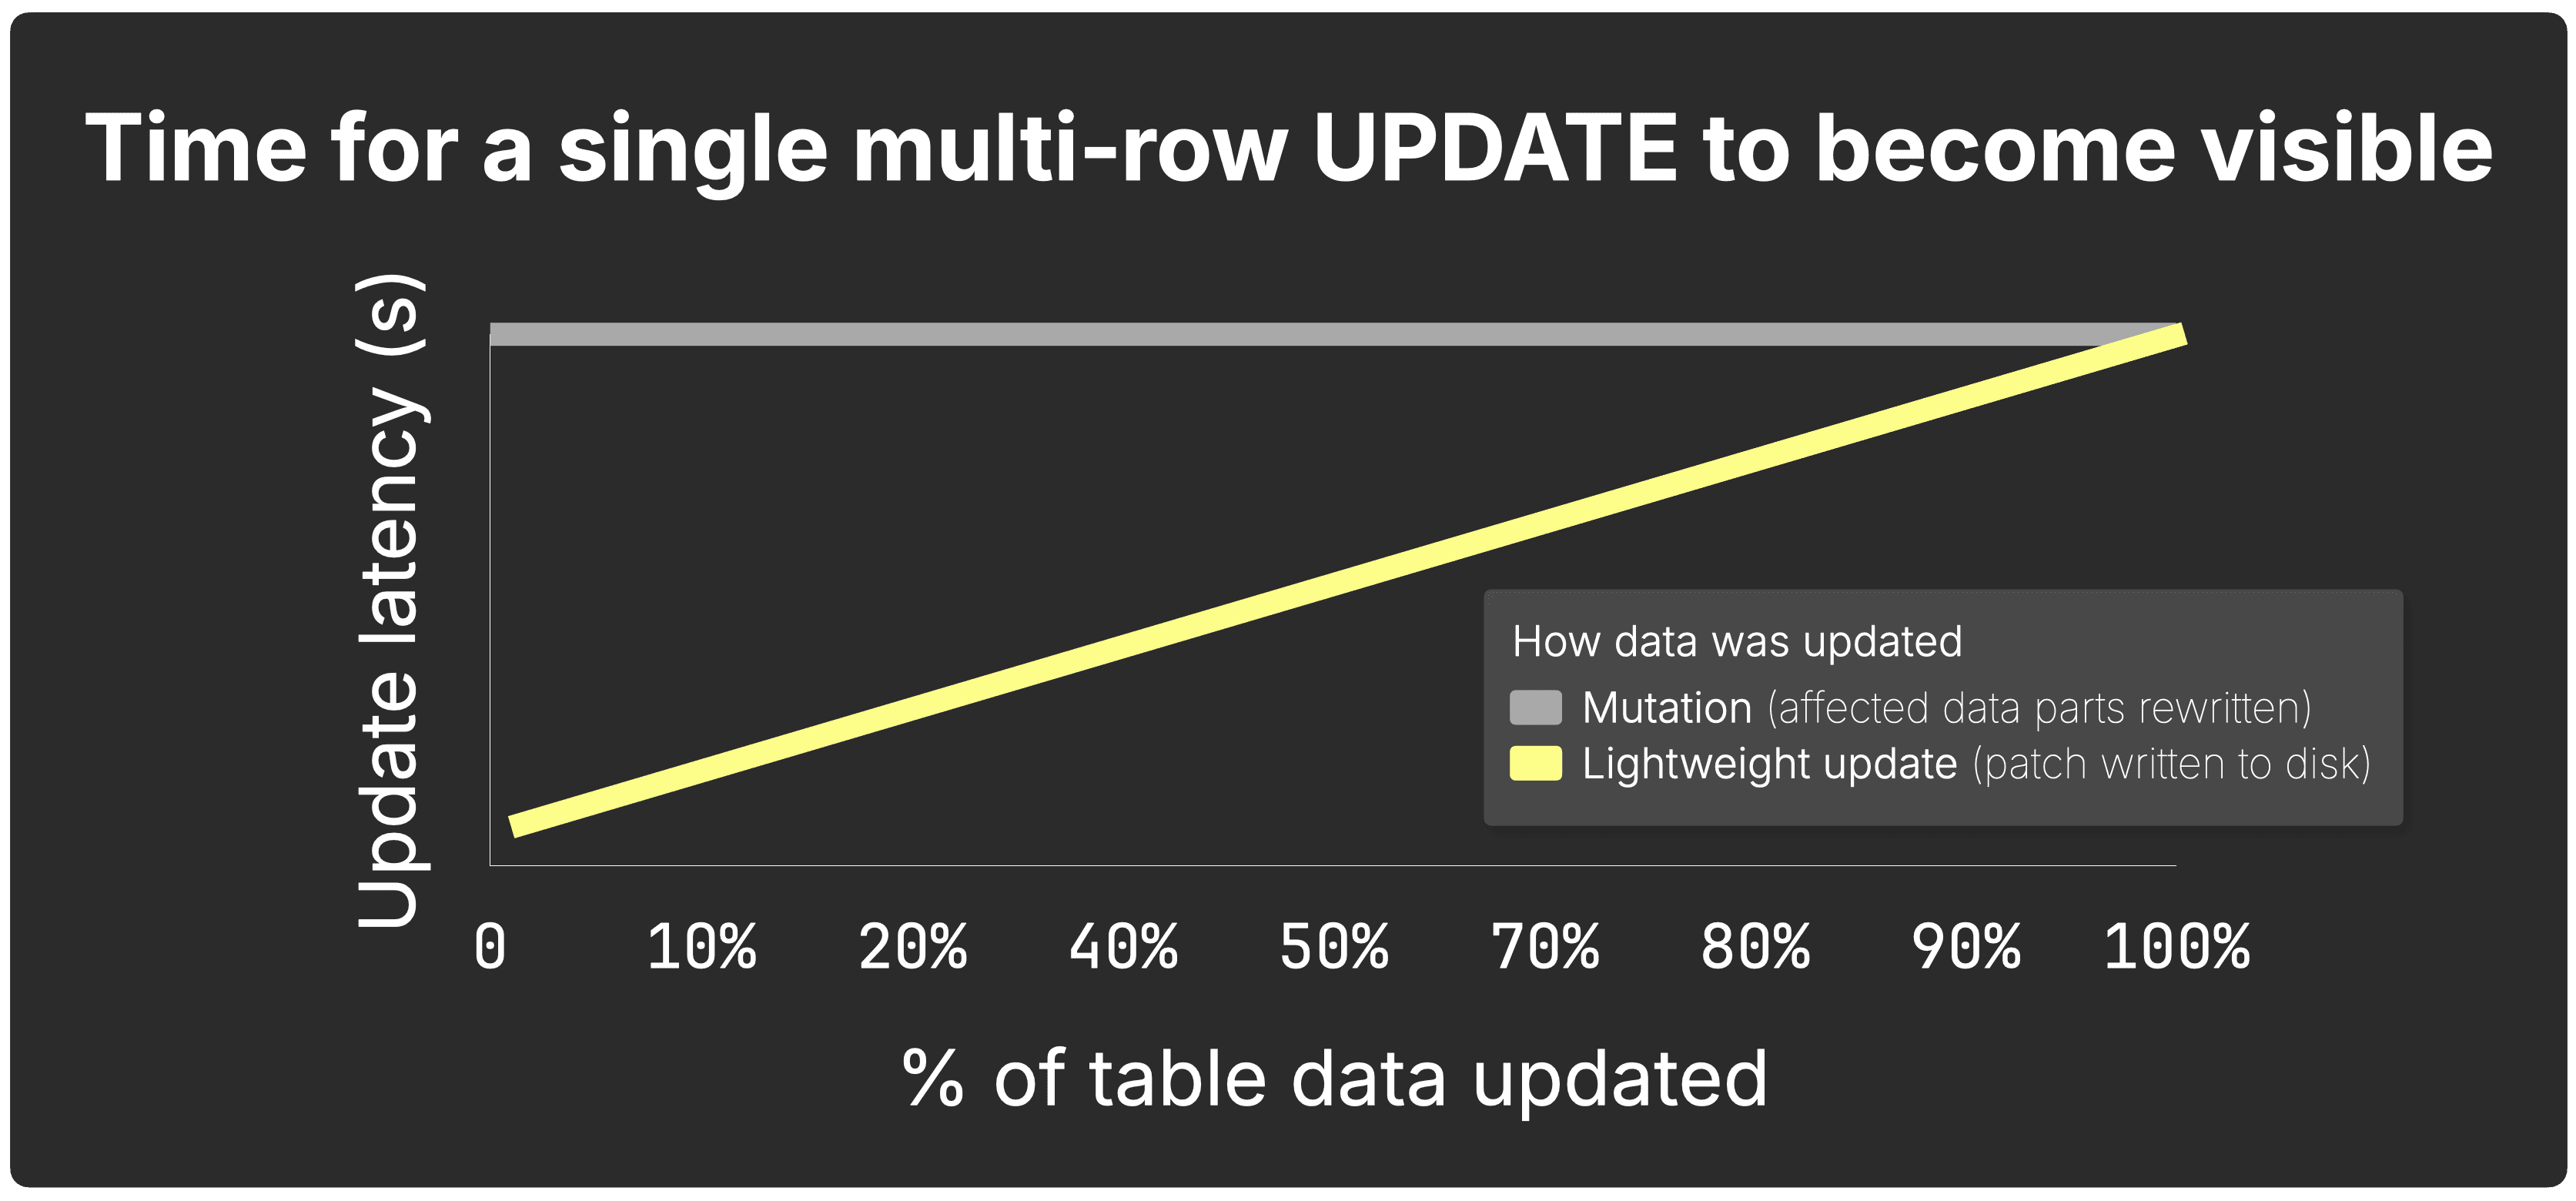
Chart 1 – update latency #
Chart 1 shows how update latency changes as the percentage of modified rows grows.
-
Mutation (grey line) rewrites every affected column, so latency stays flat.
-
Lightweight update (yellow line) writes only a patch part, so it is fastest for tiny changes and gradually converges on mutation latency as the update touches more of the table.
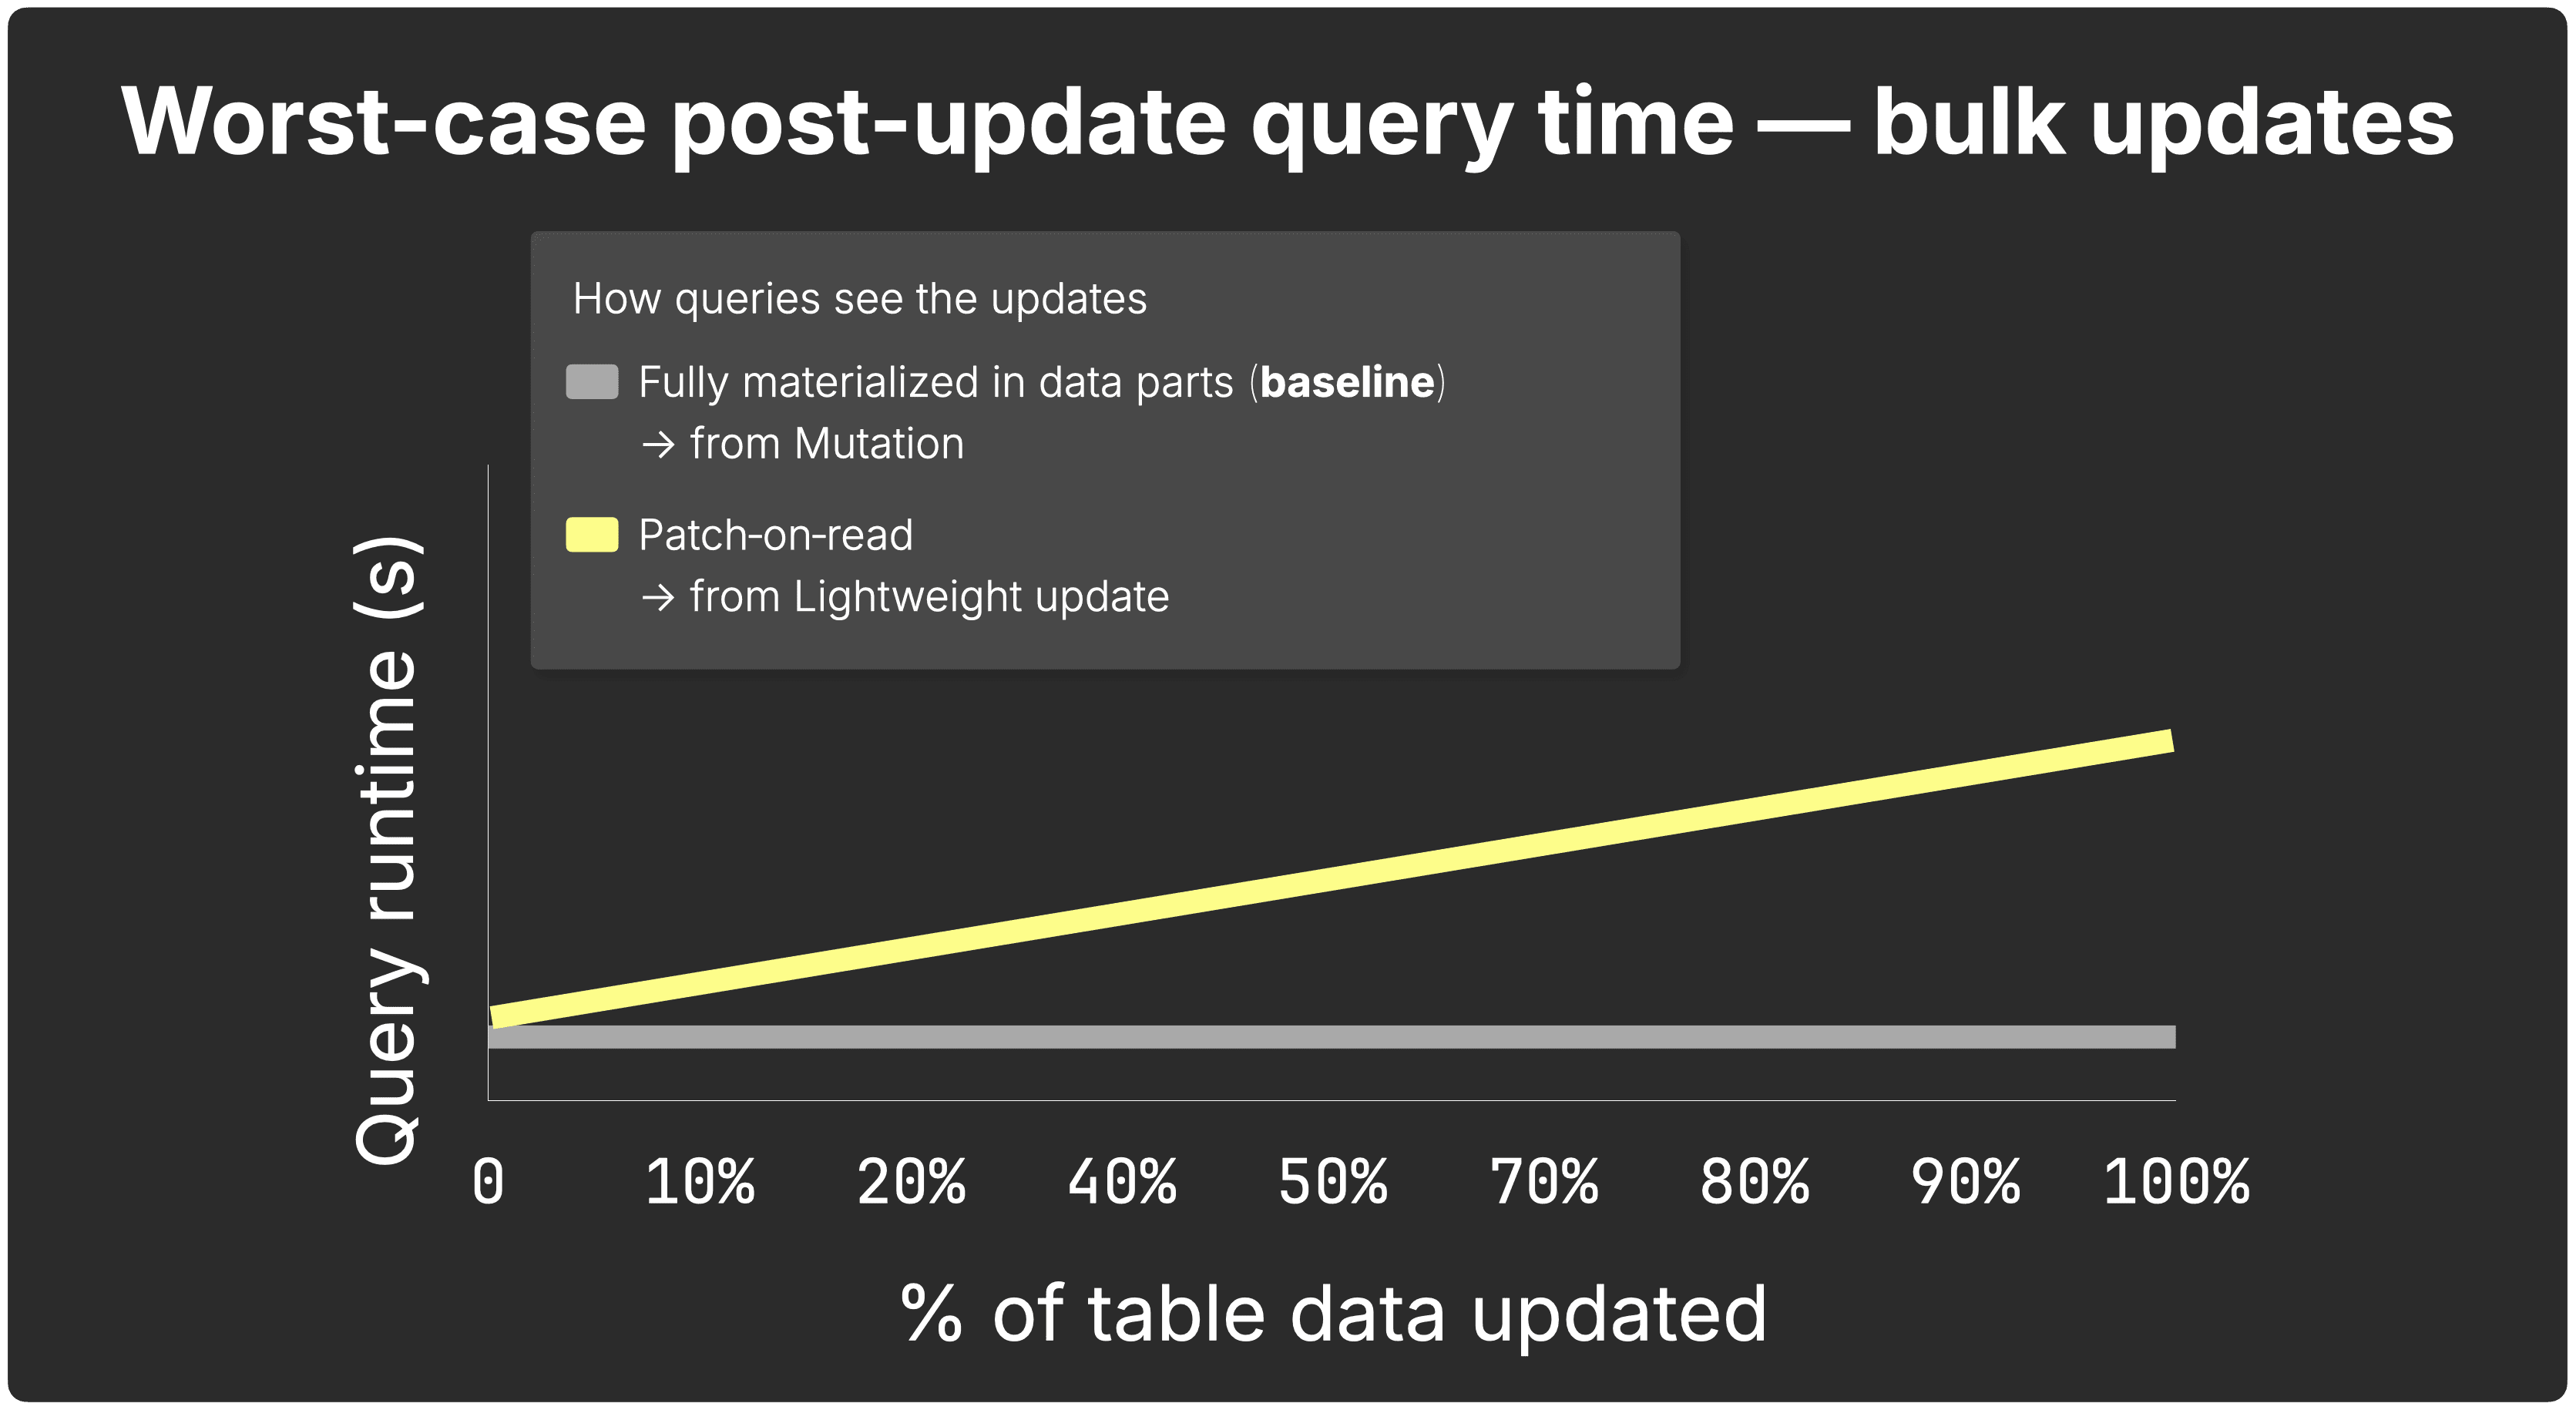
Chart 2 – query runtime after a bulk update #
Chart 2 estimates how one representative query slows down after a bulk (multi-row) update before the update is fully materialized.
-
With a synchronous mutation, the data parts are rewritten before the query runs, so runtime stays flat.
-
With patch-on-read, ClickHouse overlays the patch part during execution; as the patch grows, the query slows proportionally.
Therefore, use lightweight updates for small, frequent bulk changes (up to ~10% of the table): patch-on-read introduces a query slowdown as the patch part grows, but once the background merge completes, you’re back to baseline performance. For anything larger, stick with classic (synchronous) mutations.
Patch-on-read modes: fast vs. join fallback #
We saw earlier that with our dataset, when patch parts are applied via patch‑on‑read in fast‑merge mode—that is, while the original source part still exists—the slowdown ranges from 8% to 21%, with an average of 15.3%.
As explained in Part 2, in most cases the source parts of a patch still exist, both when the patch is eventually materialized by the next background merge, and when it is applied in‑memory via patch‑on‑read if a query runs before that merge occurs.
Rarely, a benign timing overlap occurs: a patch part is created for the snapshot of source parts at UPDATE start, but if those parts are merged concurrently to writing the patch, the patch is now targeting source parts that are no longer active (for patch-on-read in fast merge mode).
Then ClickHouse automatically falls back to patch‑on‑read in slower join‑mode, which, as we saw earlier, has higher overhead: 39% to 121%, averaging 68% in our benchmark. This mode performs an in‑memory join between the patch and the merged data.
How we measured – slower join‑mode patch‑on‑read (click to expand)
To measure this scenario explicitly, we forced a self‑merge of the table’s single data part with apply_patches_on_merge disabled . The merge rewrote the part with a new name, invalidating the patch’s source index and triggering slower join‑mode fallback at query time.
Why ReplacingMergeTree inserts excel at raw speed #
ReplacingMergeTree models an update as inserting a new row, writing only the new row to disk.
-
No lookup is required to find the old row, which makes this the fastest update method in practice.
-
In our benchmarks, updates typically completed in 0.03 – 0.04 s, up to 4,700× faster than classic mutations.
Lightweight updates are nearly as fast #
With single‑row (point) UPDATEs, lightweight updates write a tiny patch part to disk, often just a few dozen bytes.
-
First, ClickHouse locates the row being updated in the original part to generate its targeting metadata: _part, _part_offset, _block_number, _block_offset, and _data_version.
-
Then it writes only the updated values plus that small metadata patch.
This extra lookup makes lightweight updates slightly slower than ReplacingMergeTree inserts, but much more efficient at query time, because patch‑on‑read knows exactly which rows to overlay.
We’ll contrast this behavior with ReplacingMergeTree mechanics in the next section.
Why FINAL is slower than patch-on-read #
FINAL queries must discover the latest rows; patch-on-read queries already know where those rows live.
Two quick visuals show the difference. #
Diagram 1 – FINAL: ClickHouse can’t tell which part has the latest row, so it loads the parts, merges them on-the-fly in memory, and keeps only the newest rows per sorting key before the query engine processes the data further.
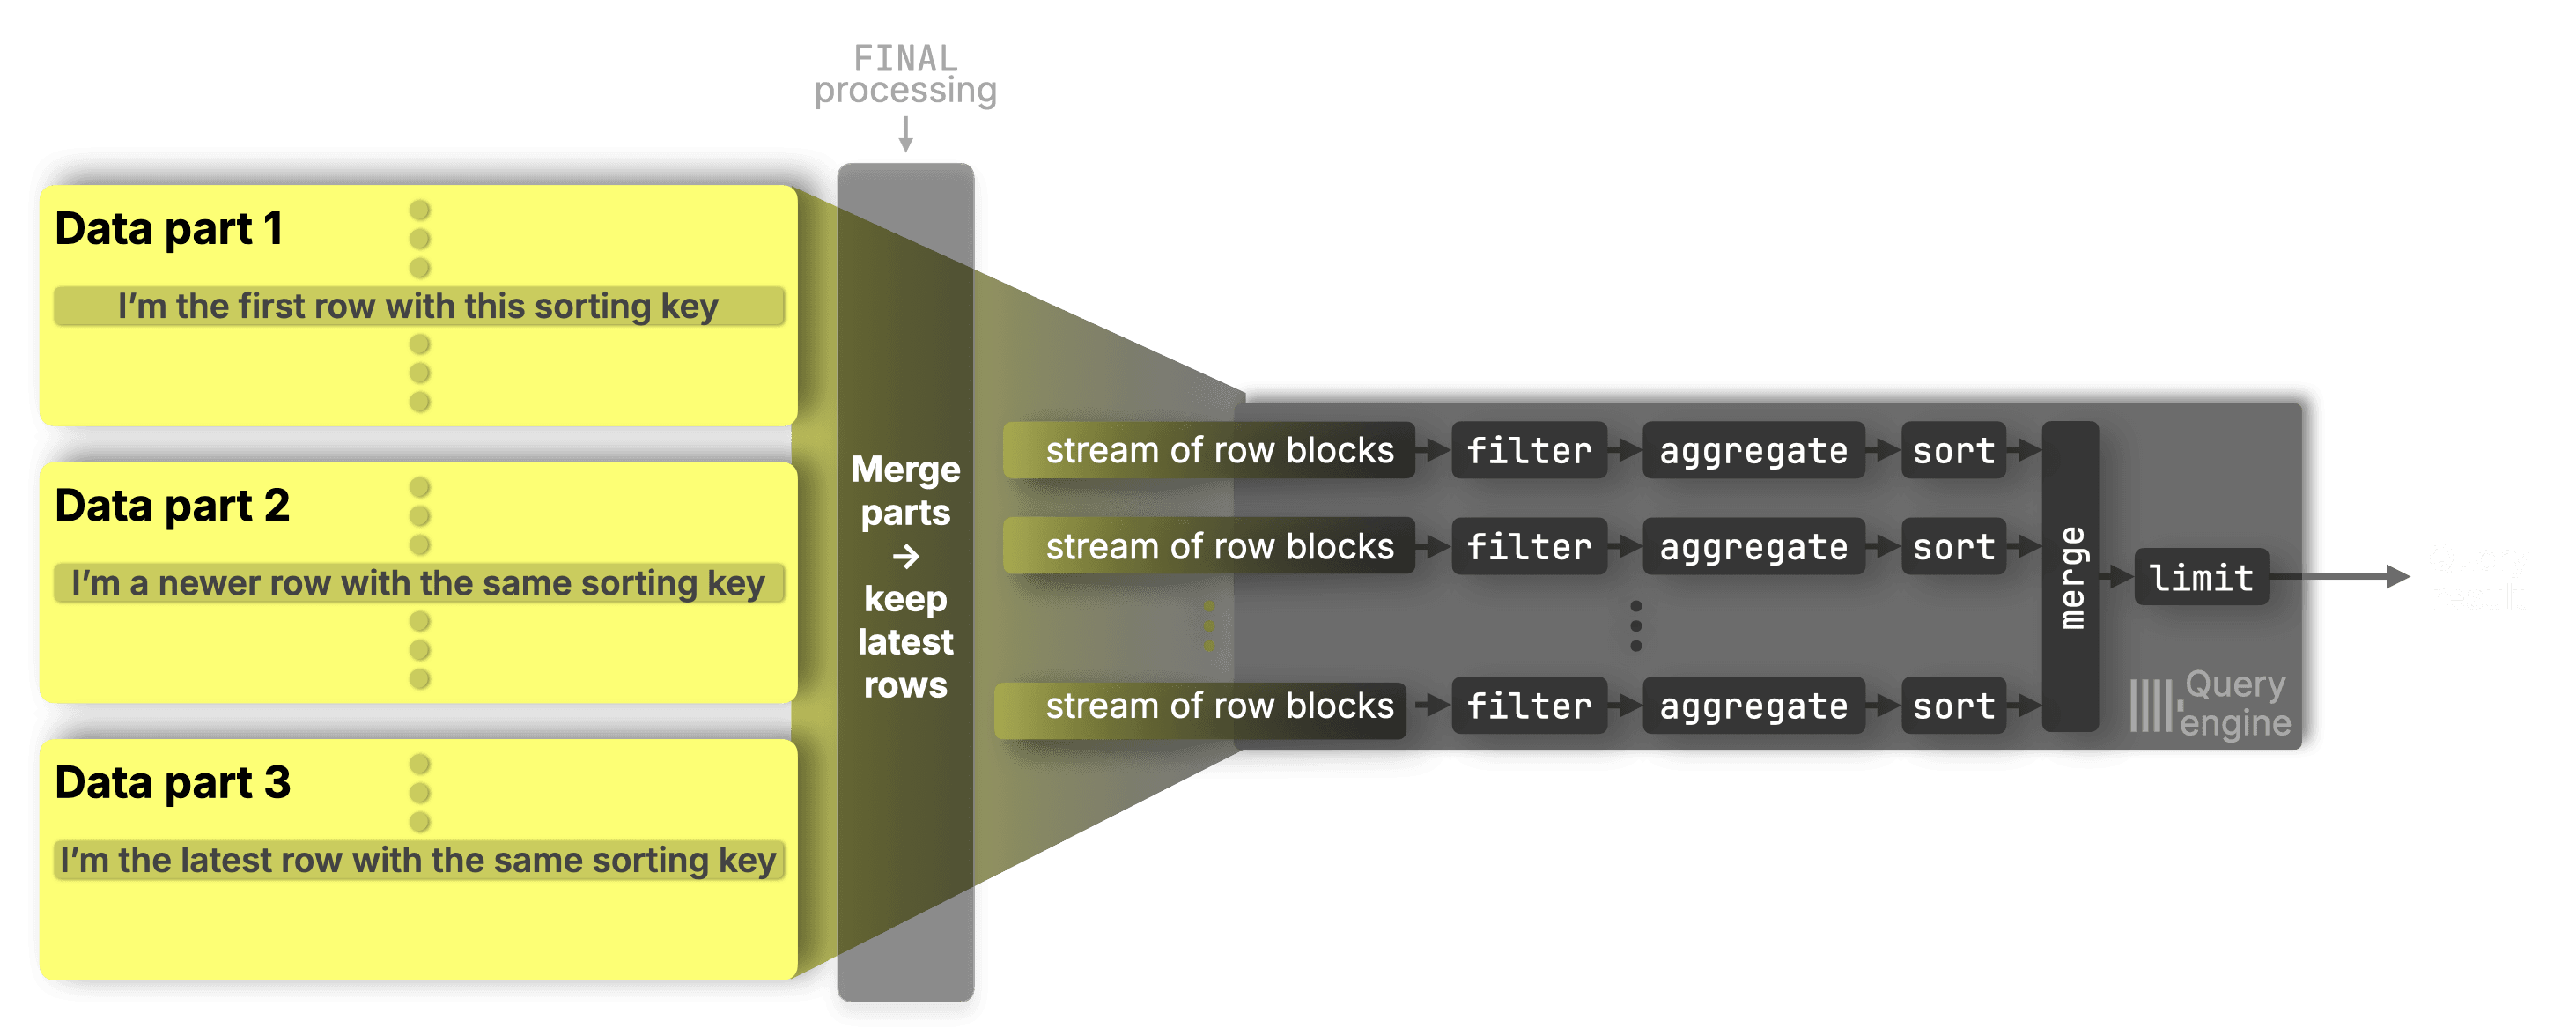
We won’t go into detail here, but the FINAL merge process has been heavily optimized in recent years. There are also best practices to help minimize the amount of work required during FINAL processing.
Diagram 2 – patch-on-read: Patch parts tell ClickHouse exactly which rows changed, so it overlays only those rows on-the-fly in memory, no broad merge is needed.
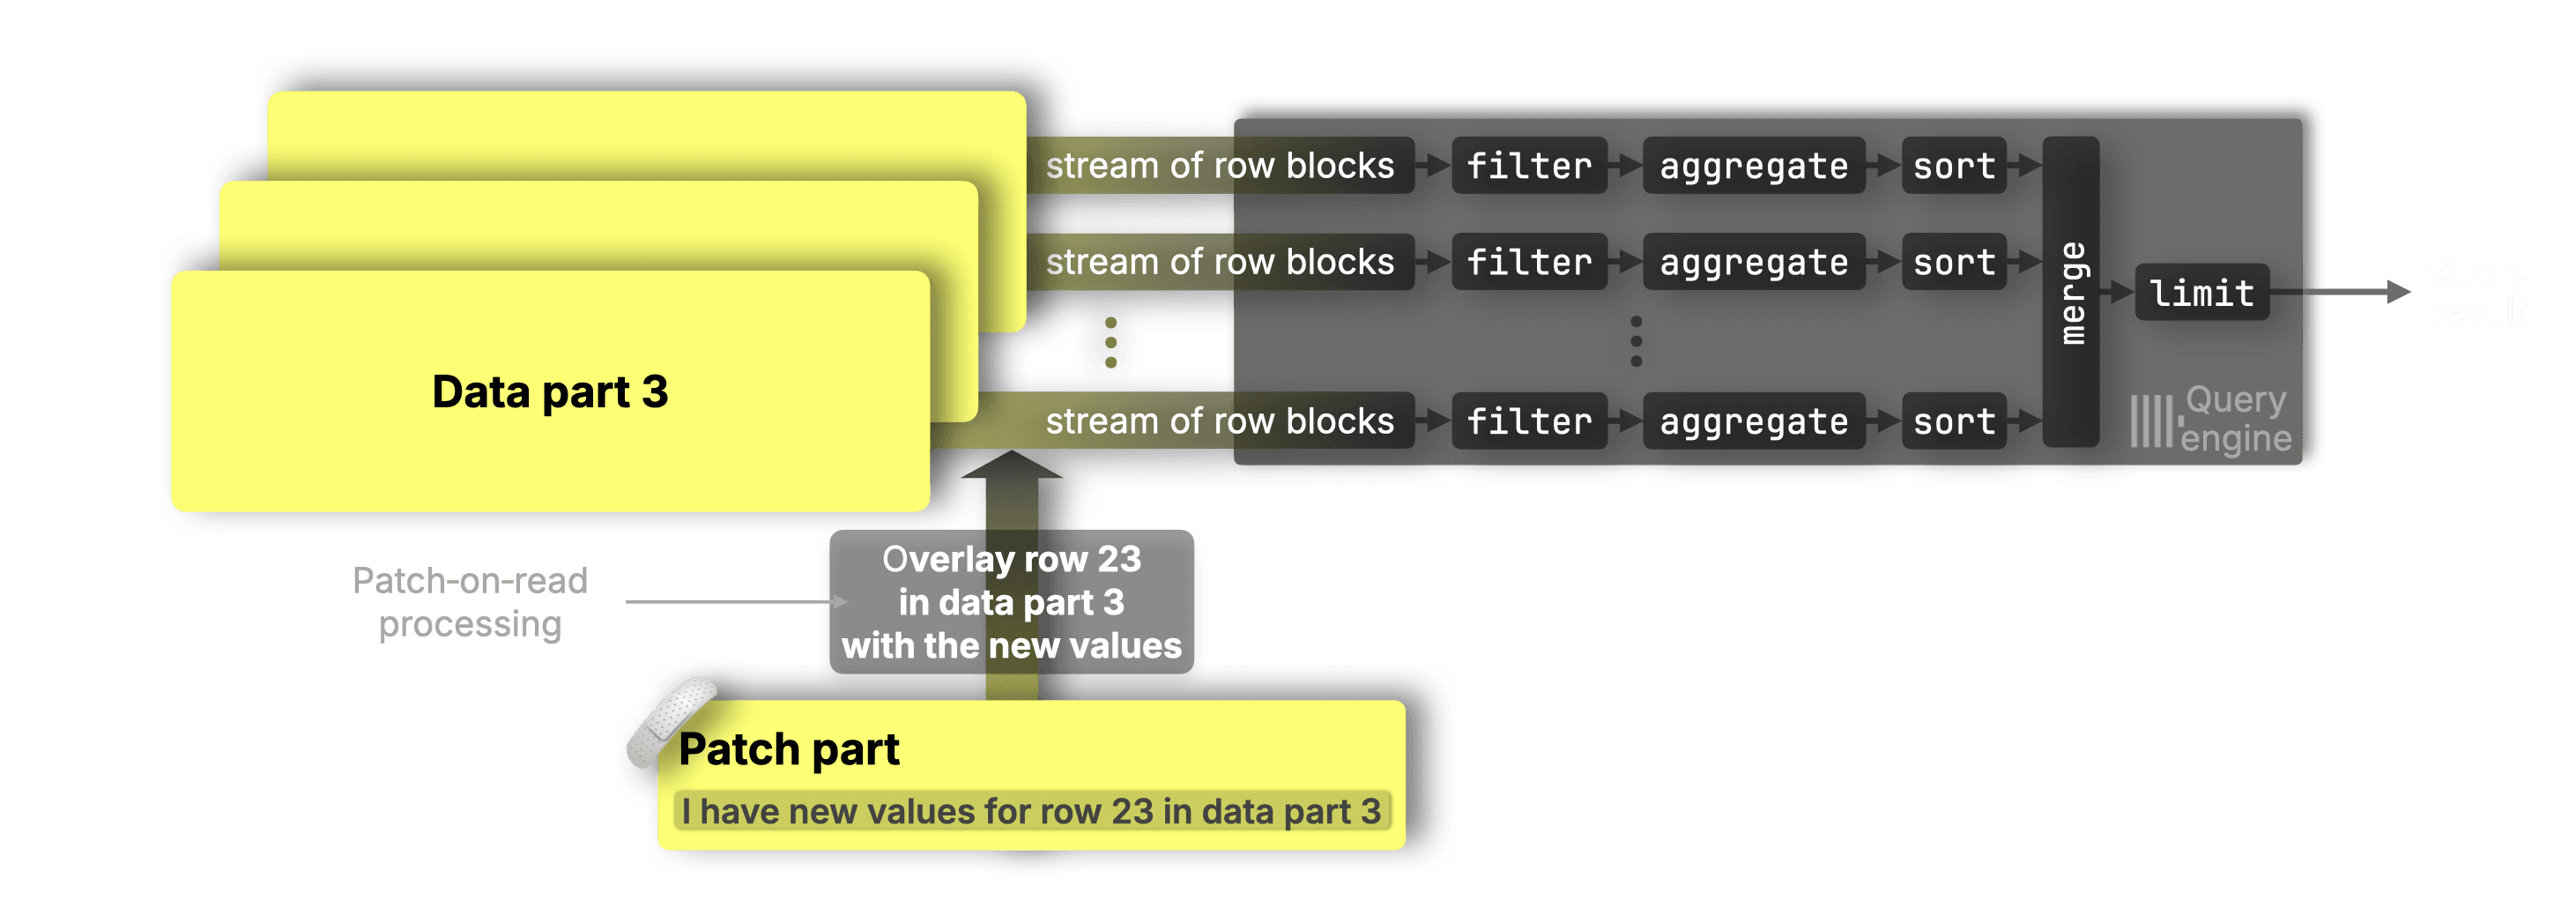
Patch parts reference their target rows precisely via _part, _part_offset, _block_number, and _block_offset, enabling a truly surgical, targeted overlay.
Quick summary table #
| FINAL (ReplacingMergeTree) | Patch-on-read (Lightweight updates) |
|---|---|
| Doesn’t know which parts contain the latest row versions. | Knows exactly which rows are updated and where they are stored (patch parts). |
| Must merge all candidate ranges across all parts and resolve the latest version by sorting key and insertion time. | Patch parts directly reference the rows they update via _part, _part_offset, _block_number, and _block_offset. |
| Row-version resolution is broad and exploratory, requiring heavy processing. | Merging is surgical and targeted, overlaying only the known updated rows. |
| Historically much-slower than normal reads; it’s now heavily optimized, but still heavier than patch-on-read. | Highly efficient, lightweight, and predictable. |
With the mechanics clear, here’s a quick side‑by‑side recap to tie it all together.
UPDATE methods at a glance #
Before we wrap up, here’s how the UPDATE methods compare at a glance:
-
Classic mutations — slowest path; rewrite full columns on disk before queries can see the new data.
-
On-the-fly mutations — instant; store update expressions in memory, slower queries.
-
ReplacingMergeTree inserts — fast to write, but add query overhead with FINAL.
-
Lightweight updates — almost as fast as an INSERT, while keeping query impact low.
Cheat‑sheet: Here’s where each update method shines, and what it costs.
| Method | Best for | Worst‑case query hit | Caveat |
|---|---|---|---|
| Mutation | Large, infrequent bulk changes | baseline | Slow to apply |
| On‑the‑fly mutation | Ad‑hoc large changes requiring immediate visibility | ↑ 12–427 % | Still rewrites parts later; queries slow if many stack |
| ReplacingMT + FINAL | High‑frequency single‑row updates | ↑ 21–550 % | Requires FINAL clause |
| Lightweight update (patch parts) | High‑frequency small updates (≤ 10 % of table) | ↑ 7–21 % | Slower join‑mode if sources merged away |
With the mechanics clear and side-by-side results in hand, here’s what it all means for real workloads.
ClickHouse updates at 1,000× speed: Key takeaways #
ClickHouse now supports standard SQL UPDATEs, implemented as lightweight updates with patch parts, an approach that finally closes a long‑standing gap in column‑store performance.
In our benchmarks:
-
Bulk SQL UPDATEs were up to 1,700× faster than classic mutations
-
Single‑row SQL UPDATEs reached 2,400× faster
-
All with only modest (worst-case) query overhead
This means:
-
High‑frequency small updates using familiar SQL syntax, without slowing queries
-
Instantly visible changes for real‑time and streaming workloads
-
Scalable pipelines that mix batch and interactive updates seamlessly
ClickHouse can now handle update patterns that were previously reserved for row‑stores, while still excelling at analytical workloads.
All benchmark scripts and queries are on GitHub.
This concludes our three‑part series on building fast UPDATEs for the ClickHouse column store.
If you missed the earlier posts, check out Part 1: Purpose-built engines and Part 2: SQL‑style UPDATEs.


