 50.5k
50.5k
Companies start with PostgreSQL as their system of record. The data's already there, so teams naturally extend that same database into internal reporting, BI dashboards, and eventually customer-facing analytics.
The question is how far PostgreSQL can carry analytical load before you need a dedicated analytical serving layer.
Start with PostgreSQL, isolate analytics with indexes and replicas, watch for measurable performance breakpoints, then introduce ClickHouse incrementally for heavy analytical workloads.
TL;DR
- PostgreSQL is often the right starting point for analytics when reporting workloads are moderate and latency, concurrency, and cost targets are still being met.
- Add ClickHouse when PostgreSQL analytics hit measurable limits such as slow scan-heavy queries, replica lag, high dashboard concurrency, rising I/O, or growing maintenance overhead.
- Use PostgreSQL and ClickHouse together rather than replacing PostgreSQL: keep PostgreSQL as the transactional system of record and replicate selected data to ClickHouse for high-performance OLAP and customer-facing analytics.
- Migrate incrementally with CDC: start with one analytics workload, model it for ClickHouse, validate freshness and correctness, then gradually shift dashboards or APIs once performance targets are met.
PostgreSQL as an analytical starting point
PostgreSQL becomes the default analytics system because the operational data already lives there. Developers know the SQL dialect. Its ecosystem around constraints, transactions, and joins is mature.
Reporting workloads with bounded queries and low concurrency can run well on PostgreSQL with planner statistics, work_mem, parallel query, and autovacuum tuning. Internal admin dashboards, operational reporting, low-concurrency BI tools, precomputed summaries, queries bounded by time or tenant ID. All of this works.
PostgreSQL uses a row-oriented heap that stores complete tuples together with MVCC visibility information. Selective point lookups are accelerated by indexes, while PostgreSQL's transaction machinery, WAL, locking, and MVCC provide transactional correctness.
When analytical queries must scan many rows and cannot use an index-only plan, PostgreSQL may need to read heap tuples that contain more columns than the query needs and evaluate visibility metadata. This architectural mismatch becomes visible as data volume, query complexity, and dashboard concurrency grow.
The PostgreSQL tuning path before ClickHouse
Delay introducing a second database until maintaining analytics inside PostgreSQL costs more than managing a new system.
First, exhaust the native tuning path. Inspect query plans using EXPLAIN ANALYZE and run VACUUM ANALYZE to ensure planner statistics are current.
Tune work_mem carefully. It applies per sort or hash operation and multiplies across parallel workers, which can quickly exhaust memory.
Adjust parallel query settings so expensive scans can use workers without starving operational traffic. And monitor autovacuum to control dead tuples and bloat.
PostgreSQL ecosystem options for scaling analytics
| Option | Helps when | Stops helping when | Decision criteria |
|---|---|---|---|
| B-tree / covering indexes | Queries filter or join on selective columns. | Too many indexes slow writes, increase storage, and add maintenance overhead. | Use for high-value recurring queries with selective access patterns. |
| BRIN indexes | Large append-only or time-series tables are physically correlated with filter columns. | Data is randomly distributed or filters require many unrelated columns. | Good first optimization for ordered fact tables. |
| Partitioning | Queries reliably prune by time, tenant, or lifecycle. | Queries scan many partitions or partition maintenance becomes complex. | Use when pruning is predictable and operational overhead is low. |
| Materialized views / summary tables | Dashboards can tolerate precomputed data and refresh windows. | Refresh duration approaches the reporting interval or dashboard variants multiply. | Use for stable recurring metrics; avoid view sprawl. |
| Read replicas | Reporting needs isolation from the primary and can tolerate lag. | Analytical scans saturate replica CPU/I/O or lag grows during dashboard use. | Use for workload isolation, not as a columnar OLAP substitute. |
| TimescaleDB | Time-series workloads benefit from hypertables, compression, retention policies, and continuous aggregates. | The workload is not primarily time-oriented or cannot benefit from time-based partitioning and continuous aggregates. | Use when time-series modeling and PostgreSQL compatibility are central requirements. |
| Citus | You need distributed PostgreSQL and can shard and colocate related data using a suitable distribution key. | Cross-shard joins or aggregations require substantial repartitioning because the relevant data cannot be colocated. | Use when PostgreSQL compatibility and horizontal scale around a well-defined distribution key matter. |
| PostgreSQL columnar extensions | You want limited columnar acceleration without leaving PostgreSQL workflows. | Feature coverage, write-path tradeoffs, and operational maturity vary by extension, so validate the exact extension against your workload. | Useful as a bridge when a full analytical serving layer would be premature. |
These PostgreSQL ecosystem scaling options are worth trying first. You hit the breakpoint when indexes, replicas, views, and partitions stop improving user-facing analytics enough to justify the escalating maintenance cost.
Diagnosing diminishing returns in PostgreSQL analytics
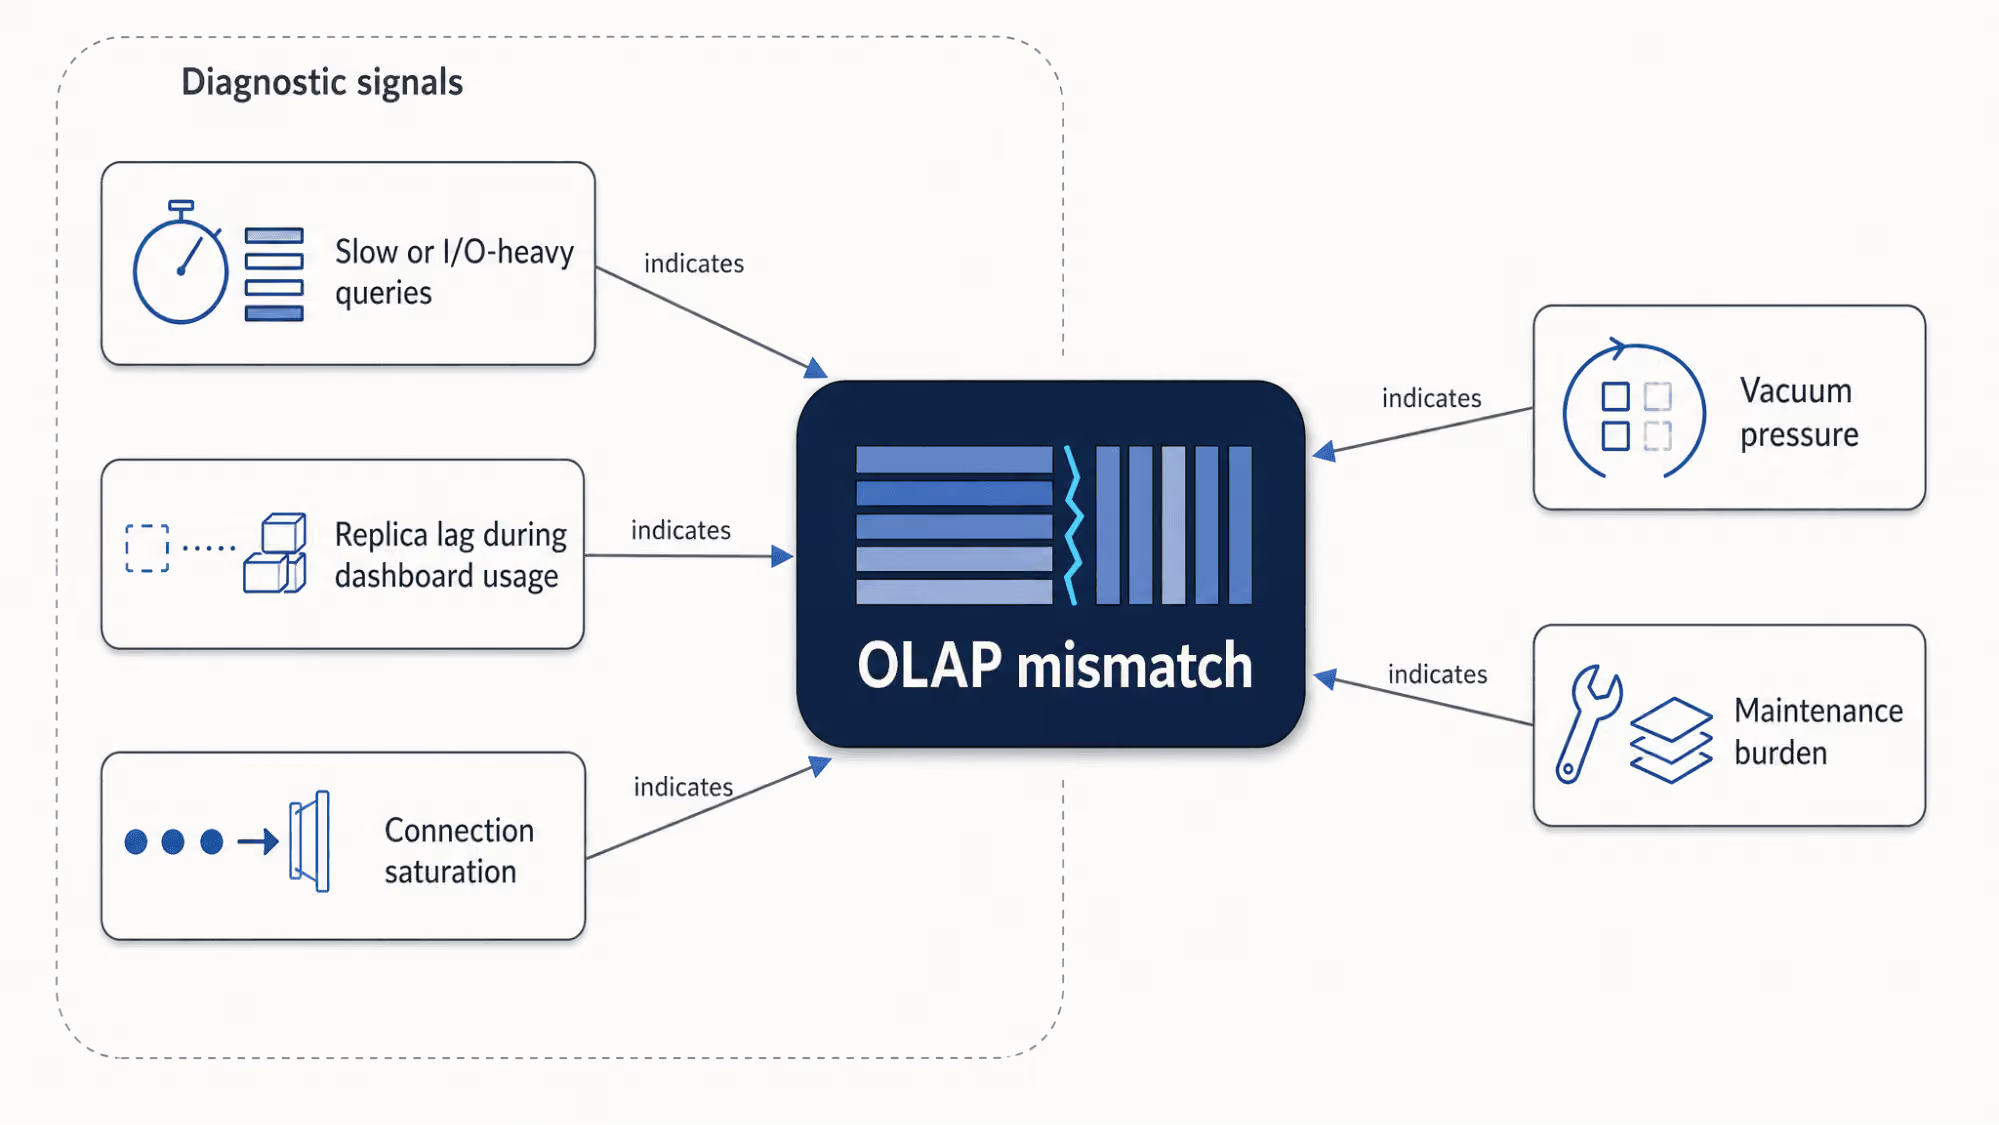
You can identify when PostgreSQL analytics hit a performance wall by monitoring specific workload diagnostics.
Diagnostic 1: analytical queries are slow or I/O-heavy
First, make sure pg_stat_statements is active. If it is not already enabled, add pg_stat_statements to the existing shared_preload_libraries list, restart PostgreSQL, and run CREATE EXTENSION pg_stat_statements; in the database you will query. Managed services may enable the module by default or expose the preload setting through provider-specific controls. Then use the view to find expensive recurring queries:
SELECT
queryid,
calls,
round(total_exec_time::numeric / 1000, 2) AS total_seconds,
round(mean_exec_time::numeric, 2) AS mean_ms,
rows,
round((
shared_blk_read_time + shared_blk_write_time
+ local_blk_read_time + local_blk_write_time
+ temp_blk_read_time + temp_blk_write_time
)::numeric, 2) AS io_ms,
left(query, 180) AS query_sample
FROM pg_stat_statements
ORDER BY total_exec_time DESC
LIMIT 10;Queries with high total execution time or high measured block I/O, assuming track_io_timing is enabled, are candidates for further investigation. The rows column reports rows retrieved or affected, not rows scanned. Use EXPLAIN (ANALYZE, BUFFERS) to determine scan volume before deciding whether to rewrite, index, or move a query.
Diagnostic 2: read replica lag increases during dashboard usage
For replica health, inspect pg_stat_replication:
SELECT
application_name,
state,
sync_state,
pg_size_pretty(pg_wal_lsn_diff(pg_current_wal_lsn(), replay_lsn)) AS replay_lag_size
FROM pg_stat_replication
ORDER BY pg_wal_lsn_diff(pg_current_wal_lsn(), replay_lsn) DESC;Read replicas isolate reads from the primary and are eventually consistent, but they don't change PostgreSQL's row-store scan behavior. If read replica lag grows significantly during reporting windows, the replica absorbs pressure but fails to solve the underlying OLAP bottleneck.
Diagnostic 3: dashboard concurrency saturates PostgreSQL connections
Use pg_stat_activity to inspect active sessions, wait events, and connection pressure:
SELECT
datname,
state,
wait_event_type,
count(*) AS connections
FROM pg_stat_activity
GROUP BY 1, 2, 3
ORDER BY connections DESC;PostgreSQL handles transactional concurrency gracefully. But simultaneous analytical scans easily exhaust I/O, CPU, and connection pools. If PgBouncer queue times spike during dashboard usage, your analytics tier is saturated.
Diagnostic 4: long-running analytical queries create vacuum pressure
Inspect pg_stat_activity to find long-running transactions:
SELECT
pid,
state,
wait_event_type,
now() - xact_start AS xact_age,
left(query, 180) AS query_sample
FROM pg_stat_activity
WHERE xact_start IS NOT NULL
ORDER BY xact_age DESC
LIMIT 10;Long-running transactions can keep snapshots open and delay the removal of dead row versions they may still need. On replicas, hot_standby_feedback can prevent cleanup-related recovery conflicts from canceling standby queries, but it does not prevent every type of WAL-replay conflict and can contribute to bloat on the primary.
Diagnostic 5: PostgreSQL maintenance increases without proportional analytics gains
Watch for administrative fatigue: more reporting indexes to maintain, longer materialized view refresh jobs, complex partition management, and rising DBA time spent keeping analytics stable.
The PostgreSQL analytics breakpoint is often both an operational and a latency problem.
Also monitor buffer-cache hit ratio during reporting windows, sequential-scan frequency on large tables, materialized-view refresh duration against freshness requirements, and dead-tuple percentage on heavily updated tables.
Why ClickHouse fits the analytical serving layer
Once PostgreSQL-native options hit diminishing returns, ClickHouse becomes the analytical serving layer for scan-heavy, high-concurrency workloads.
PostgreSQL stores each tuple's columns together. Its transaction machinery, WAL, locking, and MVCC provide ACID transaction semantics, while indexes accelerate selective point lookups. ClickHouse stores column values separately to optimize analytical scans.
For analytical queries, ClickHouse can read the requested data columns rather than full rows. Columnar storage can improve compression for analytical workloads, reducing I/O.
ClickHouse processes queries using vectorized execution, operating on batches of column data rather than individual rows. This can improve CPU cache efficiency.
Its MergeTree storage engine sorts each data part according to the table's ORDER BY expression and uses a sparse primary index to skip granules. Partitioning is optional, and data-skipping indexes are optional secondary structures that can provide additional pruning.
ClickHouse is designed for real-time dashboards, customer-facing analytics, high-ingest observability workloads, and high-cardinality time-series aggregations. These workloads often outgrow traditional row-store architectures because they combine large scans, many dimensions, frequent ingestion, and high dashboard concurrency.
ClickHouse handles the analytical serving layer, while PostgreSQL remains the system of record for transactional workflows. Use each database for the workload it was designed to handle.
Alternatives to ClickHouse for analytics
| Category | Good fit when | Watchouts | When ClickHouse is preferable |
|---|---|---|---|
| PostgreSQL replicas, indexes, partitions | You need near-term reporting improvements while staying in PostgreSQL. | Maintenance grows; replicas do not remove row-store scan costs. | Analytics need high concurrency or fast scans over history and can tolerate an eventually consistent analytical copy whose freshness depends on the selected CDC pipeline. |
| Citus / PostgreSQL scale-out | You want to stay in the PostgreSQL ecosystem with distributed semantics. | Best results depend on shard keys, time-based access, and operational expertise. | Event analytics span many tenants, dimensions, or high-cardinality attributes. |
| clickhouse-local / DuckDB | You need single-node analytical SQL over files or application data without running a server. | clickhouse-local is for ad hoc analysis and file processing; DuckDB's primary read-write model is single-process. | Dashboards or APIs need an always-on service for continuous ingestion, high availability, or many independent clients. |
| Snowflake / BigQuery / cloud warehouses | You need centralized enterprise analytics, ELT, BI, data-science workflows, or provider-specific interactive acceleration. | For user-facing serving, validate workload-specific latency, concurrency, sizing or queueing behavior, and compute cost; capabilities differ by provider and feature. | Prefer ClickHouse when continuously ingested, user-facing analytics is the primary workload and measured tail latency, concurrency, and cost favor a dedicated ClickHouse serving layer. |
| Druid / Pinot | You need low-latency OLAP for event streams with dedicated ingestion models. | Operational model and SQL ecosystem differ from PostgreSQL. | You want a columnar OLAP database with strong SQL support and broad deployment. |
Total cost of ownership factors to evaluate
Evaluate each architecture with current provider pricing and measured resource use. Normalize the required compute, storage, replication or data-movement services, retention, availability topology, and operational requirements before comparing totals.
Adding ClickHouse incrementally to PostgreSQL
PostgreSQL remains the system of record, while ClickHouse serves analytical queries. For an incrementally updated analytical copy, data flows from PostgreSQL to ClickHouse through CDC. When ClickHouse Cloud is the analytical destination, ClickPipes for Postgres can replicate selected tables from a managed or self-hosted PostgreSQL source into a ClickHouse Cloud service. Self-managed ClickHouse deployments require a separately operated CDC pipeline, such as PeerDB OSS, or another compatible tool.
PostgreSQL CDC pipelines typically use logical decoding to read changes from the Write-Ahead Log (WAL). Initial snapshots add load to the source, and a stalled consumer can cause its replication slot to retain WAL and increase storage use. If WAL retention is capped, prolonged lag can instead invalidate the replication slot and require recovery or resynchronization.
CDC creates an eventually consistent analytical copy. Observed lag depends on source load, polling or batching configuration, network conditions, and destination health. For the built-in "Sync to ClickHouse" integration in ClickHouse Managed Postgres, ClickHouse documents a default 60-second sync interval. That interval controls how often ClickPipes polls PostgreSQL; it is not an end-to-end freshness guarantee. Validate observed lag against your Service Level Objectives.
Step-by-step migration sequence from PostgreSQL to ClickHouse
- Choose one bounded workload: Start with one dashboard, API endpoint, or recurring report that is missing a measured latency, freshness, or resource target.
- Design the ClickHouse model: Choose the source tables to replicate and decide how updates and deletes will be represented. Determine where denormalization belongs, whether partitioning is needed, and which
ORDER BYkeys support the target queries. When using ClickPipes, follow its ordering-key requirements so custom keys preserve CDC deduplication. Do not copy the normalized PostgreSQL schema unchanged. - Coordinate initial load and CDC: Use a pipeline that coordinates its historical snapshot with the PostgreSQL WAL position from which continuous replication begins. In ClickHouse Cloud, ClickPipes' Initial load + CDC mode handles this sequence. If you perform a separate manual backfill, coordinate its consistent snapshot with the replication slot and log sequence number (LSN).
- Monitor the pipeline: Monitor source load, replication-slot WAL retention, initial-load progress, replication lag, pipeline errors, and destination ingestion health.
- Validate correctness: Wait until the initial load finishes and CDC lag is within the accepted freshness window. Compare source and destination results from the same validation window so normal replication lag is not mistaken for drift. For the default ClickPipes
ReplacingMergeTreetargets, compare PostgreSQL's current-state count withSELECT count(*) FROM your_table FINAL WHERE _peerdb_is_deleted = 0in the ClickHouse Cloud destination. Then compare business metrics and dashboard outputs. - Cut over gradually: Move one panel or tenant cohort behind a feature flag. Remove only the PostgreSQL reporting indexes, summary tables, or replicas that no remaining workload uses, and only after sustained validation and a rollback window.
If your application strictly requires querying ClickHouse through a PostgreSQL interface, the pg_clickhouse extension lets you configure foreign tables in PostgreSQL. But performance heavily depends on query pushdown support.
Current pg_clickhouse v0.10.0 coverage reports 16 of 22 TPC-H queries fully pushed down. Validate current pushdown support with EXPLAIN (VERBOSE) against your workload because unsupported expressions may still require PostgreSQL to fetch rows and execute part of the plan locally.
Schema design for PostgreSQL-to-ClickHouse analytics
A direct lift-and-shift of a Third Normal Form PostgreSQL schema may not be the final analytical model. PostgreSQL schemas often prioritize write integrity and normalized relationships. In ClickHouse, model the serving layer around analytical queries. With CDC, first land source tables using update-aware engines, then add joins, dictionaries, or derived denormalized tables where measurements justify them.
Example PostgreSQL schema: normalized transactional model
CREATE TABLE users (
id BIGSERIAL PRIMARY KEY,
plan TEXT NOT NULL
);
CREATE TABLE orders (
id BIGSERIAL PRIMARY KEY,
user_id BIGINT NOT NULL REFERENCES users(id),
status TEXT NOT NULL,
amount_cents BIGINT NOT NULL,
created_at TIMESTAMPTZ NOT NULL
);Example ClickHouse schema: CDC-replicated current-state table
CREATE TABLE orders_cdc
(
id Int64,
user_id Int64,
status LowCardinality(String),
amount_cents Int64,
created_at DateTime64(6, 'UTC'),
_peerdb_synced_at DateTime64(9) DEFAULT now64(),
_peerdb_is_deleted Int8,
_peerdb_version Int64
)
ENGINE = ReplacingMergeTree(_peerdb_version)
PRIMARY KEY id
ORDER BY id;This ClickPipes target schema in ClickHouse Cloud models the current state of the mutable PostgreSQL orders table, not an append-only stream of order events. ClickPipes adds the _peerdb_version and _peerdb_is_deleted columns and uses the PostgreSQL primary key as the ClickHouse ordering key. It does not automatically denormalize users.plan into each order.
If you add analytical columns to a CDC table's ORDER BY, use only columns that remain immutable for each source row and retain the PostgreSQL primary key in the deduplication key. Do not include mutable columns such as status. For more flexible analytical ordering, build a downstream table or refreshable materialized view over the deduplicated CDC data.
ClickHouse supports JOIN operations. For dimensions such as user_plan, choose among query-time joins, dictionaries, or a downstream denormalized table based on update frequency and measured query latency.
Incremental ClickHouse materialized views process newly inserted blocks, not the final result of later ReplacingMergeTree deduplication. Because CDC updates and deletes arrive as new versions, a naive incremental sum or count can double-count updates or fail to reverse deletes. For current-state rollups, use version-aware aggregation or a refreshable materialized view that reads deduplicated rows with FINAL and filters _peerdb_is_deleted = 0. Use incremental materialized views directly only when the source semantics make append-only aggregation correct.
PostgreSQL uses MVCC to represent changing row state. ClickPipes represents each PostgreSQL update or delete as another inserted version in a target ReplacingMergeTree table. _peerdb_version identifies the newest version, while _peerdb_is_deleted marks a delete.
Background deduplication is asynchronous. Correctness-sensitive current-state queries should use FINAL and filter _peerdb_is_deleted = 0, or query a tested deduplicated view. These choices introduce freshness and performance tradeoffs that should be validated against representative data and queries.
Managed operating models for PostgreSQL and ClickHouse
Adopting this architecture requires choosing how to operate both systems.
| Managed pattern | Best fit | Tradeoffs |
|---|---|---|
| Self-managed PostgreSQL + self-managed ClickHouse | Teams with strong SRE expertise and strict infrastructure control requirements. | Maximum control, highest operational burden for HA, backups, and pipelines. |
| Managed PostgreSQL + ClickHouse Cloud | Teams that want lower operational overhead while retaining their existing managed PostgreSQL provider. | Requires cross-service networking and CDC configuration. ClickPipes can replicate from supported externally managed PostgreSQL services into ClickHouse Cloud, but operational ownership and support still span providers. |
| ClickHouse Managed Postgres + ClickHouse Cloud | Teams that want an integrated path for the PostgreSQL-for-OLTP and ClickHouse-for-OLAP pattern. | Both services are managed through ClickHouse Cloud, but the Postgres and ClickHouse analytical services are billed separately; CDC modeling is still required. |
ClickHouse Managed Postgres is a fully managed PostgreSQL service backed by local NVMe storage. It provides high availability and point-in-time recovery, plus a built-in ClickPipes path into a selected ClickHouse Cloud service.
For teams implementing a unified stack, this model provides local NVMe storage and a managed path into ClickHouse Cloud for analytical offloading, but teams still need to model schemas, choose replicated tables, and validate CDC lag.
Choosing between PostgreSQL, PostgreSQL tuning, and ClickHouse
| Requirement / symptom | Stay on PostgreSQL | Tune or isolate PostgreSQL | Add ClickHouse for analytics |
|---|---|---|---|
| Transactional integrity | Best fit. PostgreSQL remains the system of record. | Still best fit. | Keep PostgreSQL; do not move OLTP to ClickHouse. |
| Internal reporting | Good fit when reports are infrequent and bounded. | Good fit with indexes, summaries, and replicas. | Consider ClickHouse when reports become scan-heavy or concurrency-sensitive. |
| Customer dashboards | Good fit while measured latency and concurrency targets hold. | Indexes, summaries, connection pooling, and replicas can extend headroom when query patterns are predictable. | Consider ClickHouse when scan-heavy or concurrent dashboard queries repeatedly miss measured latency or resource targets. |
| High-ingest analytics | Good fit when ingestion and analytical query load remain within resource and latency targets. | Batching, partitioning, and workload isolation can extend headroom for predictable access patterns. | Consider ClickHouse for large append-heavy event or time-series workloads when sustained ingestion and analytical scans compete for PostgreSQL resources. |
| Fresh analytical data | Good fit when querying current transactional state. | Replicas and materialized views introduce lag or refresh windows. | Good fit when an eventually consistent analytical copy is acceptable and the selected CDC pipeline meets the required freshness target. |
| Operational simplicity | Simplest at small scale. | Complexity rises with indexes, replicas, views, and vacuum tuning. | Adds a second system, but cleanly separates OLTP and OLAP responsibilities. |
| Cost profile | Lowest at small scale. | Can rise through larger instances, storage, and DBA time. | Efficient for sustained analytical serving, but requires CDC modeling work. |
Recommendation summary:
- Stay on PostgreSQL if analytics are infrequent, data volume is moderate, and reporting doesn't impact OLTP latency.
- Tune PostgreSQL if you need short-term improvements and have the operational capacity to manage summary tables and read replicas.
- Add ClickHouse if measured analytical load causes dashboard latency to miss documented targets, replica lag to exceed freshness requirements, analytical scans to dominate I/O, or PostgreSQL maintenance effort no longer produces proportional performance gains.
Conclusion: when to choose ClickHouse for PostgreSQL analytics
PostgreSQL is a transactional database and often the right place to start. Reaching analytical limits suggests you should reassess workload placement.
The right move is incremental: tune PostgreSQL first, measure the exact performance breakpoints, then replicate selected tables to an eventually consistent ClickHouse analytical copy.
Choose the integrated stack of ClickHouse Managed Postgres alongside ClickHouse Cloud when a unified operational experience is decisive.
FAQ: ClickHouse vs PostgreSQL for analytics
When should I add ClickHouse to PostgreSQL?
Add ClickHouse when measured analytical load causes dashboard latency to miss documented targets, replica lag to exceed freshness requirements, analytical scans to dominate I/O, or PostgreSQL maintenance effort no longer produces proportional performance gains. Keep PostgreSQL as the system of record and replicate selected tables to an eventually consistent analytical copy for OLAP workloads.
Should ClickHouse replace PostgreSQL?
No. PostgreSQL should remain the transactional system of record. Use ClickHouse as a separate analytical serving layer for fast aggregations, dashboards, and high-concurrency OLAP queries.
When is ClickHouse better than a PostgreSQL read replica?
Choose ClickHouse when queries scan large datasets, aggregate many rows, or serve many concurrent dashboard users and an eventually consistent analytical copy is acceptable. Read replicas isolate traffic, but they still use PostgreSQL's row-oriented storage engine.
How do PostgreSQL and ClickHouse work together?
PostgreSQL stores transactional data, while ClickHouse stores an eventually consistent analytical copy of selected tables. Teams typically replicate data from PostgreSQL to ClickHouse using change data capture (CDC).
Is PostgreSQL good enough for analytics?
Yes. PostgreSQL can be sufficient when reporting latency, concurrency, throughput, cost, and OLTP performance remain within measured targets. Consider a separate analytical serving layer when scan-heavy queries, concurrency, or maintenance overhead cause those targets to fail.
How does ClickHouse handle PostgreSQL updates and deletes?
The implementation depends on the CDC pipeline and destination table model. When ClickPipes replicates PostgreSQL into ClickHouse Cloud, inserts, updates, and deletes are written as versioned rows in a ReplacingMergeTree table. _peerdb_version identifies the newest version, and _peerdb_is_deleted marks tombstones. Because background deduplication is asynchronous, current-state queries should use FINAL and filter _peerdb_is_deleted = 0, or query a tested deduplicated view. Asynchronous lightweight deletes are not the normal ClickPipes CDC mechanism.
How fresh is data in ClickHouse when replicated from PostgreSQL?
Freshness depends on the CDC pipeline, source load, network conditions, and destination ingestion health. For the built-in "Sync to ClickHouse" integration in ClickHouse Managed Postgres, ClickPipes uses a default 60-second polling interval to replicate into a ClickHouse Cloud service. That is a polling cadence, not an end-to-end freshness guarantee, so teams should validate observed lag against their requirements.
Should you choose ClickHouse instead of Snowflake or BigQuery?
Use Snowflake or BigQuery for centralized enterprise analytics, ELT, BI, data-science workflows, and workloads that benefit from their interactive acceleration features. Consider ClickHouse when the primary workload is continuously ingested, user-facing analytical serving and measured tail latency, concurrency, and cost favor a dedicated ClickHouse service. Benchmark the representative workload rather than treating cloud warehouses as exclusively batch-oriented.


