Why real-time dashboard speed matters #
For real-time analytical applications (e.g. dashboards) to feel snappy, response times should align with these human-perceived performance guidelines, as outlined by Jakob Nielsen, mental chronometry research, and further insights from Jakob Nielsen and Steve Henty:
<100ms (instant) — Feels instant, ideal for filtering or quick updates.
100ms - 500ms (very fast) — Smooth, great for charts, tab switches, or summaries.
500ms - 1s (noticeable delay) — Users notice the wait. Acceptable for complex queries.
1s - 2s (slow but tolerable) — Feels sluggish. Use loading indicators.
>2s (too slow) — Feels unresponsive. Users lose focus.
Achieving sub-500ms—or even sub-100ms—queries at scale, especially with billions of JSON documents, is challenging without the right database. Most systems slow down as datasets grow, resulting in sluggish dashboards and frustrated users.
In this post, we showcase proven query acceleration techniques through three typical real-time dashboard scenarios, where all dashboard queries logically process 4+ billion Bluesky JSON documents (1.6 TiB of data)—all running on a normal, modestly sized machine—yet:
① Achieve guaranteed instantaneous (<100ms) ClickHouse response times.
② Maintain speed, no matter how many more billions of documents are stored.
③ Always run on the latest data or with minimal delay.
④ Use minimal CPU & memory, consuming just KBs to low MBs of RAM.
The table below previews the optimizations we’ll achieve—demonstrating how ClickHouse can sustain real-time dashboard performance at any scale, even with billions of JSON documents.
| ① Responsetime | ② Maintains speedas data grows | ③ Runs overlatest data | ④ Minimized CPU &memory costs | |
|---|---|---|---|---|
| Dashboard 1: Tracking Bluesky activity trends | ||||
| Accelerated query | 6 ms | ✅ | ✅ | ✅ |
| Dashboard 2: Ranking the most popular Bluesky events | ||||
| Accelerated query | 7 ms | ✅ | ✅ | ✅ |
| Dashboard 3: Discovering the most reposted Bluesky posts | ||||
| Accelerated query | 3 ms | ✅ | 5s delay | ✅ |
Before diving into the optimizations, we’ll first introduce our Bluesky dataset and hardware. Then, through three selected real-time dashboard scenarios, we’ll demonstrate exactly how to achieve—and sustain—instantaneous (<100ms) query performance at any scale.
TL;DR? Jump straight to the key takeaways!
If you're looking for the final results and optimization insights, skip ahead to
Mission accomplished: sustained <100ms query times.
The Bluesky JSON dataset #
Our example dataset is a real-time JSON event stream scraped from Bluesky, a popular social media platform. As detailed in another post, we continuously ingest new events (e.g. post, like, repost).
How we store Bluesky JSON data in ClickHouse #
Below is the schema of the ClickHouse table storing the full, constantly growing Bluesky dataset, accessible through our ClickHouse SQL playground:
1CREATE TABLE bluesky.bluesky
2(
3  kind LowCardinality(String),
4  data JSON,
5  bluesky_ts DateTime64(6)
6)
7ENGINE = MergeTree
8ORDER BY (kind, bluesky_ts);
The data column uses our revamped JSON type to store original Bluesky JSON documents.
To speed up specific queries, we previously extracted and stored the event kind and event time as top-level columns and sorting keys. However, this is no longer necessary, as our JSON type now supports using JSON paths directly as sorting and primary key columns.
How big is the dataset? #
We began ingesting data in late December last year. As of March 2025, the table holds 4+ billion Bluesky event JSON documents, with a total uncompressed size exceeding 1.6 TiB:
Static result for the query above from March 2025:
┌─docs─────────┬─data_size─┐
│ 4.14 billion │ 1.61 TiB  │
└──────────────┴───────────┘
How fast is it growing? #
Monthly, the table grows currently by ~1.5 billion documents:
We began ingesting Bluesky event data in late December last year, so that month has a lower data volume compared to subsequent months. Additionally, February was a short month this year with only 28 days.
Daily, the table currently grows by ~50 million Bluesky events:
This rapid growth means that without the right optimizations, queries will inevitably slow down.
So how do we sustain real-time performance, no matter the dataset size and growth rate? Read on...
Test all queries live! #
Or let this blog run them for you.
Every Bluesky table, acceleration technique, and query from this blog is available in our ClickHouse SQL playground, where you can explore and run every example yourself.
In fact, every query in this blog runs live in the playground, allowing you to see results in real-time as you read.
Our public ClickHouse SQL playground enforces quotas, access control, and query complexity limits to ensure fair usage and prevent resource monopolization. As a result, expensive queries will hit execution restrictions.
To provide complete and accurate execution statistics, we ran some queries for this blog using an unrestricted admin user connected to the ClickHouse Cloud playground service via clickhouse-client.
Our ClickHouse hardware setup #
Our ClickHouse SQL playground runs on a ClickHouse Cloud service with at least three compute nodes, each equipped with 59 CPU cores and 236 GiB RAM. While the cluster ensures high availability and scalability, each dashboard query in this post runs on a single node, as we did not enable ClickHouse Cloud’s parallel replicas. Apart from ClickHouse Cloud using shared object storage, this makes the performance results directly comparable to what can be achieved on a standalone ClickHouse instance with similar CPU and RAM.
In the rest of this post, we’ll show you how to achieve guaranteed instantaneous (<100ms) ClickHouse query response times on this hardware—no matter how many billions of JSON documents are stored in the Bluesky table. We’ll walk through three real-time dashboard scenarios, applying proven acceleration techniques step by step.
Dashboard 1: Tracking Bluesky activity trends #
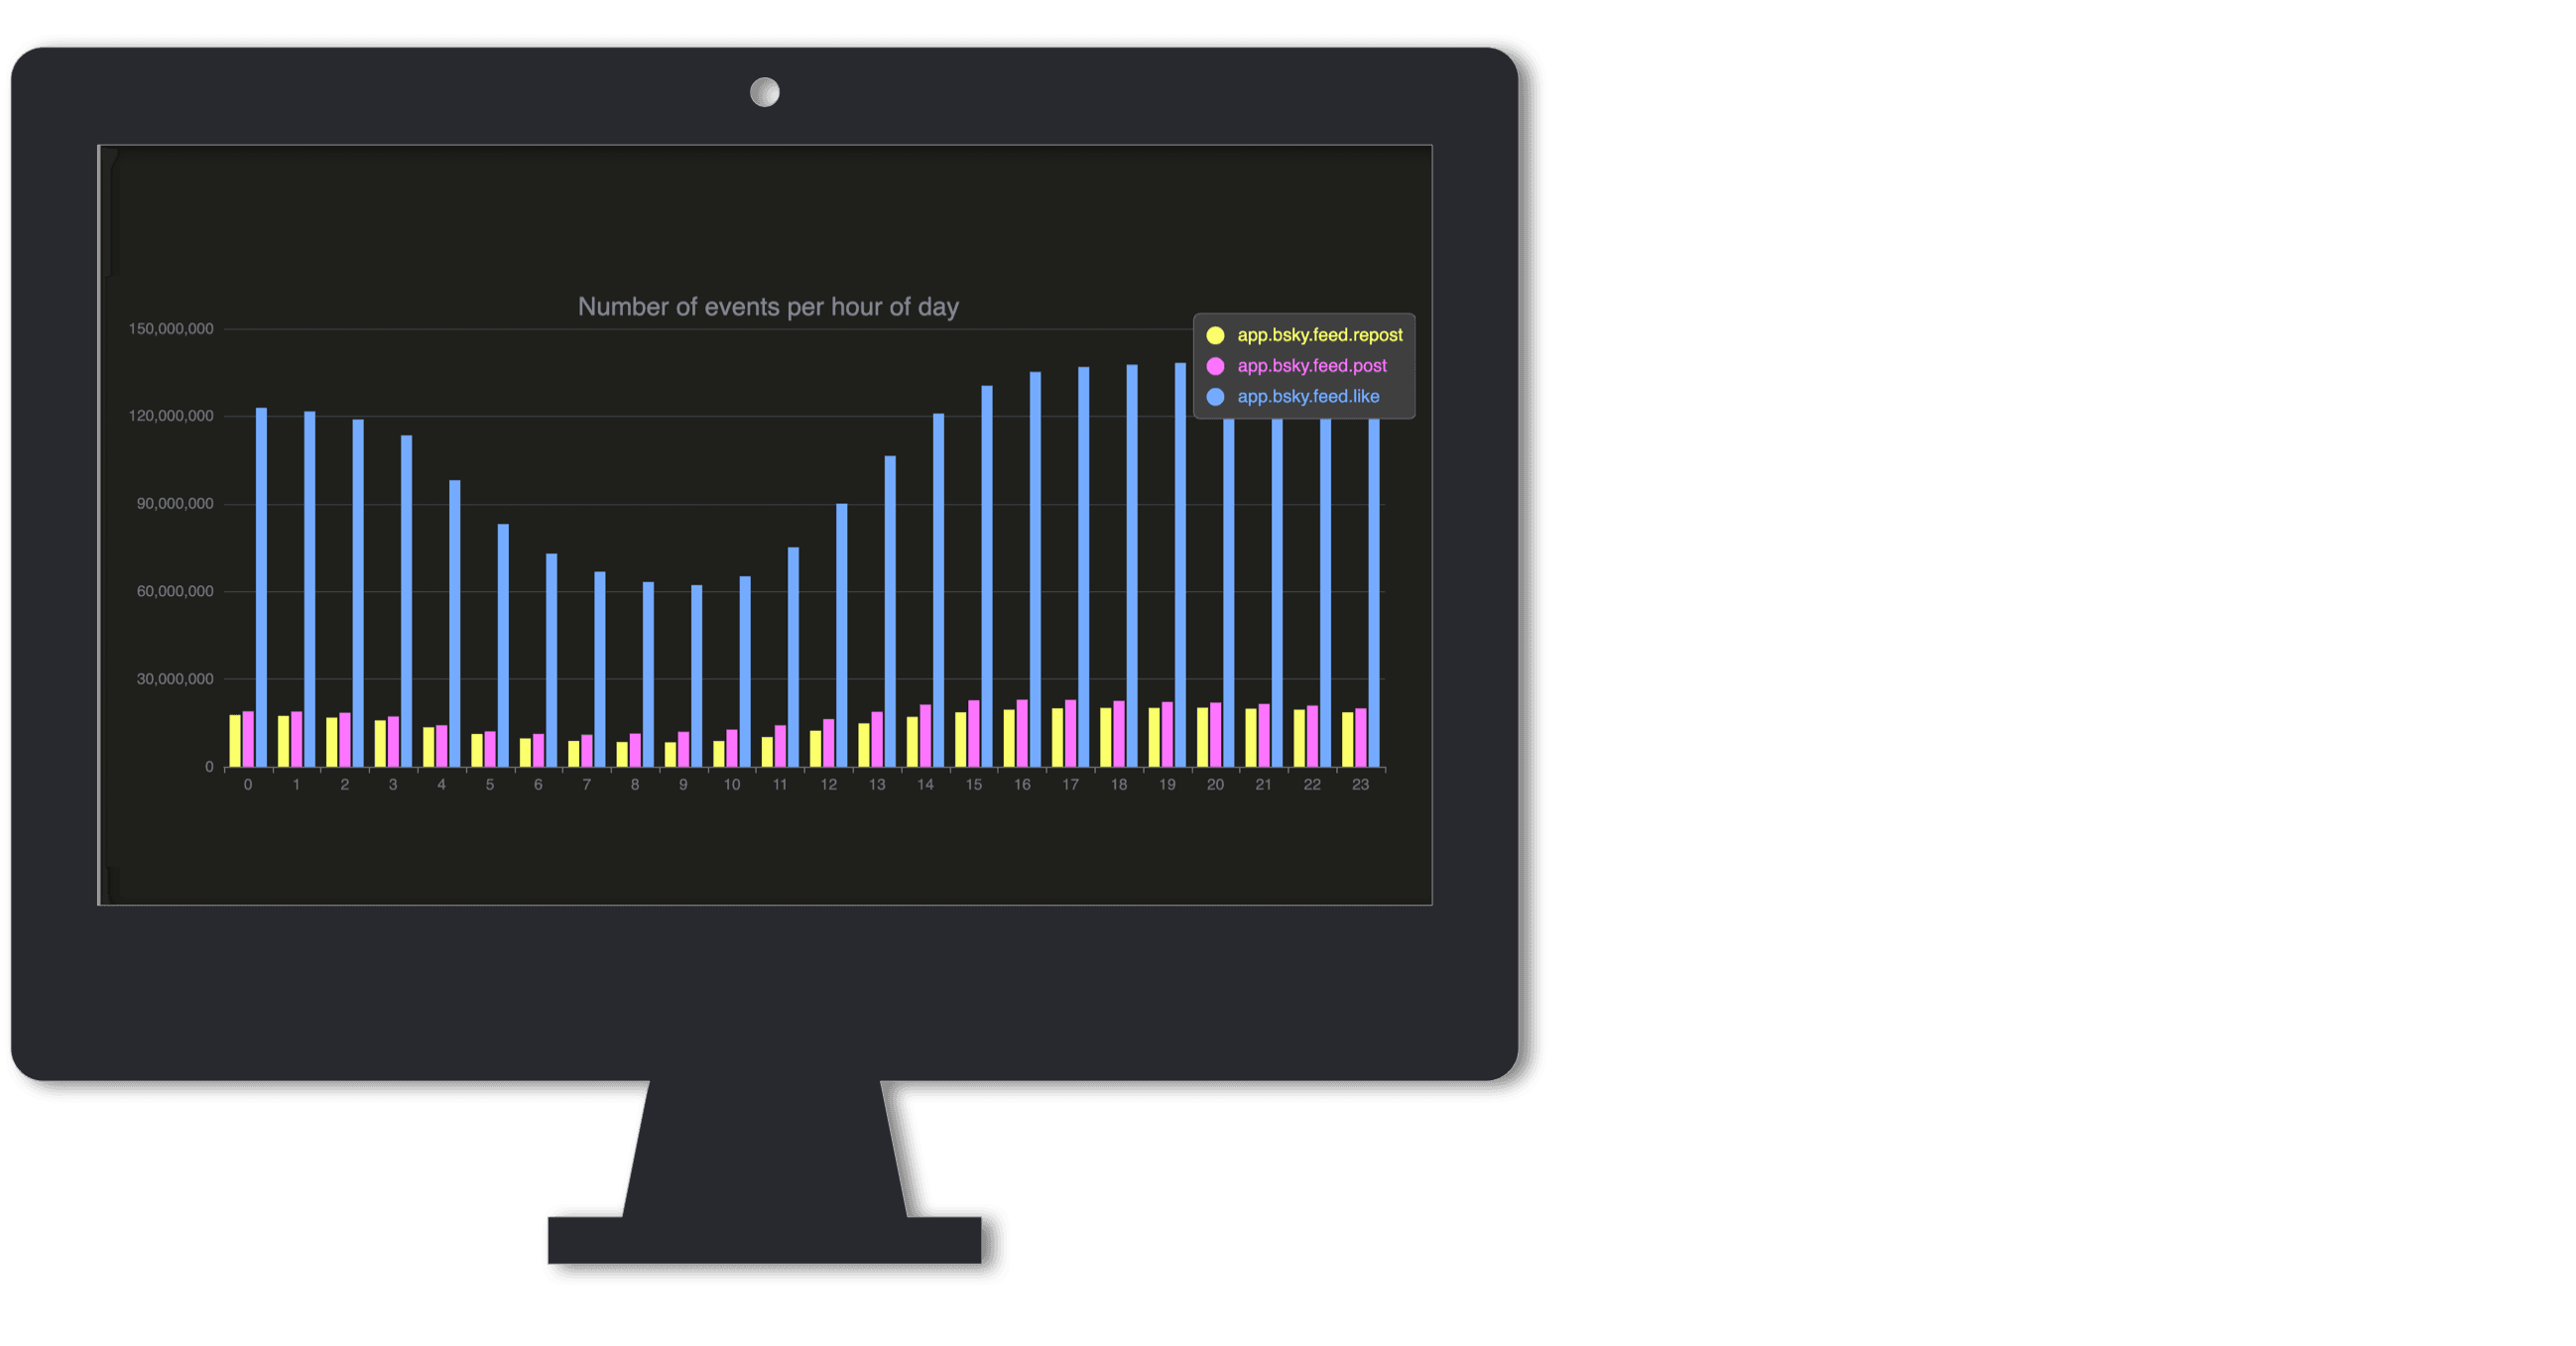
Our first scenario is a real-time dashboard showing the most popular Bluesky event types by hour—essentially visualizing when people are active on Bluesky during the day.
Baseline query: counting events by hour (44s) #
A potential query powering this dashboard calculates the most popular Bluesky event types using a count aggregation across the complete Bluesky dataset:
⚠️ Pressing ▶️ for the query above won’t get you far because it most likely exceeds the max runtime limits and query complexity restrictions enforced by our public playground.
Execution statistics from running the query via clickhouse-client without playground quotas or restrictions:
Elapsed: 44.901 sec. Processed 4.12 billion rows, 189.18 GB (91.84 million rows/s., 4.21 GB/s.)
Peak memory usage: 775.96 MiB.
The query runs in 44 seconds (and consumes 776 MiB of memory) which is way too slow for a responsive dashboard.
>2s (too slow) — Feels unresponsive. Users lose focus.
ClickHouse processes the Bluesky JSON data with the aggregation query above thousands of times faster than other leading JSON data stores. On our hardware, it achieves a throughput of 91.84 million docs per second (4.21 GB/s).
The sheer amount of data (4+ billion documents, constantly growing) prevents achieving a sub-100ms response directly. Instead of scanning billions of rows on every query, what if we could pre-aggregate the data as new events arrive? That’s where incremental materialized views come in.
How incremental aggregation unlocks speed #
To achieve instantaneous responses, we need to incrementally pre-aggregate the data in real-time—continuously updating aggregates as new Bluesky events arrive:
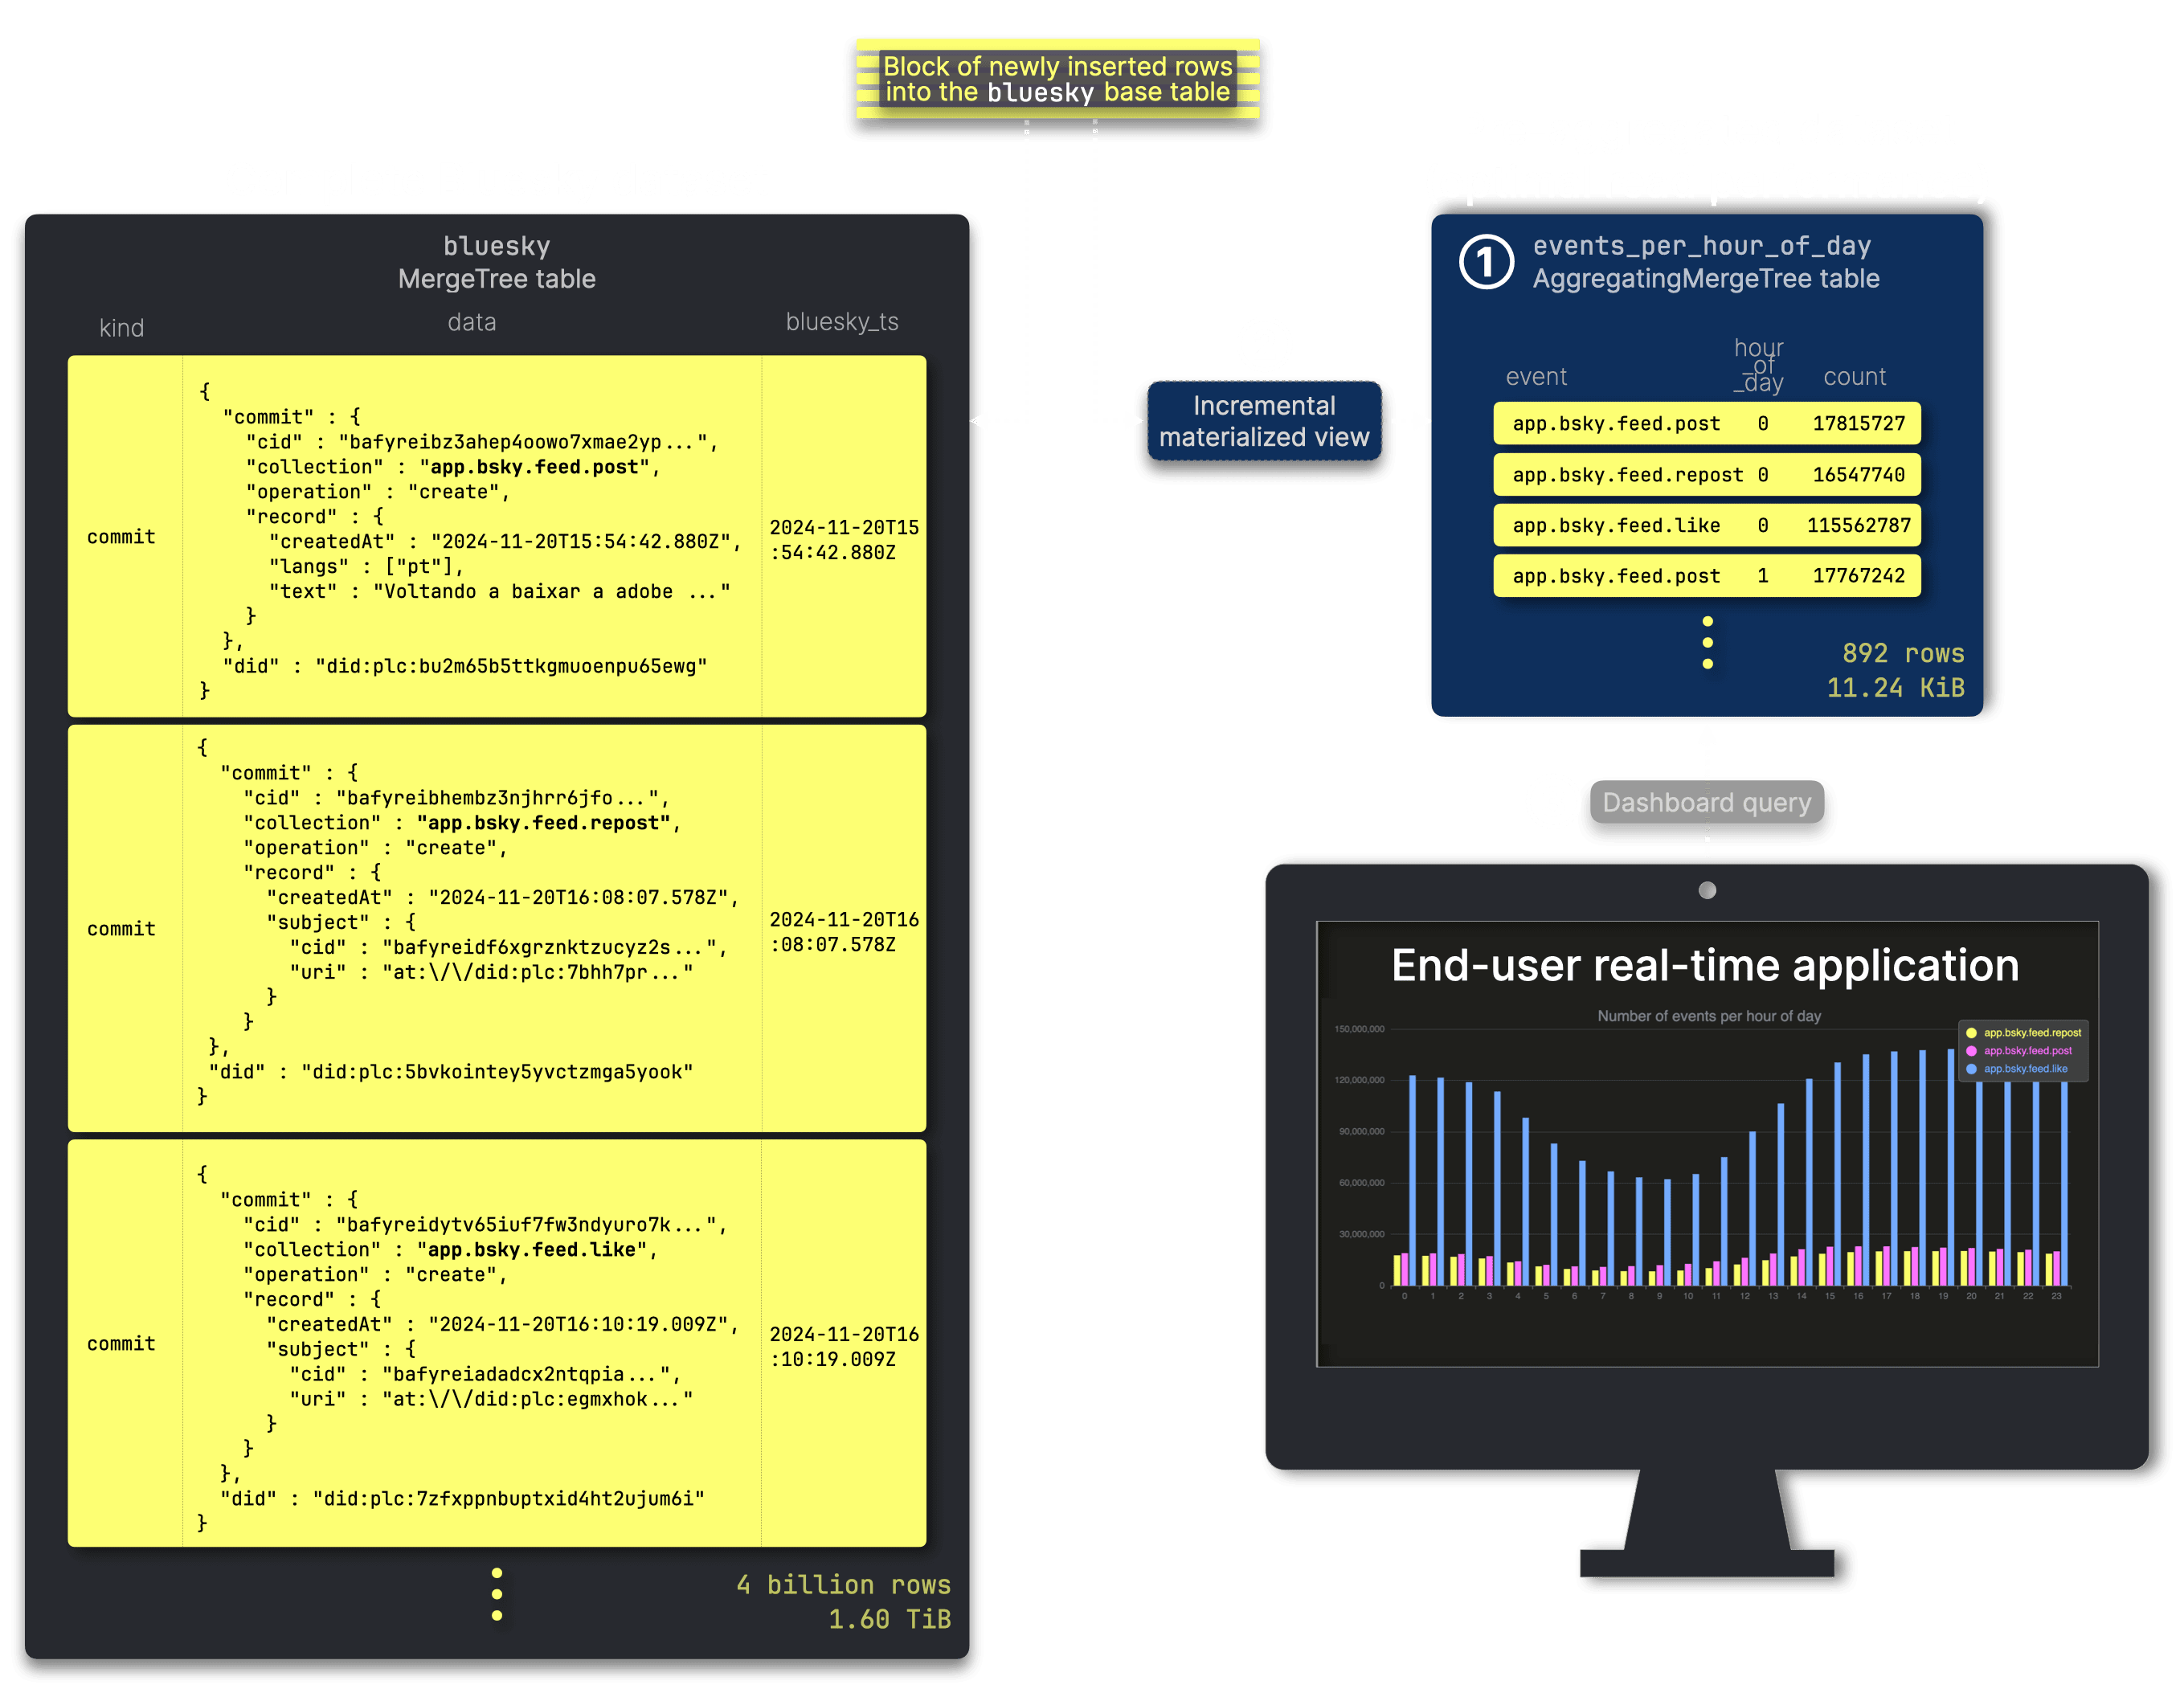
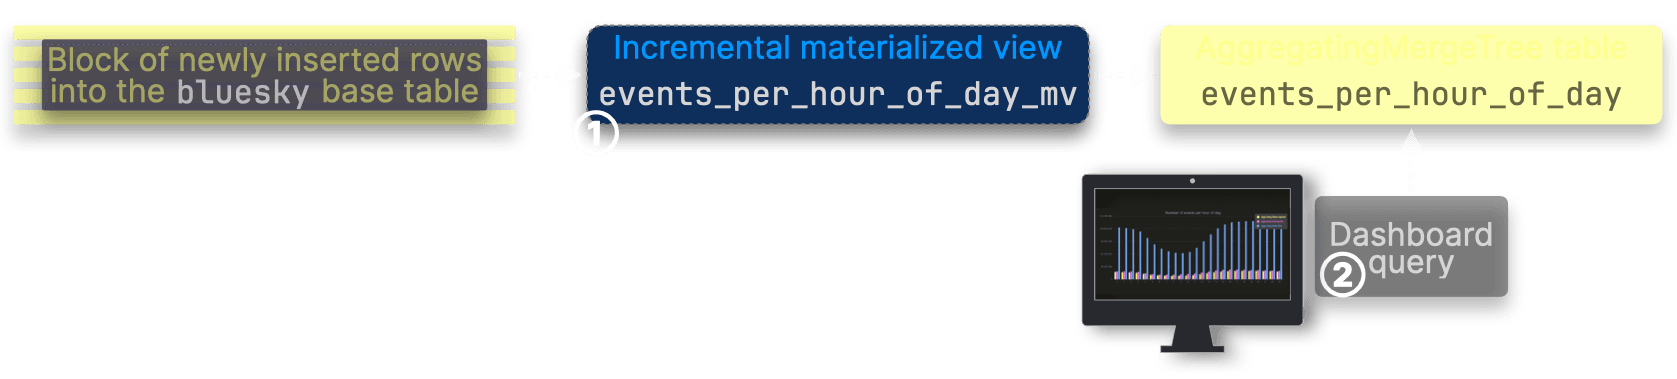
We store and update pre-aggregated data in the table ① events_per_hour_of_day, which ③ powers our example dashboard. An ② incremental materialized view ensures that this table remains continuously updated as new data arrives in the source table.
Incremental aggregation using materialized views is highly resource efficient, particularly when source tables contain billions or even trillions of rows. Rather than recalculating aggregates from the entire dataset every time new data arrives, ClickHouse efficiently computes partial aggregation states from only newly inserted rows, incrementally merging these states with existing aggregates in the background.
Here’s the DDL statement defining the events_per_hour_of_day table, which stores our pre-aggregated data:
1CREATE TABLE bluesky.events_per_hour_of_day
2(
3    event LowCardinality(String),
4    hour_of_day UInt8,
5    count SimpleAggregateFunction(sum, UInt64)
6)
7ENGINE = AggregatingMergeTree
8ORDER BY (event, hour_of_day);
This is the incremental materialized view definition. At its core is a transformation query that’s triggered whenever new rows arrive in the Bluesky dataset. The query pre-aggregates incoming rows and inserts the results into the events_per_hour_of_day target table, where ClickHouse incrementally continues the aggregation through background merges:
1CREATE MATERIALIZED VIEW bluesky.events_per_hour_of_day_mv
2TO bluesky.events_per_hour_of_day
3AS SELECT
4    data.commit.collection::String AS event,
5    toHour(bluesky_ts) as hour_of_day,
6    count() AS count
7FROM bluesky.bluesky
8WHERE (kind = 'commit')
9GROUP BY event, hour_of_day;
Storage impact of pre-aggregation #
Let’s check the size of the events_per_hour_of_day target table when its data is fully in sync with the 4+ billion-row Bluesky dataset—either through real-time updates or via backfilling if materialized views were added to an existing table:
Static result for the query above from March 2025:
┌─rows───┬─data_size─┐
│ 892.00 │ 11.24 KiB │
└────────┴───────────┘
As you can see, the table containing the pre-aggregated data is drastically smaller than the full Bluesky dataset table, in both row count and (uncompressed) total data size.
The size of pre-aggregated data remains independent of the source table: The materialized view updates its target table in real-time as new data arrives. However, once fully merged, its row count and total size stay constant—regardless of how much the complete Bluesky dataset grows.
This property is key—it guarantees instantaneous (<100ms) ClickHouse query response times. Why? Because the maximum* fully merged size of the materialized view’s target table depends only on the number of unique Bluesky events (currently 109), multiplied by 24 hours in a day—not on the overall and ever-growing size of the full Bluesky dataset.
Since the data size stays stable, the optimized query’s runtime remains stable too!
*Not all events occur in every hour of the day.
Achieving 6ms query performance #
Now we can run the query from above over the events_per_hour_of_day table with pre-aggregated data:
Execution statistics queried via unrestricted clickhouse-client:
Elapsed: 0.006 sec.
Now, the query runs in just 6 milliseconds instead of 44 seconds—well within our <100ms “snappy” threshold. Since its input table is continuously updated by an incremental materialized view, it always operates on the latest data while maintaining a constant runtime, regardless of the base table’s growth.
<100ms (instant) — Feels instant, ideal for filtering or quick updates.
How much memory does it use? (186KiB vs 776 MiB) #
To understand the efficiency of our approach, let’s break down how data flows from raw JSON ingestion to a real-time dashboard query. The diagram below illustrates this process, followed by a detailed look at memory usage across each stage.
| Metric | Baseline query | ① Incremental MV | ② Optimized query |
|---|---|---|---|
| Memory usage | 775.96 MiB | 314.74 MiB | 186.15 KiB |
| Rows processed | 4.12 billion | ~646.76k per update | 892 rows |
| Duration | 44.9 sec | ~998 ms per update | Instantaneous |
| Metrics source | Execution statistics | Query views log | Query log |
The final query runs with just 186 KiB of memory, a dramatic reduction from the 775.96 MiB used by the baseline query. Even when factoring in the 314 MiB used by the incremental materialized view to process new rows, the total memory footprint remains well below the baseline—ensuring real-time performance at scale.
This demonstrates how incremental pre-aggregation drastically reduces both query latency and resource consumption while ensuring the dashboard remains responsive at scale.
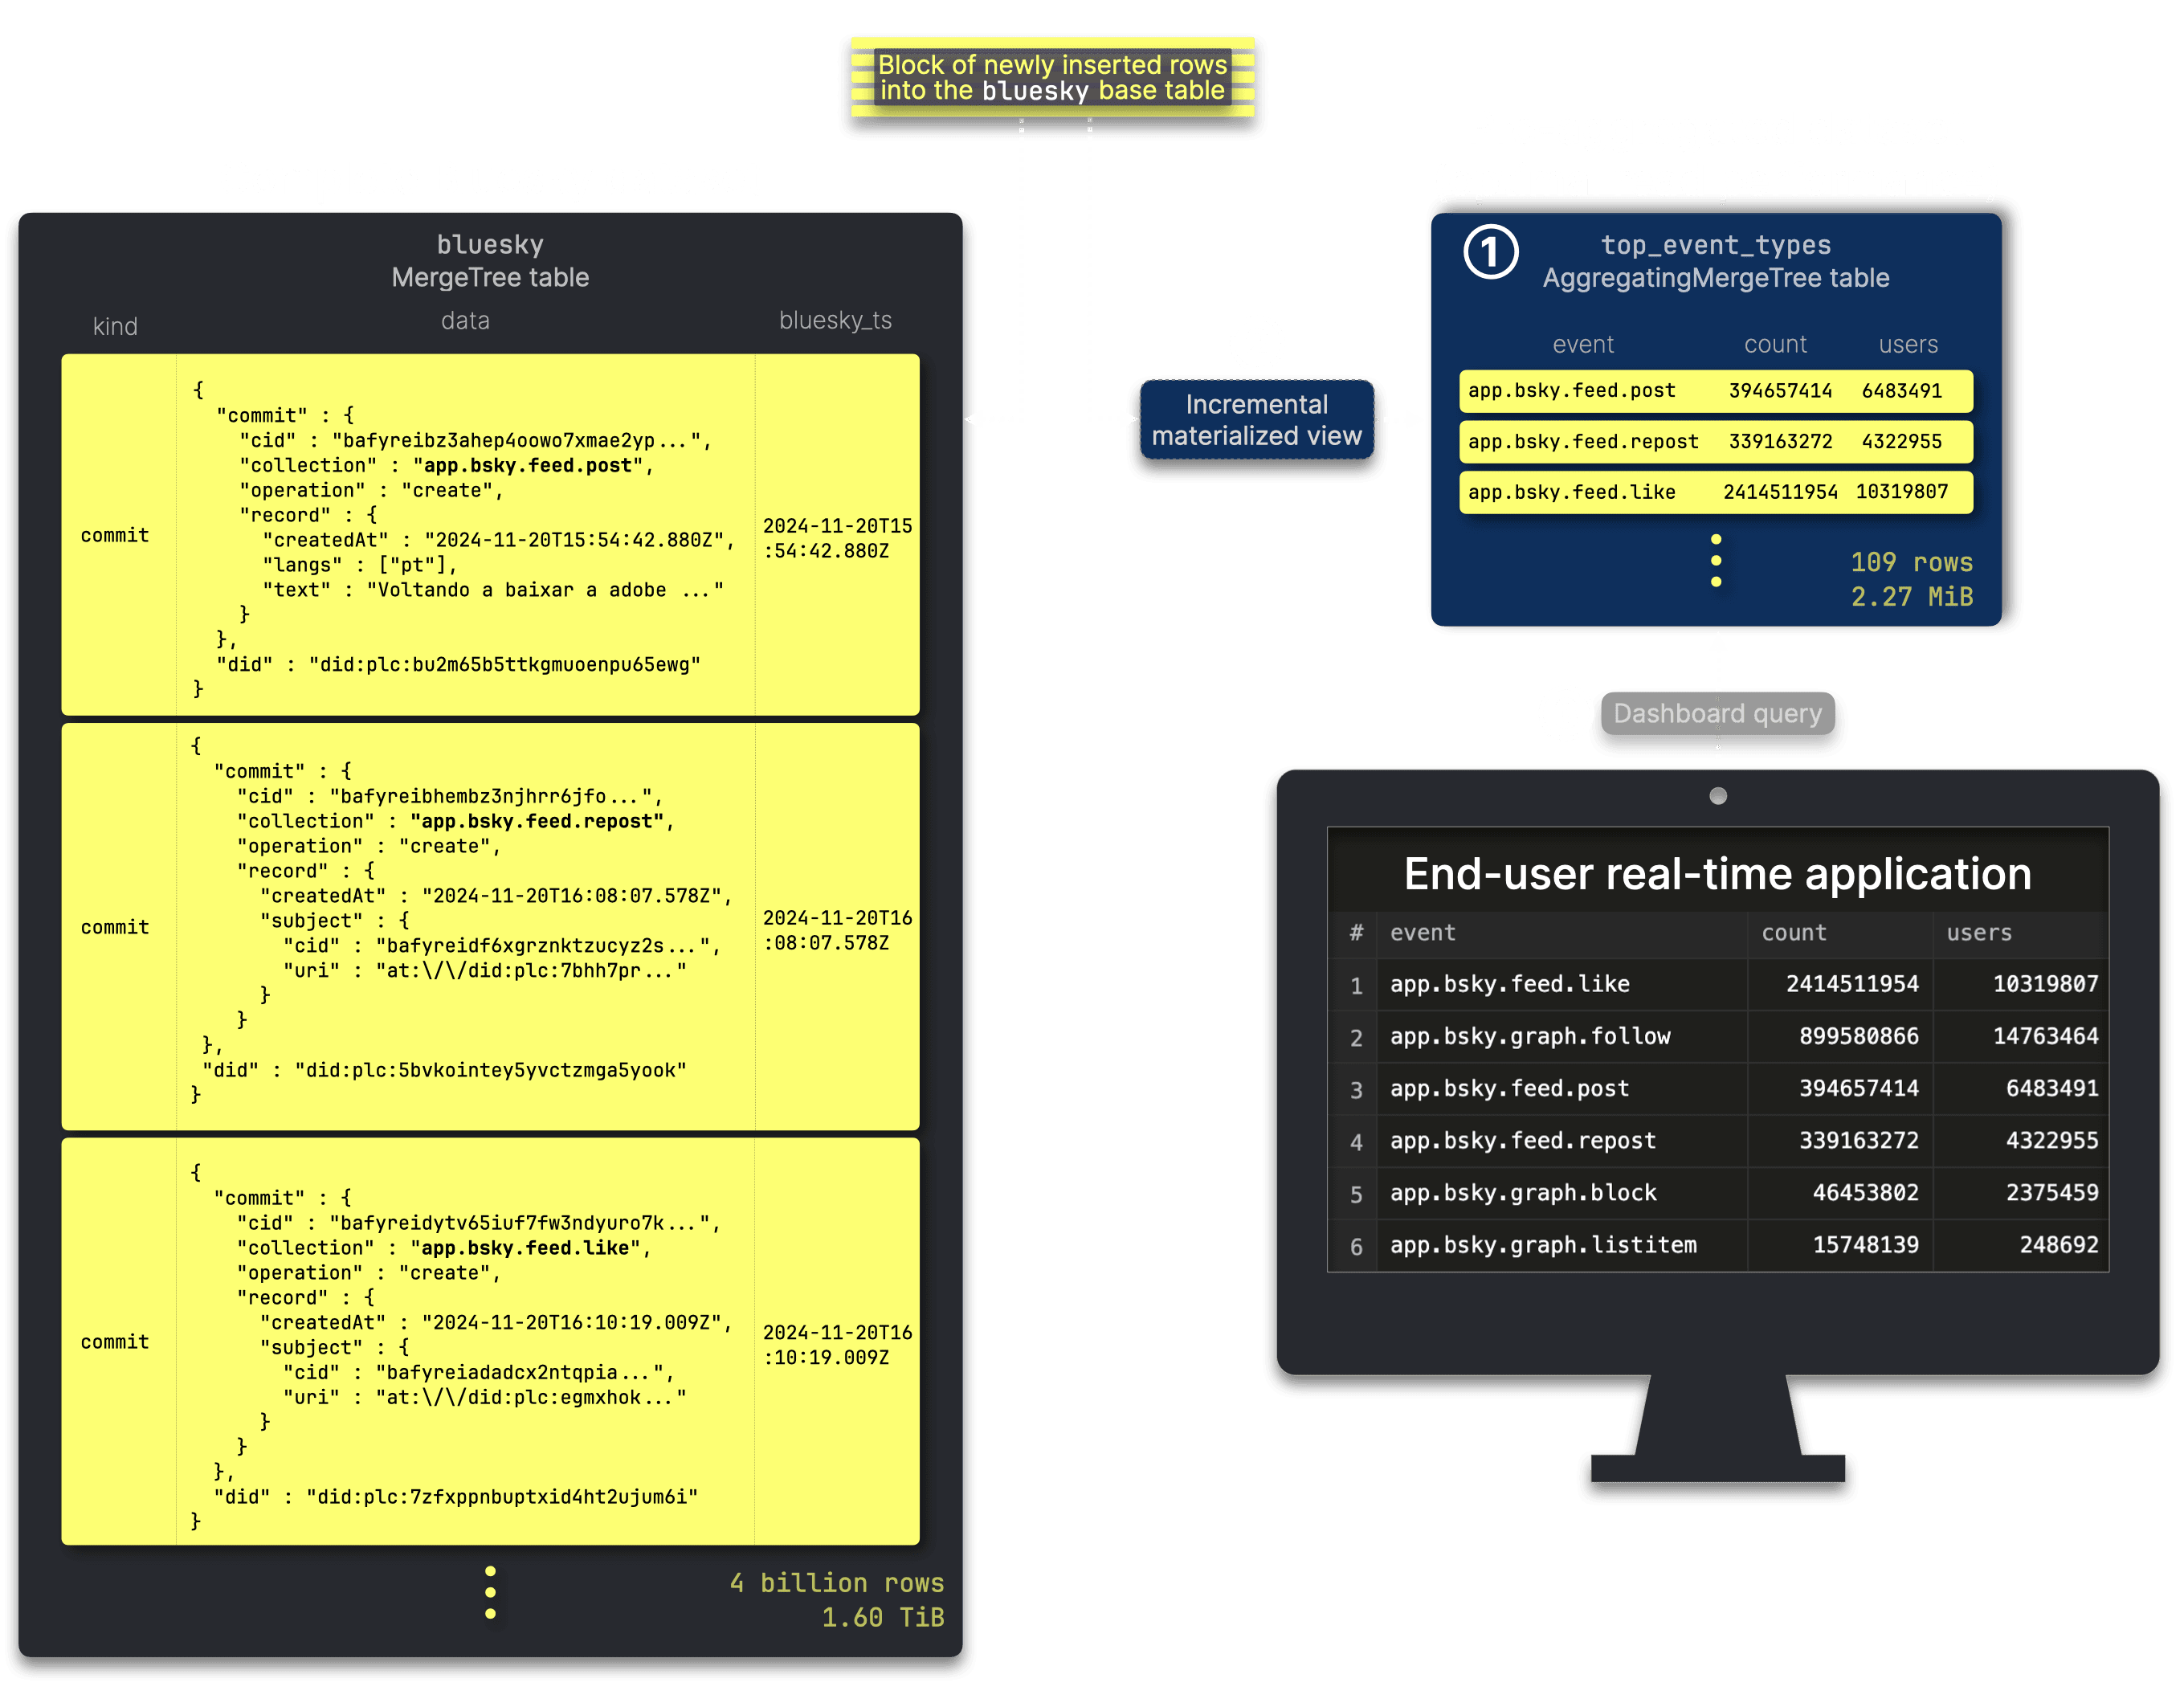
Dashboard 2: Ranking the most popular Bluesky events #
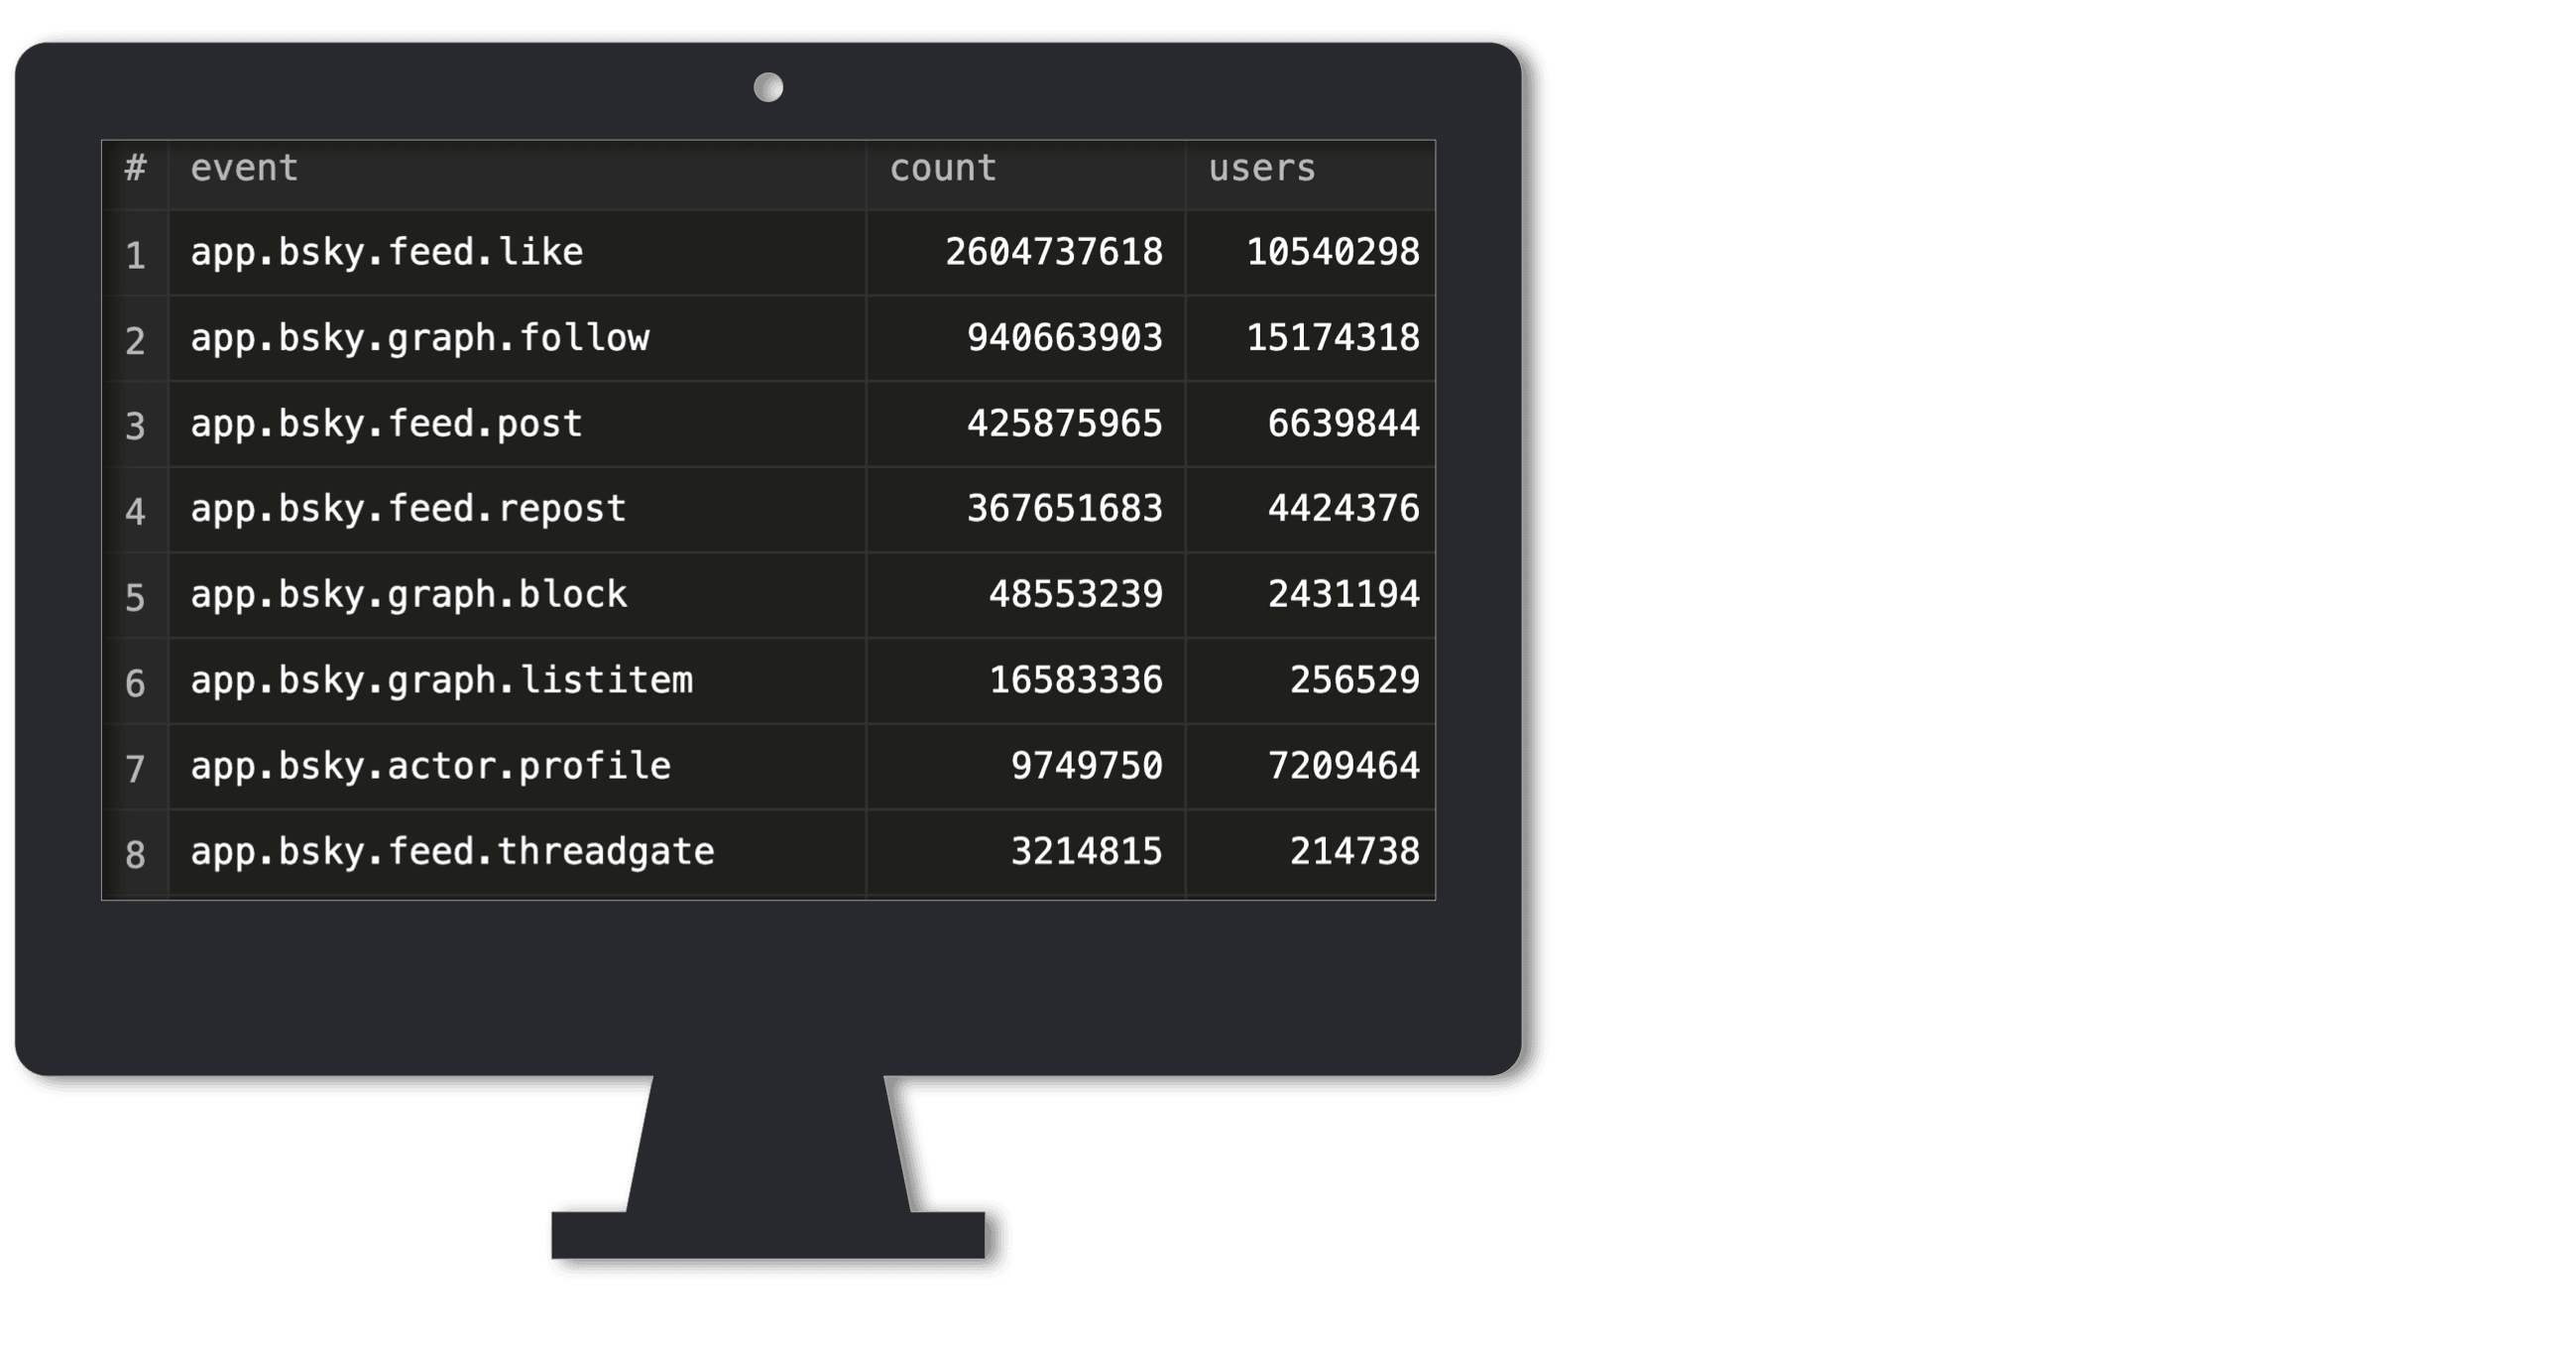
Our second scenario is a real-time dashboard showing the most frequent Bluesky event types with the count of unique users per event type.
Baseline query: counting unique users (56s) #
We run a potential dashboard query over the full Bluesky dataset, extending the count aggregation (as used in the dashboard 1 query) with a uniq aggregation. This annotates each event not only with its total occurrence but also with the number of unique users:
Execution statistics queried via unrestricted clickhouse-client:
Elapsed: 55.966 sec. Processed 4.41 billion rows, 387.45 GB (78.80 million rows/s., 6.92 GB/s.)
Peak memory usage: 1000.24 MiB.
>2s (too slow) — Feels unresponsive. Users lose focus.
At 56 seconds, this query is far too slow for a responsive dashboard. A more efficient approach is needed to keep query times low as data grows. Instead of scanning billions of rows on demand, we pre-aggregate and maintain an optimized table for real-time analytics.
From slow queries to real-time analytics #
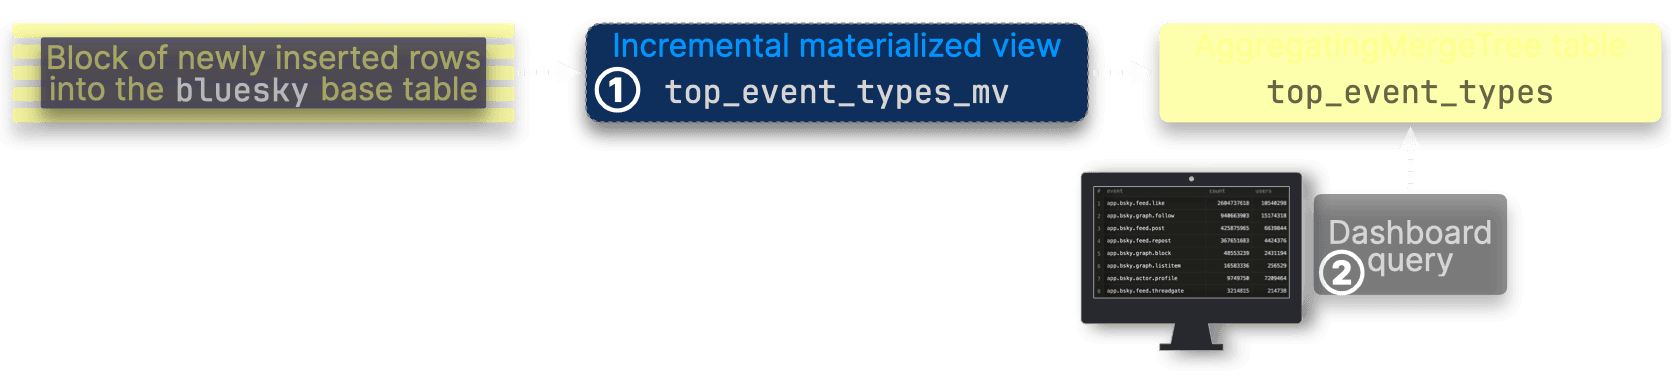
Similar to the first dashboard, We store and update pre-aggregated data in an additional table ① top_event_types, which ③ powers our second example dashboard. An ② incremental materialized view ensures that this table remains continuously updated as new data arrives in the source table:
Here’s the DDL statement for the top_event_types table, where we store the pre-aggregated results:
1CREATE TABLE bluesky.top_event_types
2(
3	event LowCardinality(String),
4	count SimpleAggregateFunction(sum, UInt64),
5	users AggregateFunction(uniq, String)
6)
7ENGINE = AggregatingMergeTree
8ORDER BY event;
This is DDL for the incremental materialized view sending pre-aggregated data to the top_event_types table:
1CREATE MATERIALIZED VIEW bluesky.top_event_types_mv
2TO bluesky.top_event_types
3AS
4SELECT
5  data.commit.collection::String AS event,
6  count() AS count,
7  uniqState(data.did::String) AS users
8FROM bluesky.bluesky
9WHERE kind = 'commit'
10GROUP BY event;
How much space do the aggregates take? #
We check the size of the top_event_types target table when its data is fully in sync with the 4+ billion rows full Bluesky dataset table:
Static result for the query above from March 2025:
┌─rows───┬─data_size─┐
│ 109.00 │ 2.27 MiB  │
└────────┴───────────┘
The size of pre-aggregated data remains independent of the source table: Again, the (fully merged) target table’s size and row count remain constant, independent of the growth of the total Bluesky dataset size. It depends solely on the number of unique Bluesky events (currently 109).
Again, this property ensures instantaneous (<100ms) ClickHouse query response times, regardless of the overall and constantly growing size of the complete Bluesky dataset.
Final optimized query: 7ms response time #
We run the query from above over the top_event_types table with pre-aggregated data:
Execution statistics queried via unrestricted clickhouse-client:
Elapsed: 0.007 sec.
The query completes in 7 milliseconds, instead of taking 56 seconds.
<100ms (instant) — Feels instant, ideal for filtering or quick updates.
Memory consumption of the optimized query (16 MiB vs 1 GiB) #
To quantify the efficiency of our approach, the table below compares memory usage at each stage—showing how incremental materialized views dramatically reduce query overhead.
| Metric | Baseline query | ① Incremental MV | ② Optimized query |
|---|---|---|---|
| Memory usage | 1 GiB | 276.47 MiB | 16.58 MiB |
| Rows processed | Full dataset | ~571.42k per update | 109 rows |
| Duration | 56 sec | ~746 ms per update | Instantaneous |
| Metrics source | Execution statistics | Query views log | Query log |
The optimized query consumes just 16 MiB of memory, a sharp contrast to the 1 GiB used by the baseline query. Even when factoring in the 276 MiB required by the incremental materialized view to process new rows, the total memory footprint remains significantly lower—ensuring fast, efficient real-time analytics.
Once again, incremental pre-aggregation minimizes memory usage while maintaining low query latency, making large-scale JSON analytics highly efficient.
Dashboard 3: Discovering the most reposted Bluesky posts #
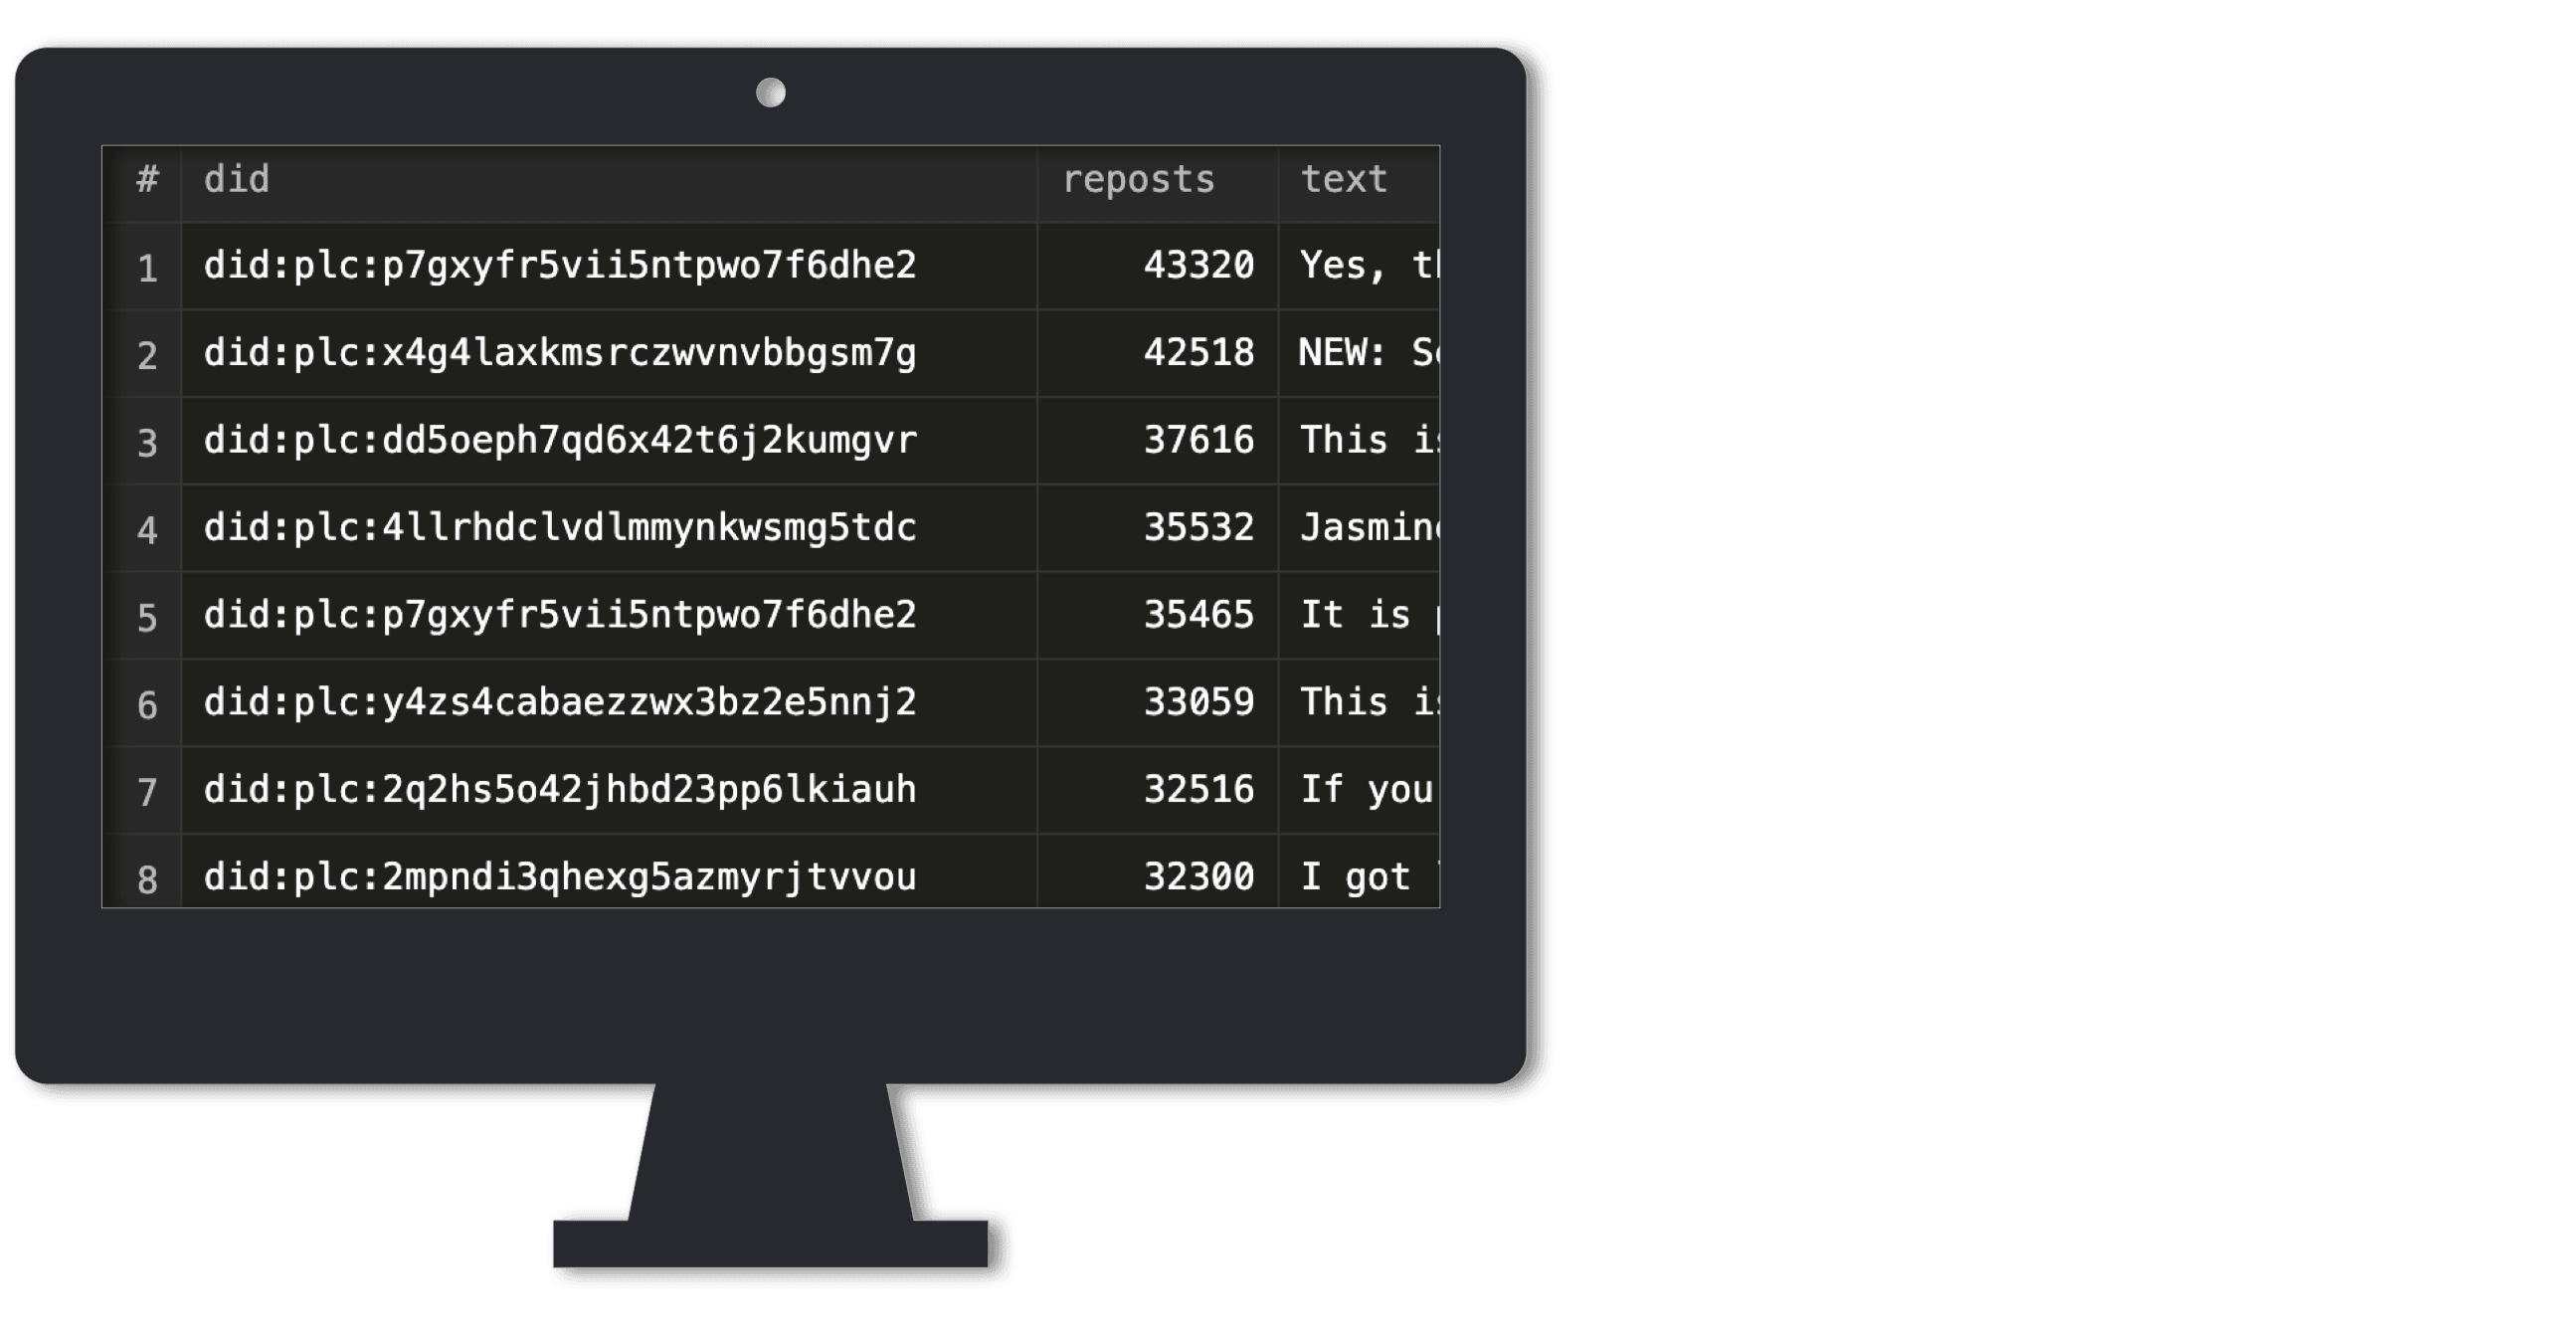
Our third scenario is a real-time dashboard highlighting the most reposted Bluesky posts.
Challenges in identifying reposts efficiently #
At first glance, identifying the most reposted Bluesky posts seems simple. However, this dashboard introduces some key challenges:
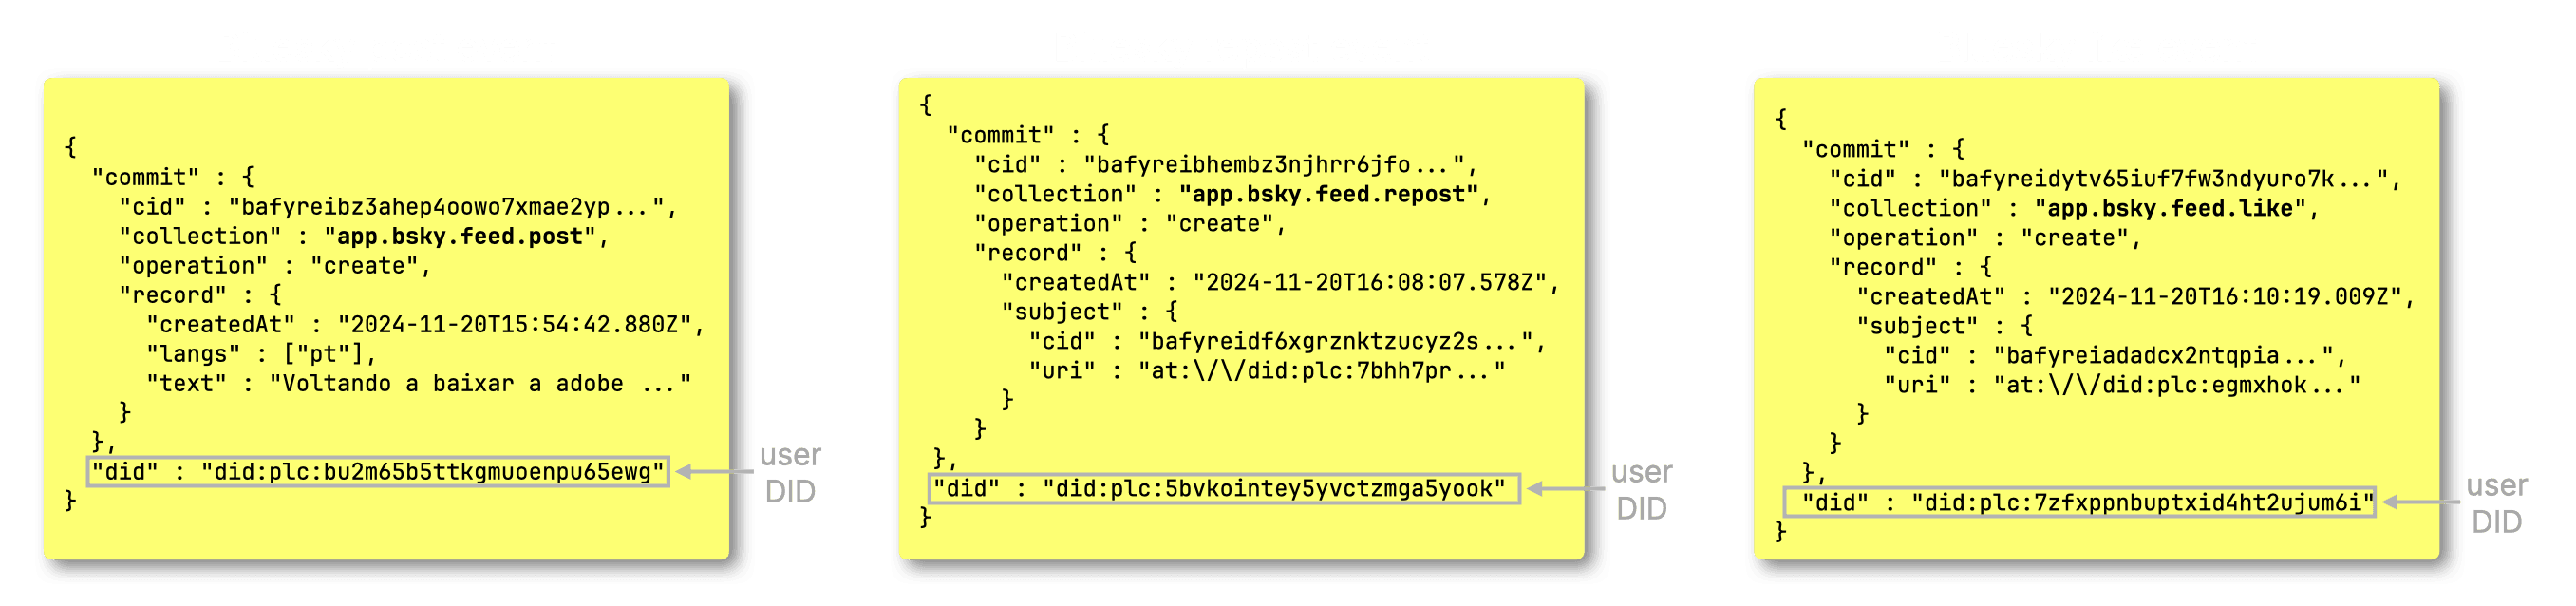
- Repost events don’t contain post content: They only store the CID (Content Identifier) of the original post—without text:

-
Counting reposts is expensive: To compute the number of reposts per post, we must aggregate on the high-cardinality
cidJSON path, which slows queries. -
Posts don’t contain user handles: BLuesky event JSON documents track only the DID (Decentralized Identifier) of users—not their actual username or handle:
Before solving these problems, let’s look at a baseline query to find the most reposted posts.
Why repost queries are slow (baseline: 37s execution time) #
Before we address these aforementioned issues—enriching most reposted posts with content and mapping DIDs to user handles—let’s start with a basic query to retrieve the top 10 most reposted posts:
Execution statistics queried via unrestricted clickhouse-client:
Elapsed: 37.234 sec. Processed 4.14 billion rows, 376.91 GB (111.26 million rows/s., 10.12 GB/s.)
Peak memory usage: 45.43 GiB.
>2s (too slow) — Feels unresponsive. Users lose focus.
Clearly, this approach is too slow. Aggregating on the high-cardinality cid JSON path results in a 37-second query and 45 GiB of memory usage—far from usable for real-time dashboards. To make repost lookups efficient, we need a better strategy. The first step is pre-aggregating repost counts
Accelerating repost queries for real-time insights #
As usual, we store and update pre-aggregated data in an additional table, ① reposts_per_post, which serves as ③ input for the dashboard query. An ② incremental materialized view ensures this table remains continuously updated as new data arrives in the source table:
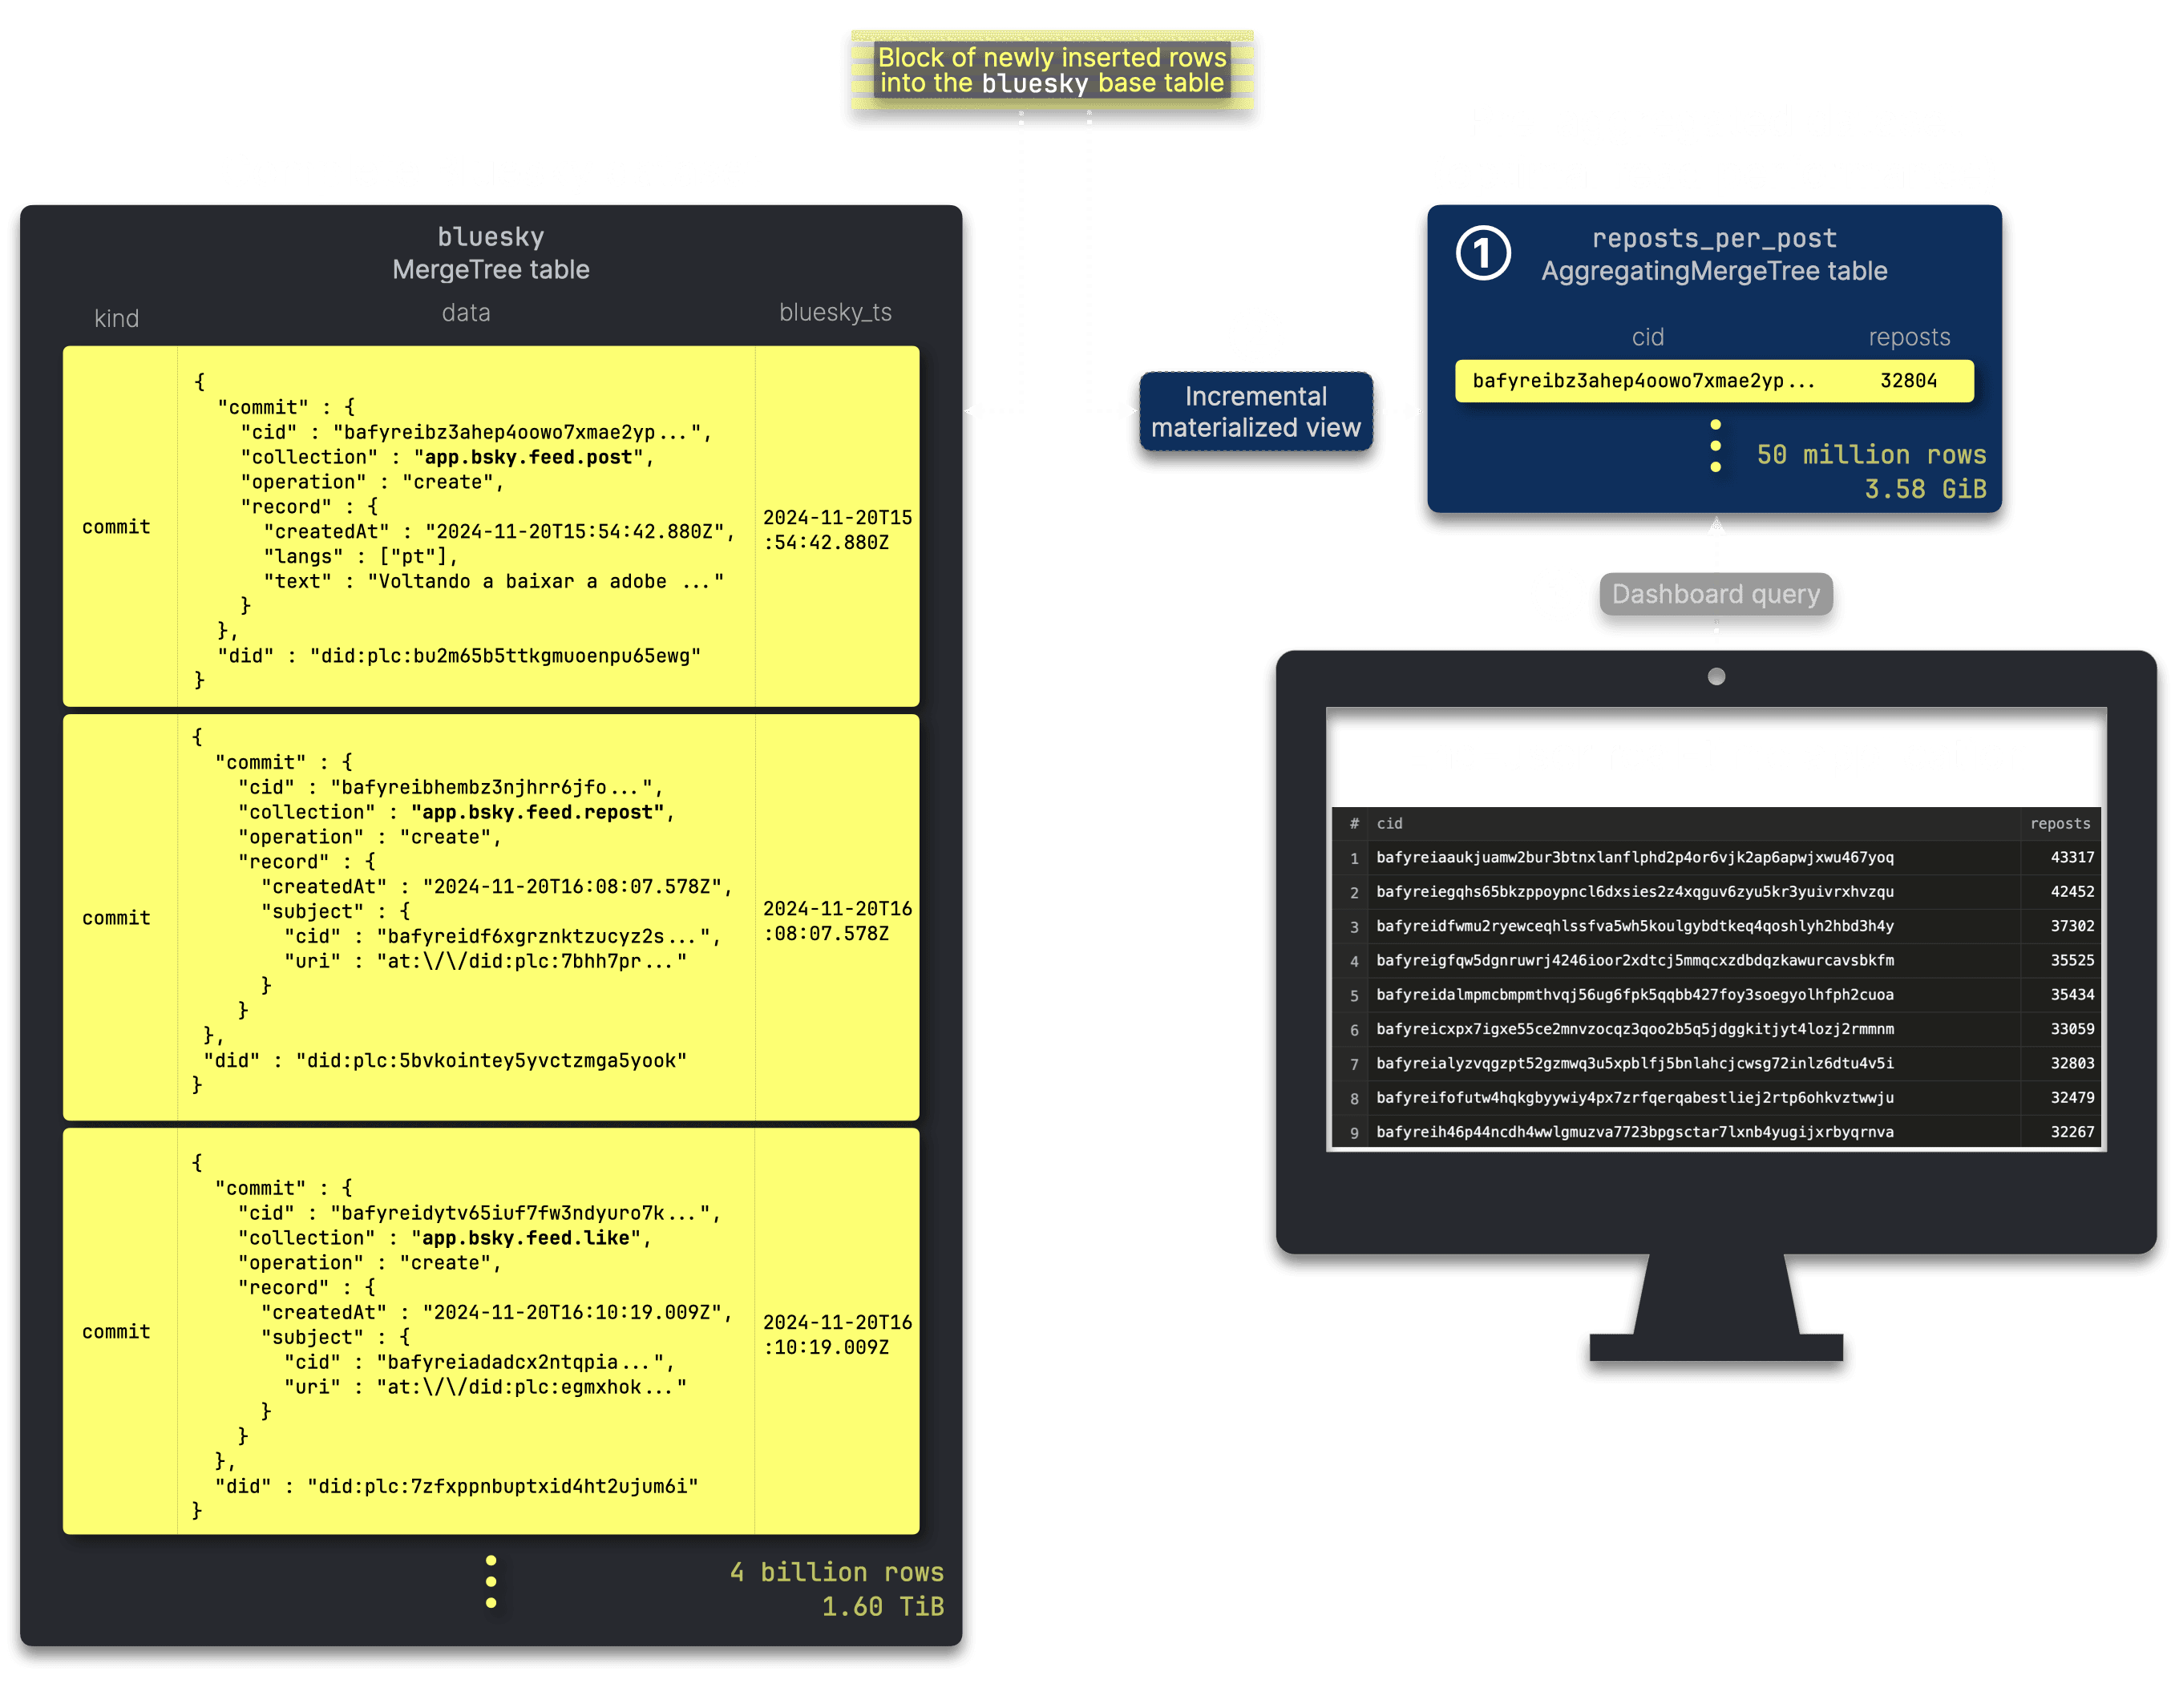
Below are the DDL statements for the reposts_per_post table and its associated incremental materialized view:
1CREATE TABLE bluesky.reposts_per_post
2(
3    cid String,
4    reposts SimpleAggregateFunction(sum, UInt64)
5)
6ENGINE = AggregatingMergeTree
7ORDER BY (cid);
1CREATE MATERIALIZED VIEW bluesky.reposts_per_post_mv TO bluesky.reposts_per_post
2AS
3SELECT
4    data.commit.record.subject.cid::String AS cid,
5    count() AS reposts
6FROM bluesky.bluesky
7WHERE data.commit.collection = 'app.bsky.feed.repost'
8GROUP BY cid;
Measuring pre-aggregated data size #
We check the size of the reposts_per_post target table when its data is fully in sync with the 4+ billion rows full Bluesky dataset table:
Static result for the query above from March 2025:
┌─rows──────────┬─data_size─┐
│ 50.62 million │ 3.58 GiB  │
└───────────────┴───────────┘
Note: The incremental materialized view’s target table is smaller than the full Bluesky dataset table but still substantial in both row count and total (uncompressed) size.
In this scenario, the size of pre-aggregated data depends on the source table: While an incremental materialized view can pre-calculate repost counts, its target table grows alongside the source dataset. Its size and row count scale directly with the ever-increasing number of posts and reposts, as it tracks counts for all existing and future posts.
As we will see below, this impacts query performance, but we’ll revisit this shortly and introduce an additional technique to break this dependency.
Optimized query: still not fast enough (1.7s) #
We run the query from above over the reposts_per_post table with pre-aggregated data:
Execution statistics queried via unrestricted clickhouse-client:
Elapsed: 1.732 sec. Processed 50.62 million rows, 3.85 GB (29.23 million rows/s., 2.22 GB/s.)
Peak memory usage: 9.66 GiB.
In this case, even with pre-aggregated data, the query response isn’t yet instantaneous—though faster (37 seconds and 45 GiB memory usage before), it’s still above the desired <100ms “snappy” threshold.
1s - 2s (slow but tolerable) — Feels sluggish. Use loading indicators.
As mentioned above, the materialized view’s target table grows alongside the base dataset itself.
As a result, even the optimized query over this pre-aggregated data will inevitably slow down as the Bluesky dataset grows.
We need a smarter approach. Do we really need repost counts for every post? No—we only care about the top N most reposted posts. While incremental materialized views alone aren’t directly feasible for maintaining such limited top-N results, we can solve this elegantly with a refreshable materialized view, ensuring we keep only the most relevant reposted posts.
Breaking the performance bottleneck: A smarter approach #
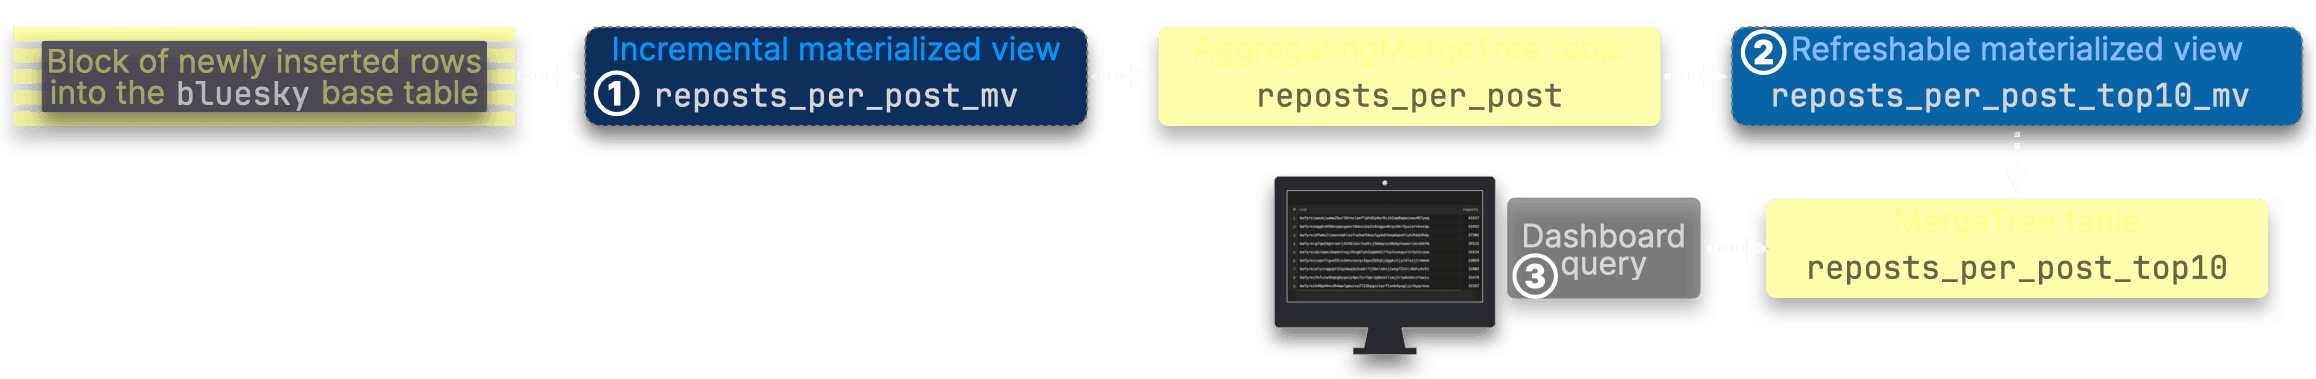
We retain the reposts_per_post table along with its incremental materialized view. Additionally, we introduce ① a refreshable materialized view to continuously maintain the ② compact reposts_per_post_top10 table, which serves as ③ input for the dashboard query. This table is regularly updated—atomically and without affecting running queries—containing only the current top 10 most-reposted posts:
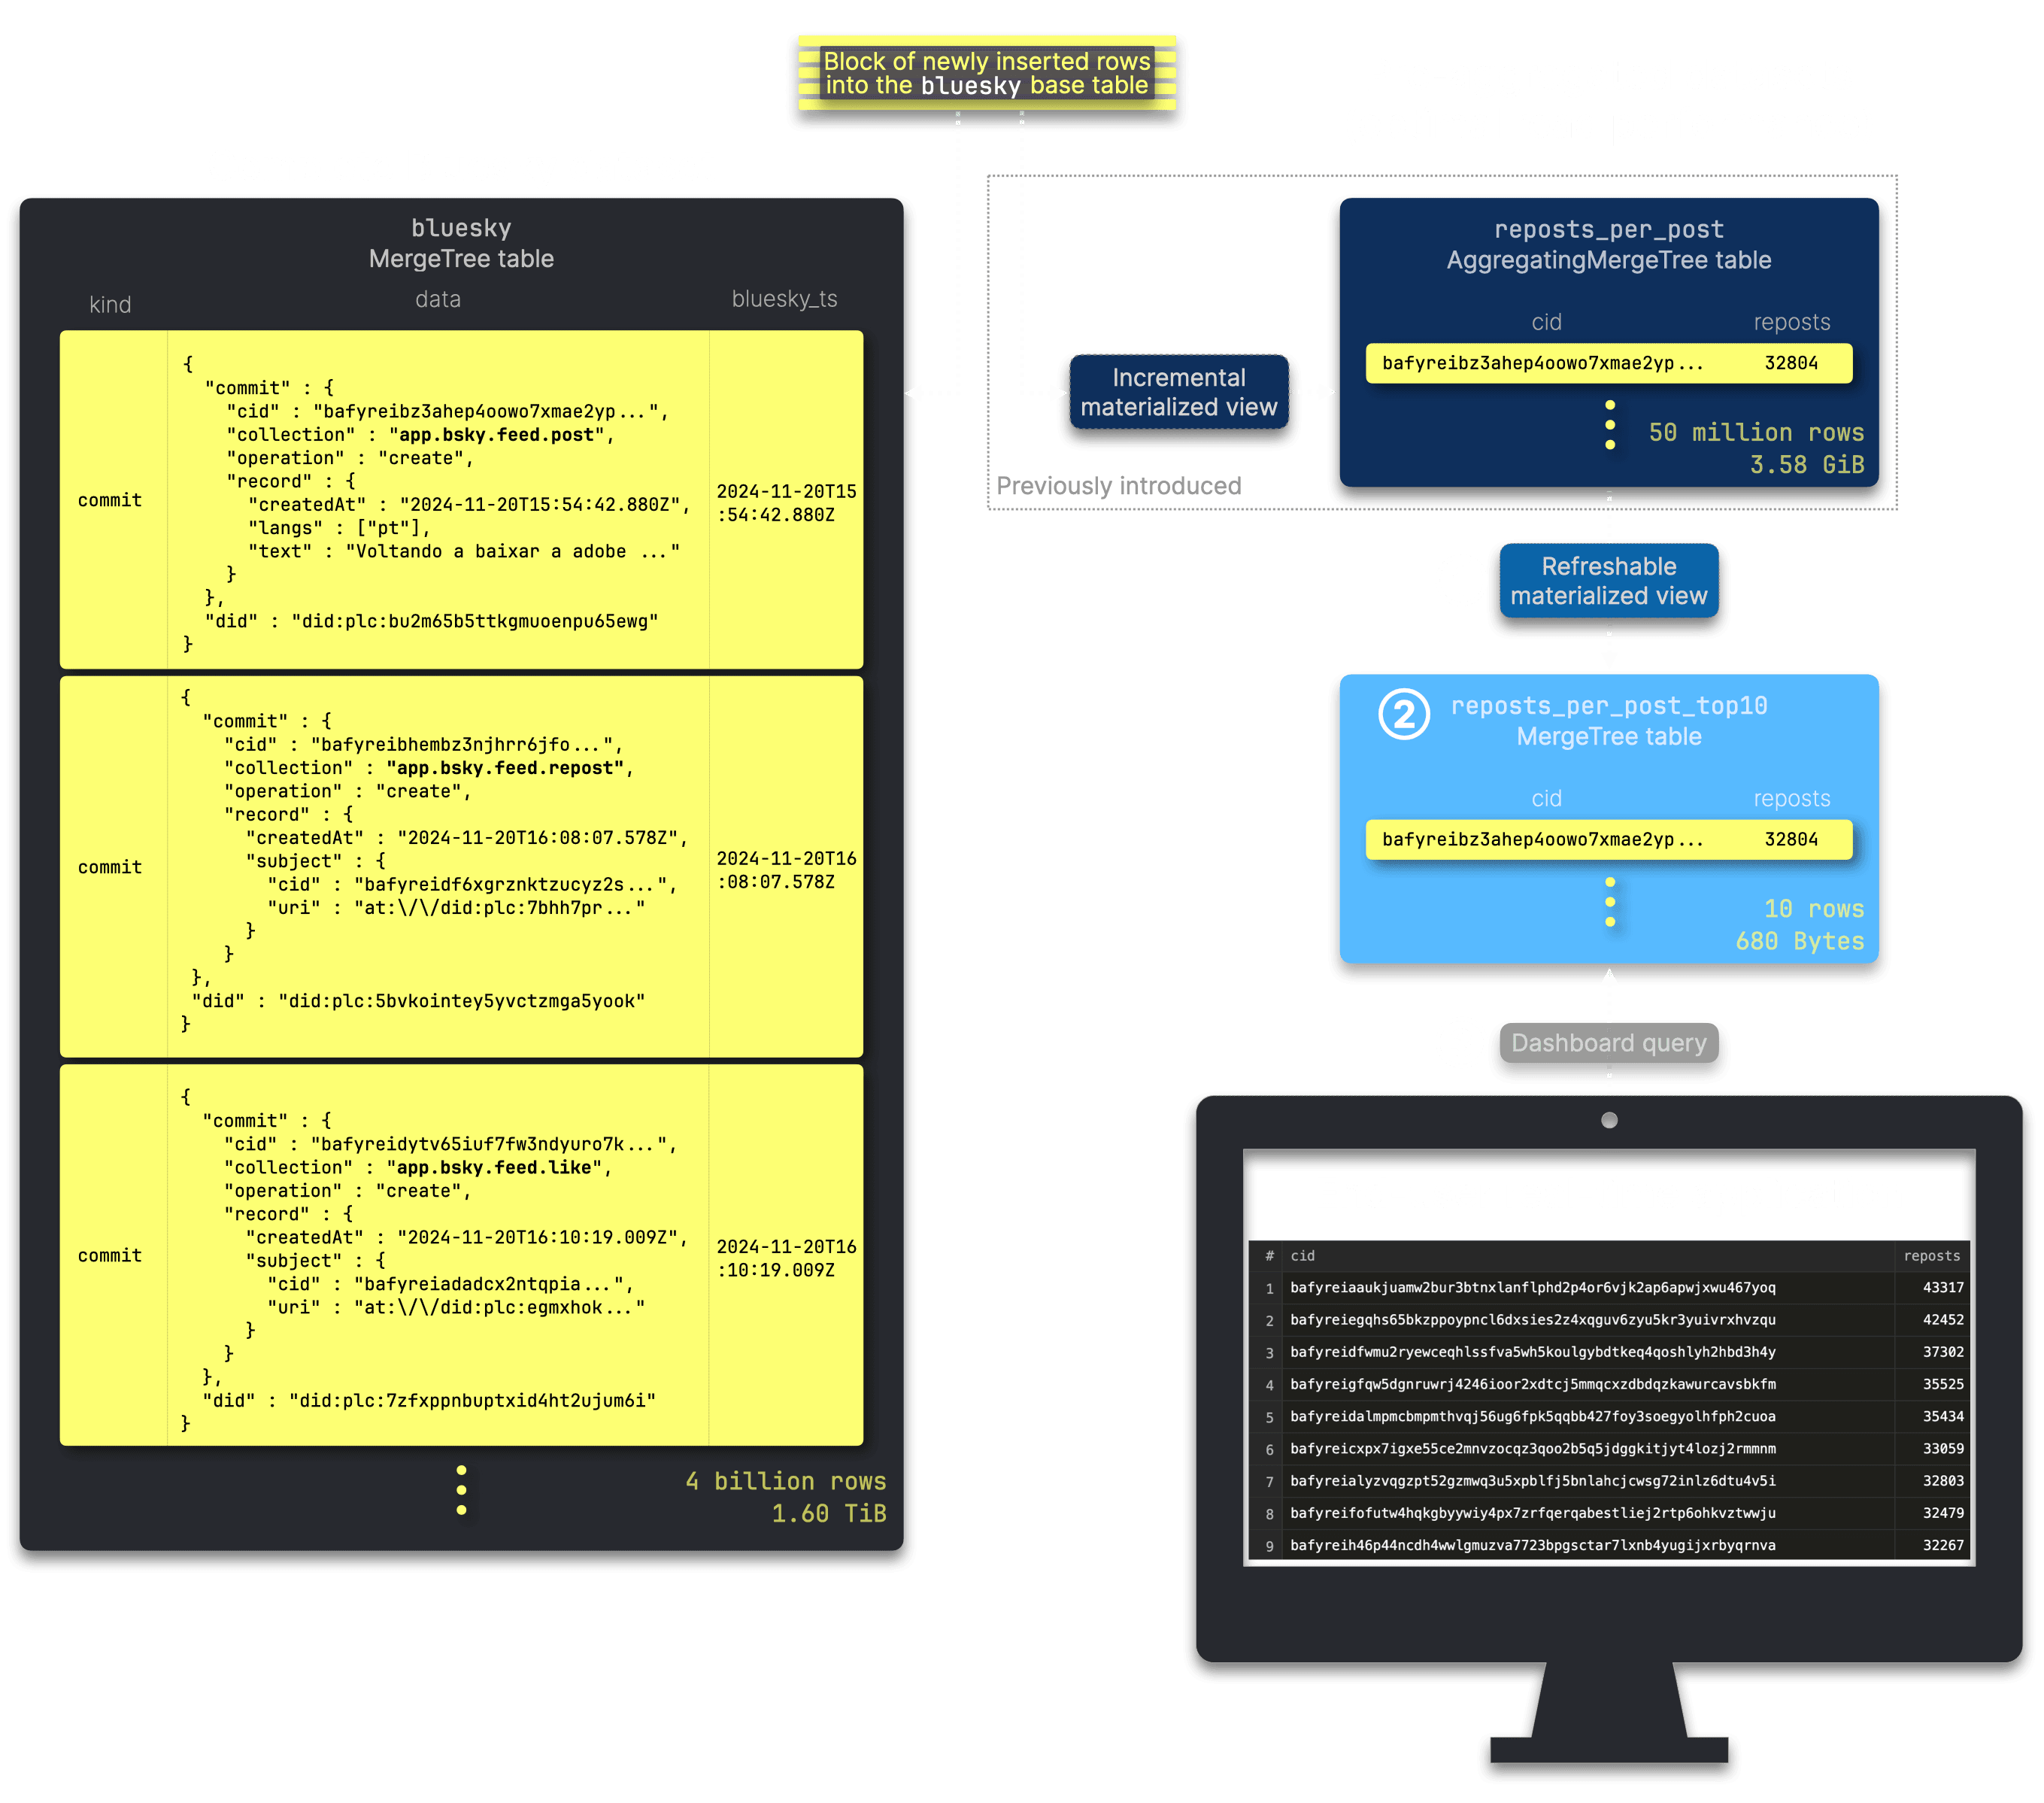
The DDL statement for reposts_per_post_top10 is identical to reposts_per_post:
1CREATE TABLE bluesky.reposts_per_post_top10
2(
3    cid String,
4    reposts UInt64
5)
6ENGINE = MergeTree
7ORDER BY ();
This is the definition for the refreshable materialized view:
1CREATE MATERIALIZED VIEW bluesky.reposts_per_post_top10_mv
2REFRESH EVERY 10 MINUTE TO bluesky.reposts_per_post_top10
3AS
4SELECT
5    cid,
6    sum(reposts) AS reposts
7FROM bluesky.reposts_per_post
8GROUP BY cid
9ORDER BY reposts DESC
10LIMIT 10;
We configured the view to run once every 10 minutes.
An incremental materialized view updates its target table in real-time, staying in sync with its source, while a refreshable materialized view updates at fixed intervals, with the lower bound set by its update query duration.
Running this refreshable materialized view query directly on the complete dataset would take 37 seconds and consume 45 GiB of memory—far too heavy for frequent execution.
However, querying the pre-aggregated and always in sync reposts_per_post table achieves the same result in just 1.7 seconds and uses only 10 GiB of memory, significantly reducing resource usage.
We pair a refreshable materialized view with an incremental one to maximize resource efficiency.
Compact data, instant results #
Now, the best part—as expected, the reposts_per_post_top10 table, when fully synced with the 4+ billion-row Bluesky dataset, consistently holds exactly 10 rows, totaling just about 680 bytes:
Static result for the query above from March 2025:
┌─rows──┬─data_size─┐
│ 10.00 │ 680.00 B  │
└───────┴───────────┘
The size of pre-aggregated data remains independent of the source table: Now, similar to the previous two dashboard examples, the target table’s size and row count is fixed at 10 rows taking 680 bytes in total size, regardless of how large the original Bluesky dataset table grows.
Final optimization: sub-100ms queries #
And here’s the payoff—running the query against the compact reposts_per_post_top10 table (always exactly 10 rows) guarantees instantaneous (<100ms) response times, every single time:
Execution statistics queried via unrestricted clickhouse-client:
Elapsed: 0.002 sec.
<100ms (instant) — Feels instant, ideal for filtering or quick updates.
Memory comparison: 28 KiB vs 45 GiB #
To illustrate how our optimized approach drastically reduces memory usage, the table below compares memory consumption across all three key components.
| Metric | Baseline query | ① Incremental MV | ② Refreshable MV | ③ Optimized query |
|---|---|---|---|---|
| Memory usage | 45 GiB | 37.62 MiB | ~10 GiB | 28.44 KiB |
| Rows processed | Full dataset | ~647.18k per update | 54.4 million per refresh | 10 rows (Top 10) |
| Duration | 37 sec | ~412 ms per update | 2.6 sec per refresh | Instantaneous |
| Metrics source | Execution statistics | Query views log | View refreshes log | Query log |
Even at peak usage, the combined memory footprint of all three components stays significantly lower than the original 45 GiB baseline, demonstrating the efficiency of this approach.
Enriching repost results with post content #
As mentioned earlier, this scenario introduces an additional challenge: the dashboard must display the most reposted Bluesky posts, but repost events contain only post identifiers (CIDs), not the actual post content.
We tackle this efficiently by:
-
Creating an ① incremental materialized view to pre-populate a ② dedicated
cid_to_text tablewith the content of each new post, optimized for fast CID lookups. -
Extending our refreshable materialized view to leverage this structure, enabling an efficient ③ join to retrieve and store the text content for the top 10 reposted posts in the compact
reposts_per_post_top10table, which ④ serves as input for the dashboard query.
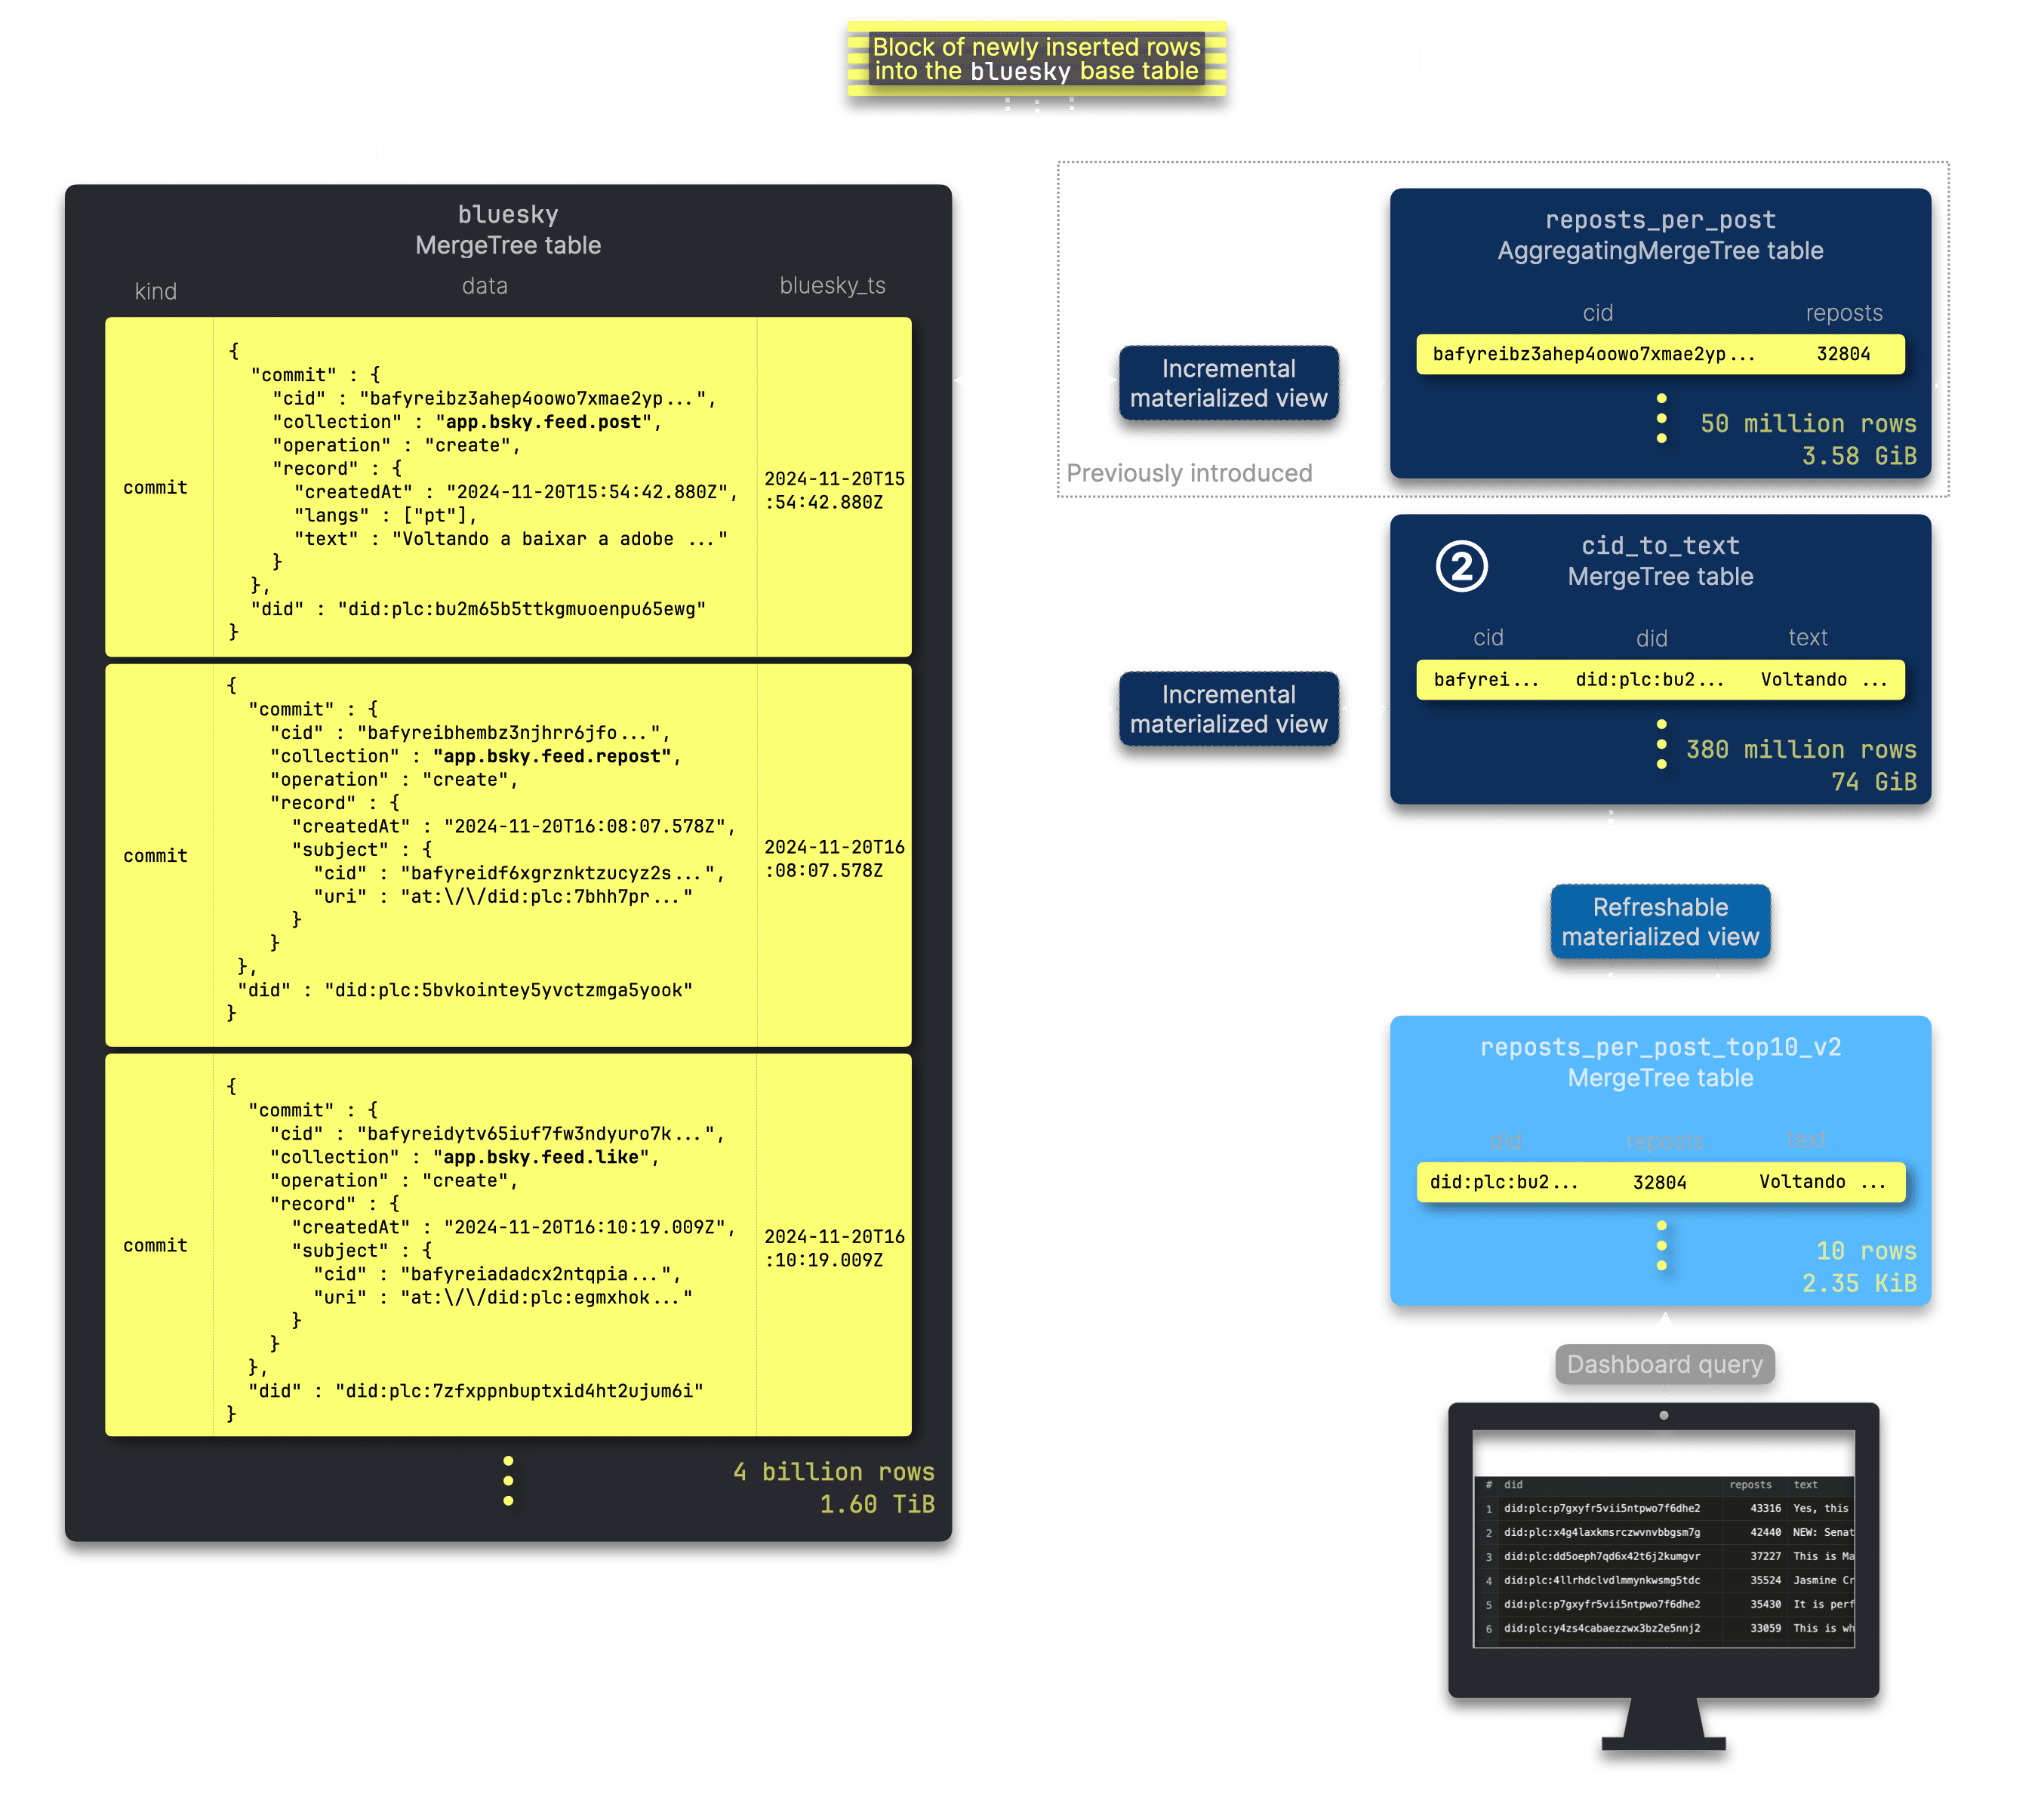
The primary key (kind, bluesky_ts) of the complete Bluesky dataset table isn’t optimal for quick lookups of post content by CID, especially at billions of rows. To solve this, we create a dedicated cid_to_text table with a primary key optimized specifically for efficient CID-based text retrieval:
1CREATE TABLE bluesky.cid_to_text
2(
3    cid String,
4    did String,
5    text String
6)
7ENGINE = MergeTree
8ORDER BY (cid);
This is the DDL for the incremental materialized view populating the cid_to_text table whenever a new text is posted:
1CREATE MATERIALIZED VIEW bluesky.cid_to_text_mv
2TO bluesky.cid_to_text
3AS
4SELECT
5    data.commit.cid AS cid,
6    data.did AS did,
7    data.commit.record.text AS text
8FROM bluesky.bluesky
9WHERE (kind = 'commit') AND (data.commit.collection = 'app.bsky.feed.post');
Note that the cid_to_text table’s size scales with the complete Bluesky dataset. However, since it’s only queried periodically by the refreshable view—which doesn’t require instantaneous response times—this dependency is acceptable and won’t impact real-time dashboard performance.
Optimizing joins with fast post content lookups #
Before presenting the DDL for the final refreshable materialized view, let’s first examine the join query it will leverage. This query identifies the top 10 reposted posts and enriches them with their text content by joining two optimized tables: the pre-aggregated reposts_per_post table (left side of the join), and the dedicated cid_to_text table (right side of the join for retrieving the text per CID from the left side):
1WITH top_reposted_cids AS
2(
3  SELECT
4    cid,
5    sum(reposts) AS reposts
6  FROM bluesky.reposts_per_post
7  GROUP BY cid
8  ORDER BY reposts DESC
9  LIMIT 10
10)
11SELECT
12    t2.did AS did,
13    t1.reposts AS reposts,
14    t2.text AS text
15FROM top_reposted_cids AS t1
16LEFT JOIN bluesky.cid_to_text AS t2
17ON t1.cid = t2.cid;
Execution statistics queried via unrestricted clickhouse-client:
Elapsed: 295.427 sec. Processed 379.42 million rows, 85.14 GB (1.28 million rows/s., 288.18 MB/s.)
Peak memory usage: 126.77 GiB.
Ouch—almost 300 seconds and 127 GiB of memory usage clearly isn’t ideal.
The issue here is that the join query planner doesn’t yet push down filter conditions based on the left hand side to the right hand side of the join. But we can simply do that manually and very efficiently by exploiting the primary key of the right hand side table for the join:
1WITH top_reposted_cids AS
2(
3  SELECT
4    cid,
5    sum(reposts) AS reposts
6  FROM bluesky.reposts_per_post
7  GROUP BY cid
8  ORDER BY reposts DESC
9  LIMIT 10
10)
11SELECT
12    t2.did AS did,
13    t1.reposts AS reposts,
14    t2.text AS text
15FROM top_reposted_cids AS t1
16LEFT JOIN
17(
18    SELECT *
19    FROM bluesky.cid_to_text
20    WHERE cid IN (SELECT cid FROM top_reposted_cids)
21) AS t2 ON t1.cid = t2.cid;
Execution statistics queried via unrestricted clickhouse-client:
Elapsed: 3.681 sec. Processed 102.37 million rows, 7.78 GB (27.81 million rows/s., 2.11 GB/s.)
Peak memory usage: 9.91 GiB.
By pre-filtering the large cid_to_text table on the right-hand side of the join with the CIDs of the top 10 most reposted posts—an efficient operation that leverages the table’s primary key—the query now completes in 3.6 seconds instead of 300 and uses only 9.91 GiB of RAM instead of 127 GiB.
Maintaining the top 10 reposted posts efficiently #
We use the join query from above as the query for our final refreshable materialized view that regularly updates this target table with the top 10 most reposted posts and their texts (plus the DIDs of their original authors):
1CREATE TABLE bluesky.reposts_per_post_top10_v2
2(
3  did String,
4  reposts UInt64,
5  text String
6)
7ENGINE = MergeTree
8ORDER BY ();
This is the DDL for the refreshable materialized view:
1CREATE MATERIALIZED VIEW bluesky.reposts_per_post_top10_mv_v2
2REFRESH EVERY 10 MINUTE TO bluesky.reposts_per_post_top10_v2
3AS
4WITH top_reposted_cids AS
5(
6  SELECT
7    cid,
8    sum(reposts) AS reposts
9  FROM bluesky.reposts_per_post
10  GROUP BY cid
11  ORDER BY reposts DESC
12  LIMIT 10
13)
14SELECT
15    t2.did AS did,
16    t1.reposts AS reposts,
17    t2.text AS text
18FROM top_reposted_cids AS t1
19LEFT JOIN
20(
21    SELECT *
22    FROM bluesky.cid_to_text
23    WHERE cid IN (SELECT cid FROM top_reposted_cids)
24) AS t2 ON t1.cid = t2.cid;
How small is the final aggregated data? #
As expected, when the reposts_per_post_top10_v2 table is fully in sync with the 4+ billion rows full Bluesky dataset table, it consistently contains always exactly 10 rows, totaling just 2.35 KiB in size:
Static result for the query above from March 2025:
┌─rows──┬─data_size─┐
│ 10.00 │ 2.35 KiB  │
└───────┴───────────┘
Final optimized query: 3ms response time for instant results #
Running the query against the compact reposts_per_post_top10_v2 table (always exactly 10 rows) guarantees instantaneous response times, every single time:
Execution statistics queried via unrestricted clickhouse-client:
Elapsed: 0.003 sec.
<100ms (instant) — Feels instant, ideal for filtering or quick updates.
Memory usage of accelerated query (45 KiB vs 45 GiB) #
Our optimization now includes four key components, each playing a role in drastically reducing memory consumption while maintaining real-time performance.
| Metric | Baseline query | ① Incremental MV (reposts_per_post_mv) | ② Incremental MV (cid_to_text_mv) | ③ Refreshable MV (reposts_per_post_top10_mv_v2) | ④ Optimized query |
|---|---|---|---|---|---|
| Memory usage | 45 GiB | 37.62 MiB | 327.70 MiB | ~10 GiB | 45.71 KiB |
| Rows processed | Full dataset | ~647.18k per update | ~646.20k per update | 109.69 million per refresh | 10 rows (Top 10) |
| Duration | 37 sec | ~412 ms per update | ~1.27 sec per update | 3.65 sec per refresh | Instantaneous |
| Metrics source | Execution statistics | Query views log | Query views log | View refreshes log | Query log |
The total memory usage across all four components—37.62 MiB, 327.70 MiB, 10 GiB, and 45.71 KiB—remains lower than the 45 GiB consumed by the baseline query.
Mapping DIDs to user handles in real-time #
So far, this third real-time dashboard scenario has presented two key challenges:
-
Efficient top-N retrieval: Incremental materialized views alone weren’t sufficient, requiring a refreshable materialized view to maintain the top N most reposted posts.
-
Enriching repost data: Since repost events contain only the post identifier (CID) and not the text, we needed to join two tables to retrieve and display the full post content.
But there’s still one missing piece—right now, we’re displaying reposts by DID, which doesn't look good on a dashboard. Next, let’s map those IDs to real user handles in real-time.
The JSON documents for post, repost, like events, and similar Bluesky actions do not contain user handles or names—only their DIDs:
Unlike DIDs, handles and names can change at any time due to identity events in Bluesky:

Fortunately, ClickHouse offers a perfect solution for this scenario: updatable in-memory dictionaries, allowing efficient real-time lookups and seamless updates.
Dictionaries are a key feature of ClickHouse providing in-memory key-value representation of data from various internal and external sources, optimized for super-low latency lookup queries.
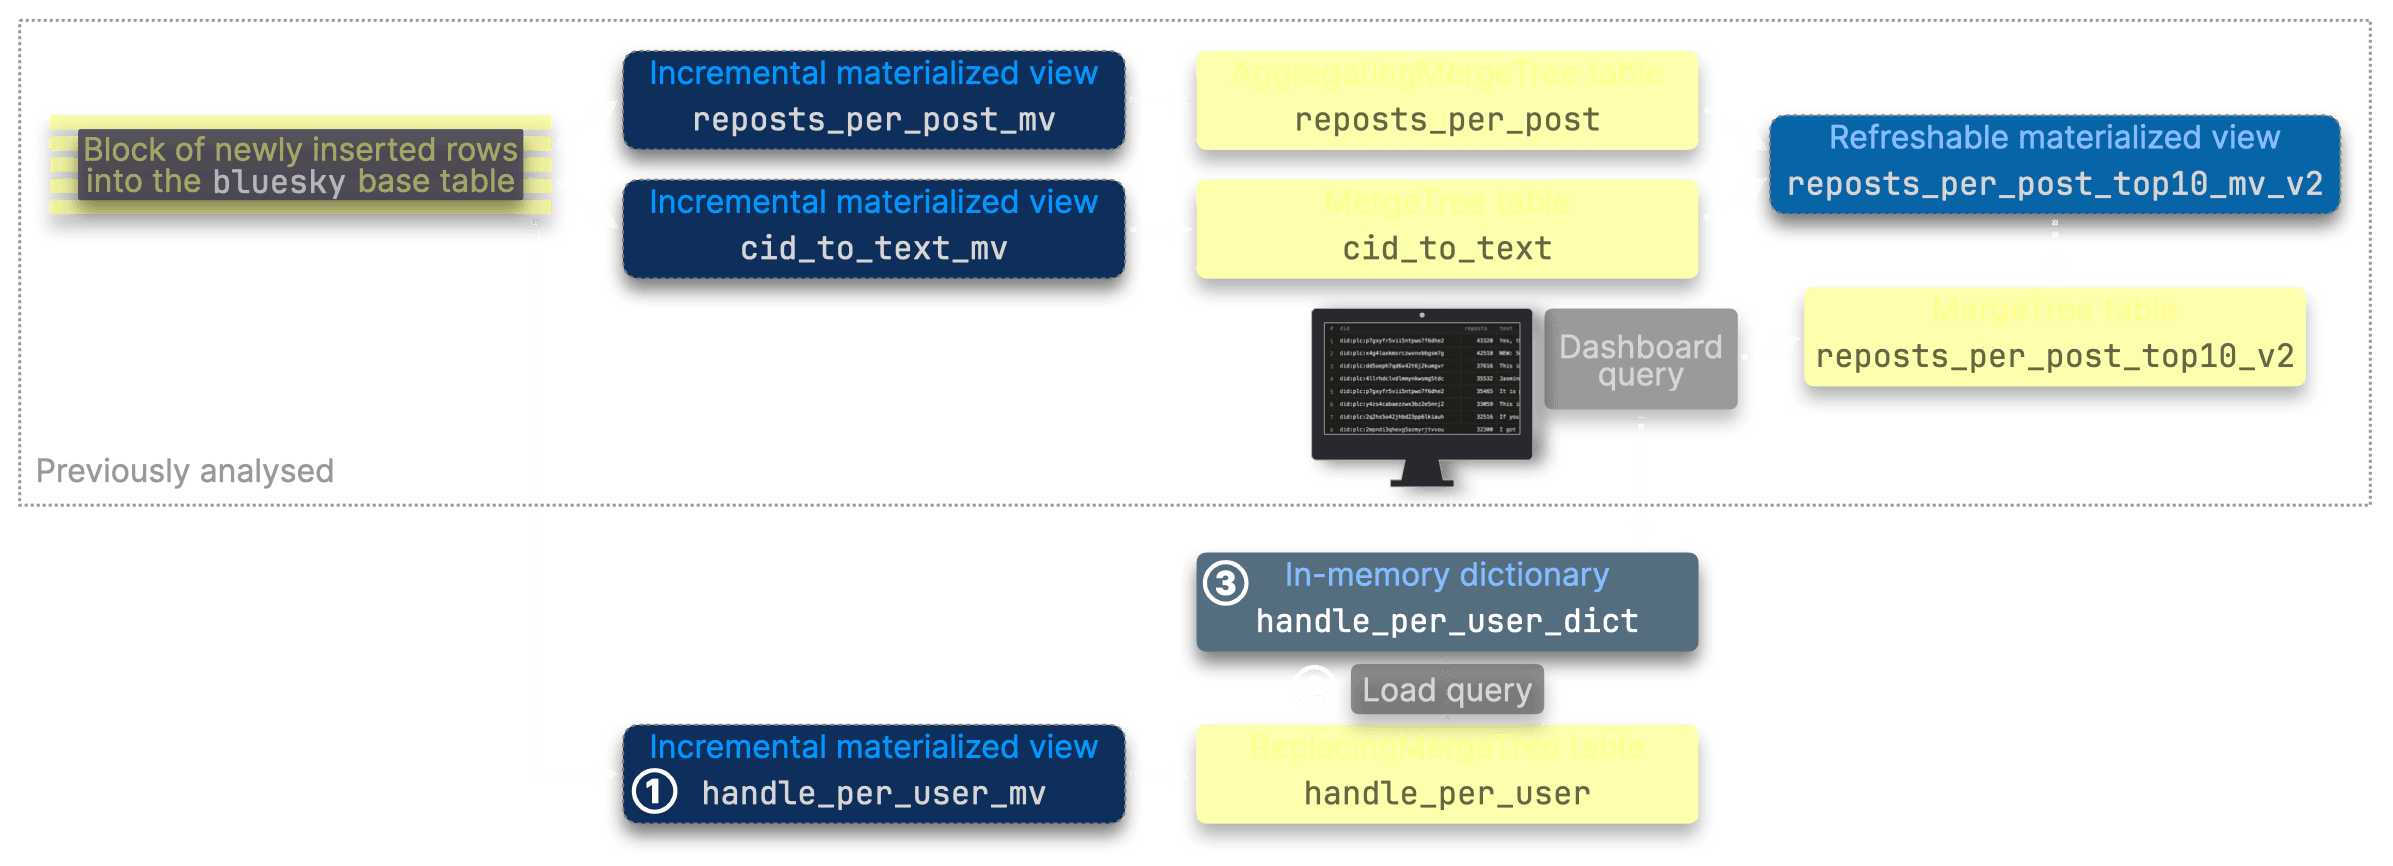
The diagram below illustrates how, in our dashboard scenarios, an in-memory dictionary is created and loaded to enable efficient real-time lookups for dynamic metadata, such as user handles, allowing dashboards to be enriched on-the-fly with up-to-date information at query time:
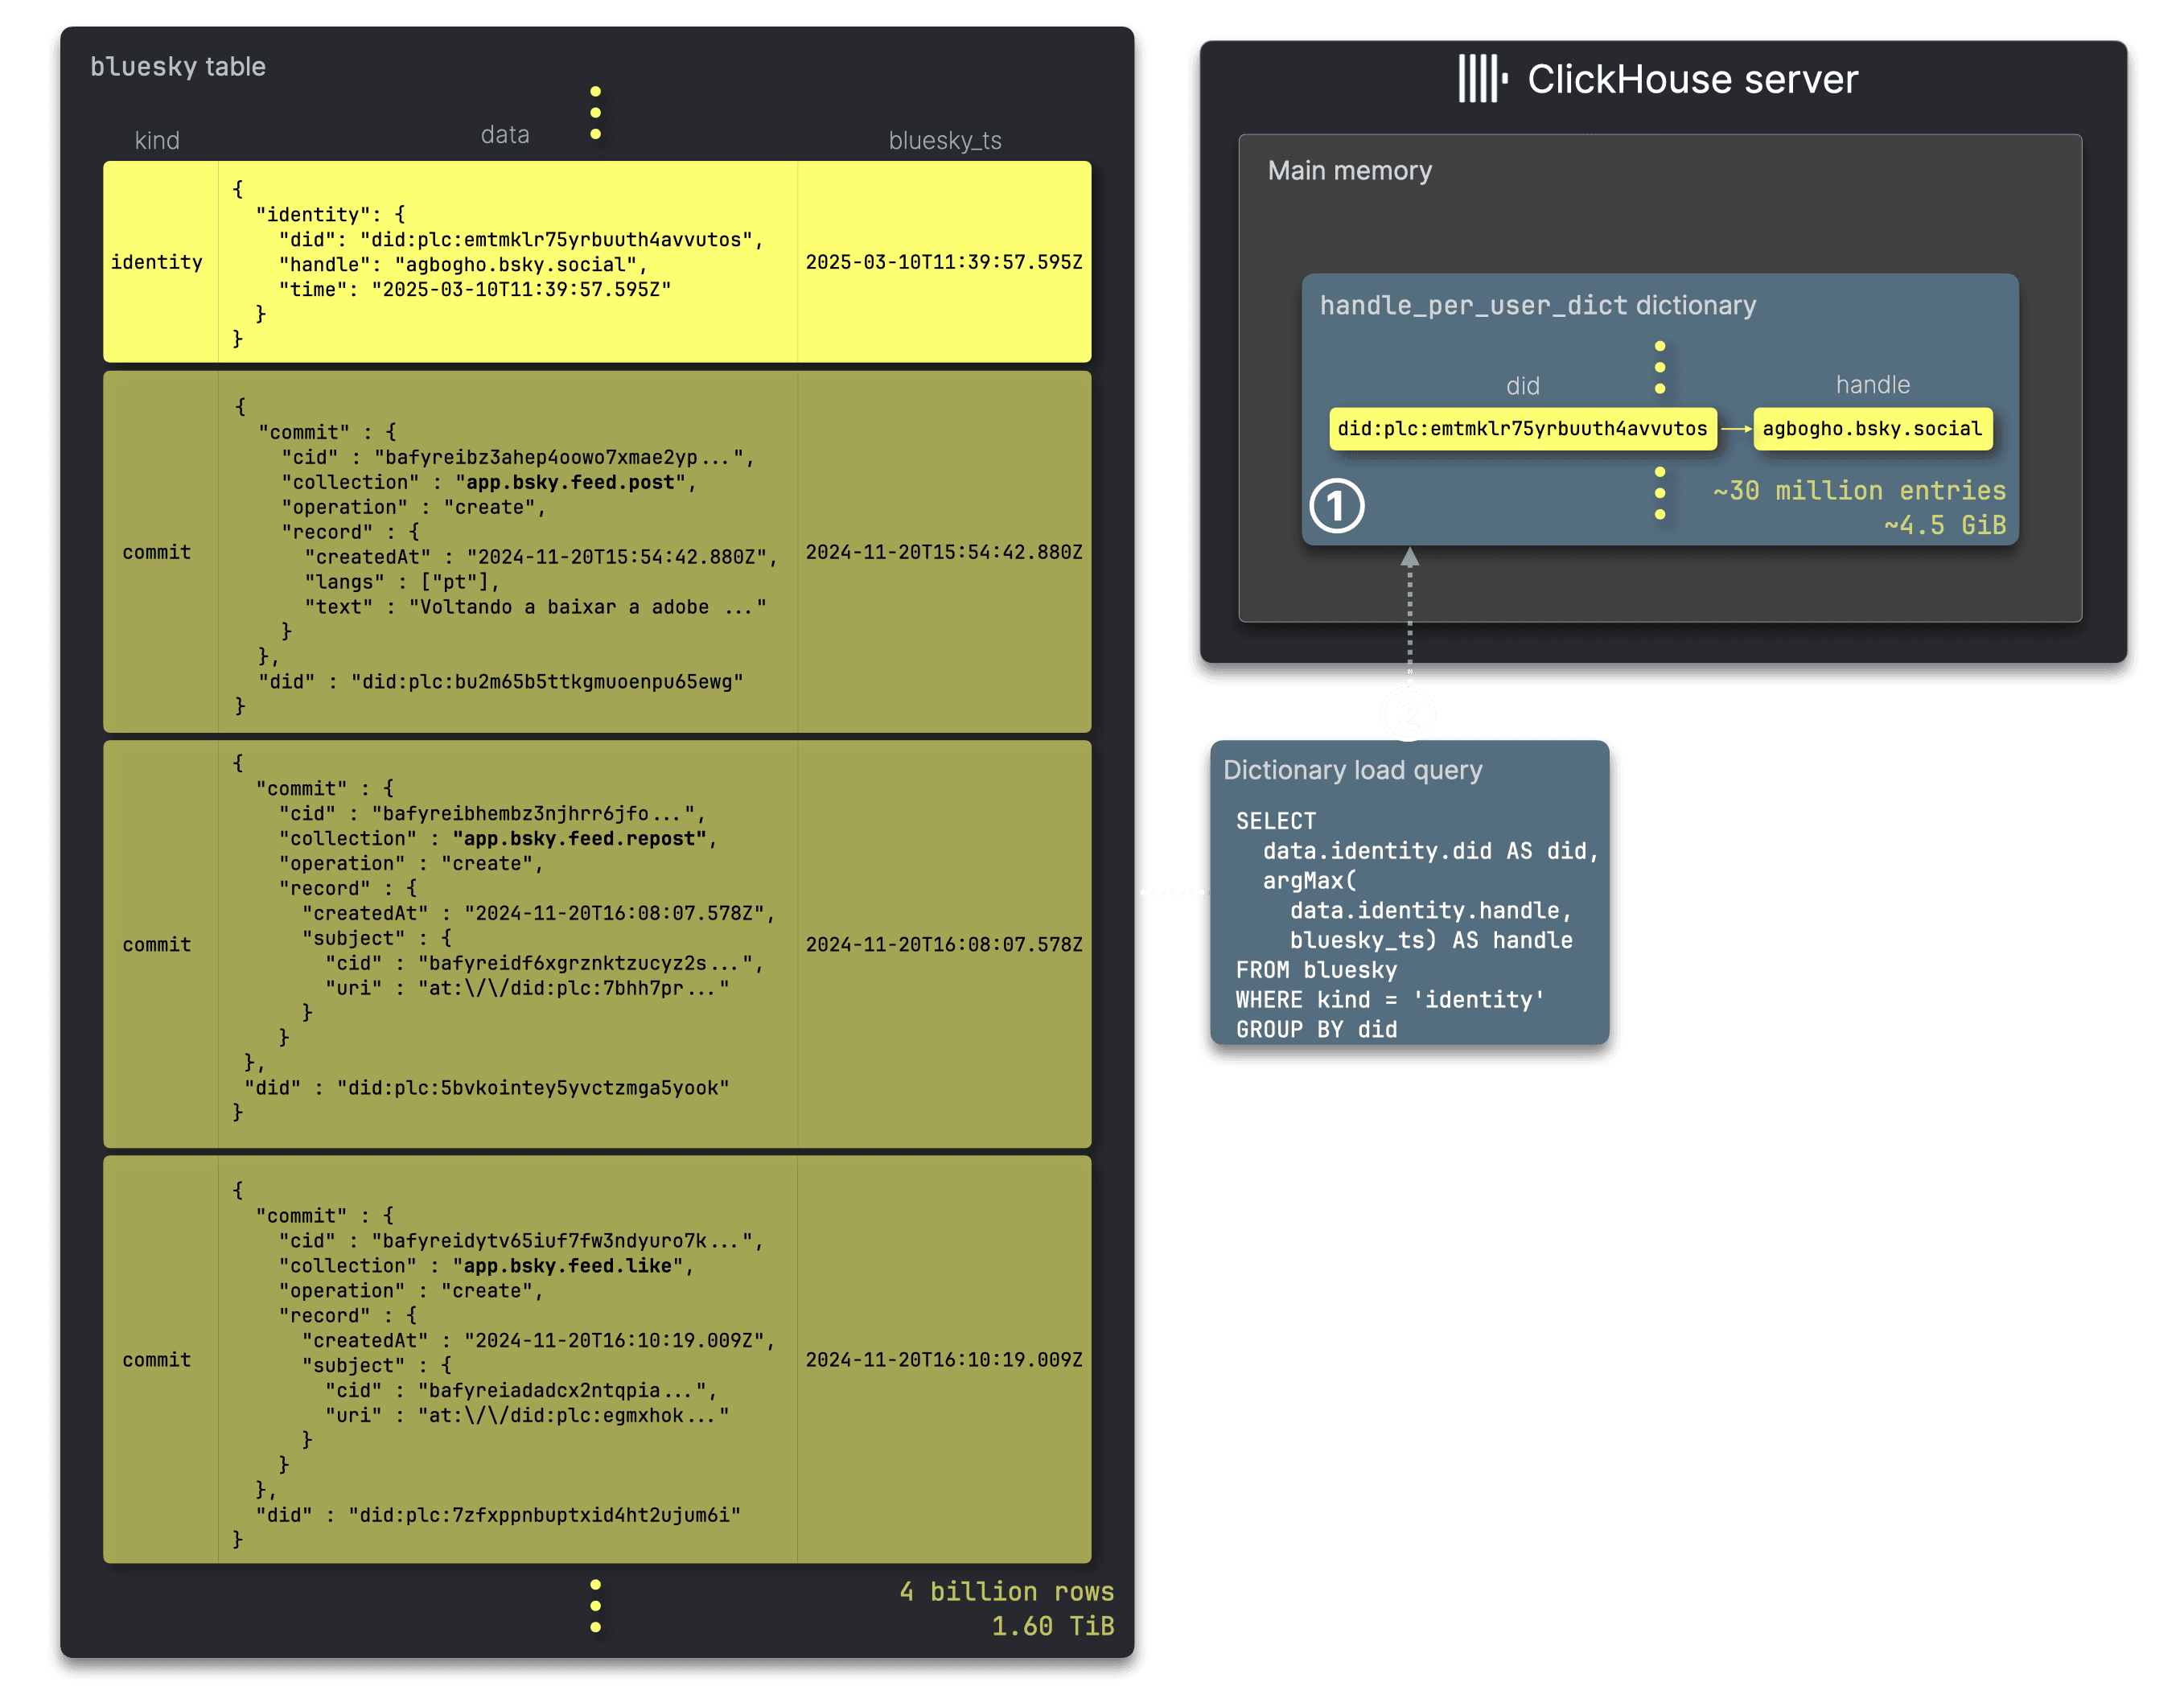
We create (see below) an ① handle_per_user_dict dictionary to map persistent, long-term Bluesky user identifiers (DIDs) to their latest corresponding user handles. When a user changes their handle, the Bluesky API streams an identity JSON document. By grouping these documents by DID value, we use the argMax aggregate function in ClickHouse to retrieve the handle from the latest identity document per unique DID—forming the basis of the ② dictionary load query.
Like refreshable materialized views, a dictionary can be periodically updated atomically—ensuring that queries performing lookups remain unaffected—by periodically executing its load query.
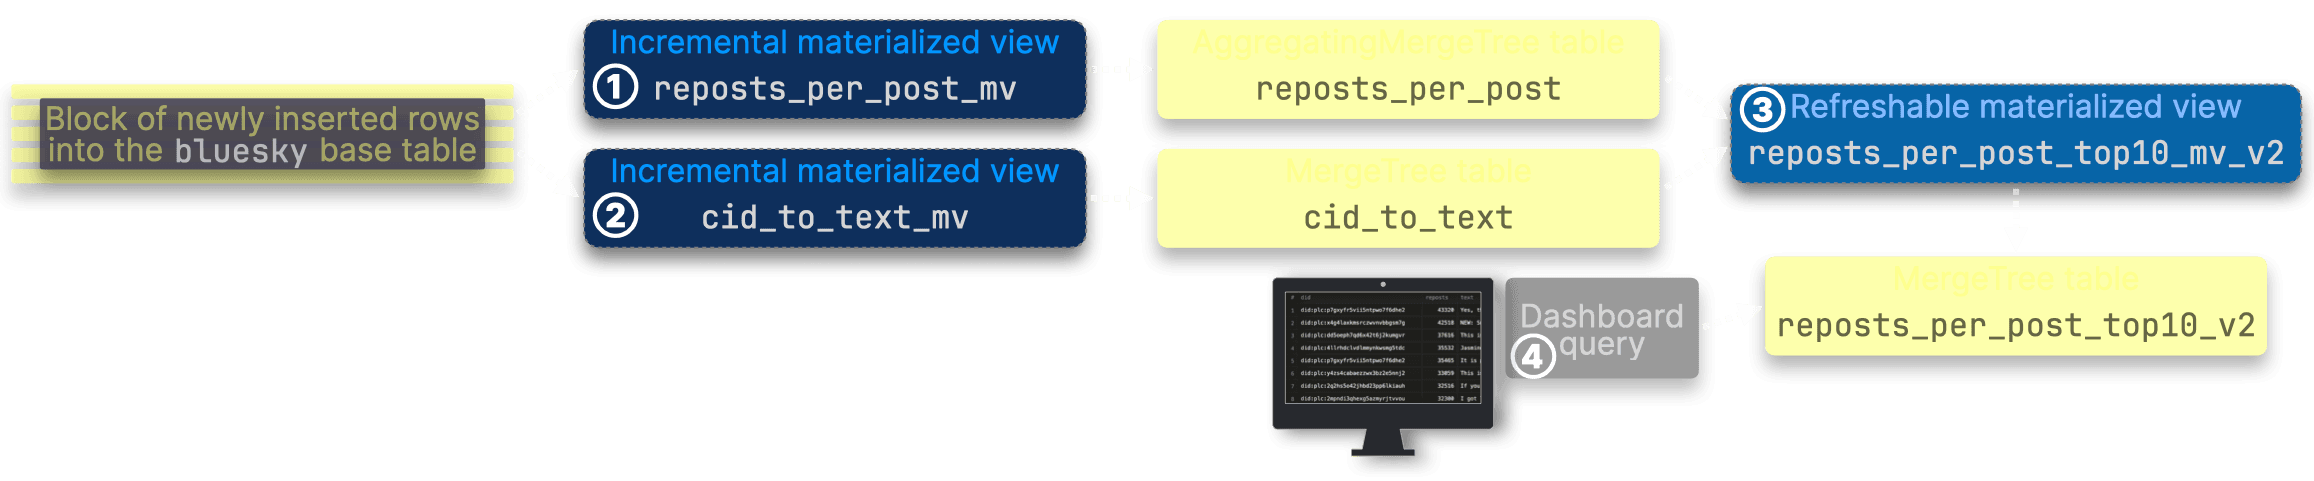
To avoid repeatedly running the argMax aggregation on the ever-growing 4+ billion-row Bluesky dataset, we introduce an efficiency optimization, as illustrated in the next diagram:
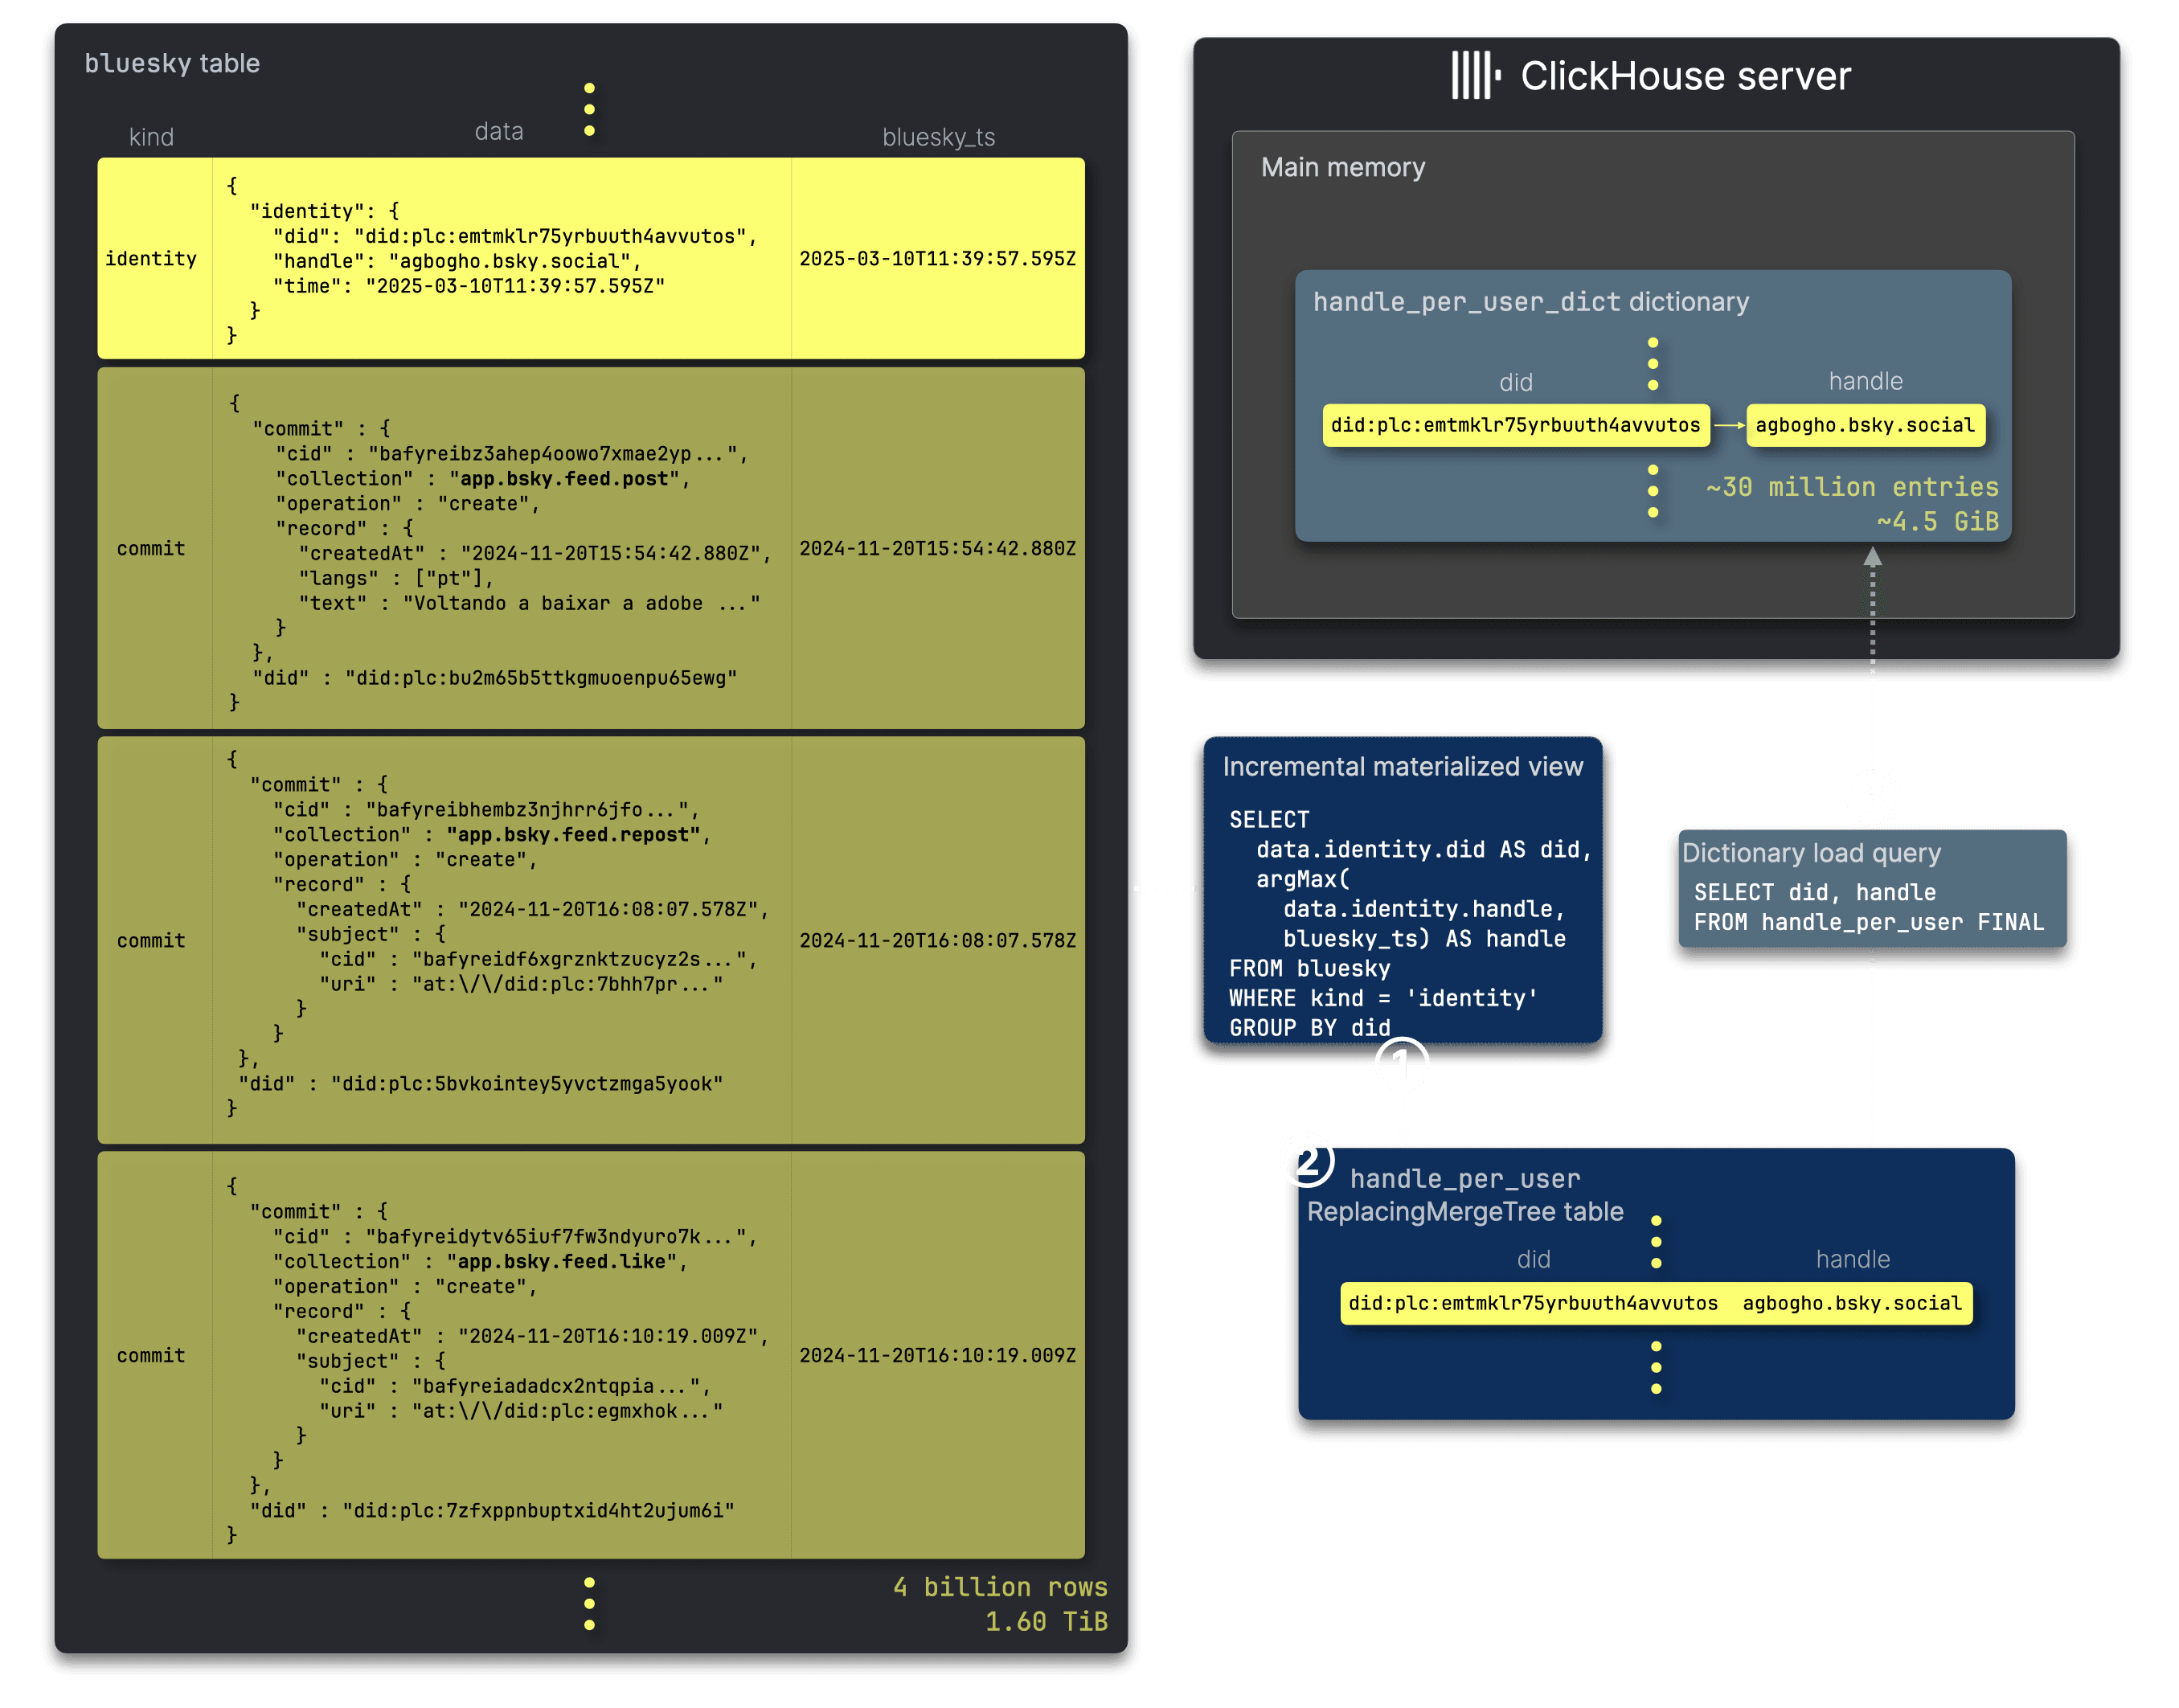
We introduce an ① additional incremental materialized view that runs the argMax aggregation only on newly inserted blocks of rows, storing the pre-aggregated data in a ② ReplacingMergeTree table. This table’s background merges ensure that only the latest handle per unique DID is retained. The dictionary’s ③ load query then runs against this smaller table, using the FINAL modifier to finalize row replacements from unmerged parts at query time.
Next, we present the DDL statements to set this up.
This is the DDL for the incremental materialized view’s target table:
1CREATE TABLE bluesky.handle_per_user
2(
3    did String,
4    handle String
5)
6ENGINE = ReplacingMergeTree
7ORDER BY (did);
This is the incremental materialized view:
1CREATE MATERIALIZED VIEW bluesky.handle_per_user_mv
2TO bluesky.handle_per_user
3AS
4SELECT
5    data.identity.did::String AS did,
6    argMax(data.identity.handle, bluesky_ts) AS handle
7FROM bluesky.bluesky
8WHERE (kind = 'identity')
9GROUP BY did;
Finally, we create the in-memory dictionary with a query against the materialized view’s target table to load its content. We also set a time interval (in seconds) for updates, allowing ClickHouse to randomly distribute the update time within this range—helping to balance the load when updating across a large number of servers:
1CREATE DICTIONARY bluesky.handle_per_user_dict
2(
3    did String,
4    handle String
5)
6PRIMARY KEY (did)
7SOURCE(CLICKHOUSE(QUERY $query$
8    SELECT did, handle
9    FROM bluesky.handle_per_user FINAL
10$query$))
11LIFETIME(MIN 300 MAX 360)
12LAYOUT(complex_key_hashed());
Note that dictionaries are either loaded at server startup or at first use, depending on the dictionaries_lazy_load setting.
Users can also manually trigger a load by running a SYSTEM command. When used with the ON CLUSTER clause, this ensures that all compute nodes in our Cloud service load the dictionary into memory:
1SYSTEM RELOAD DICTIONARY bluesky.handle_per_user_dict ON cluster default;
Now the dictionary is ready to be used ad-hocly in our dashboard queries for mapping DIDs to user handles, for example:
Static result for the query above from March 2025:
┌─handle──────────────┐
│ agbogho.bsky.social │
└─────────────────────┘

1 row in set. Elapsed: 0.001 sec.
Final query: real-time repost rankings with user handles (3ms response time) #
With everything in place, we can now run our final dashboard 3 query, using the dictionary to fetch the latest handles for the DIDs of the top 10 most reposted posts:
Execution statistics queried via unrestricted clickhouse-client:
Elapsed: 0.003 sec.
Note that we use the dictGetOrDefault function, which returns the DID if no mapping is found in the dictionary.
In theory, the dictionary could contain as many entries as there are Bluesky users—currently around 30 million. However, since we began ingesting Bluesky event data in real-time in December 2024, it only includes mappings from handle or name change events recorded since that date.
As of March 2025, the dictionary contains ~8 million entries, consuming 1.12 GiB of memory (queried via unrestricted clickhouse-client):
1SELECT
2    status,
3    element_count AS entries,
4    formatReadableSize(bytes_allocated) AS memory_allocated,
5    formatReadableTimeDelta(loading_duration) AS loading_duration
6FROM system.dictionaries
7WHERE database = 'bluesky' AND name = 'handle_per_user_dict';
┌─status─┬─entries─┬─memory_allocated─┬─loading_duration─┐
│ LOADED │ 7840778 │ 1.12 GiB         │ 4 seconds        │
└────────┴─────────┴──────────────────┴──────────────────┘
With 30 million entries, we estimate the dictionary size would reach ~4.5 GiB.
If the number of Bluesky users continues to grow, we may need to revisit whether an in-memory dictionary remains the best approach.
Memory overhead from dictionary usage #
To efficiently maintain an up-to-date dictionary without scanning the full 4+ billion-row dataset, we introduced an incremental materialized view to pre-aggregate handle changes. The dictionary itself refreshes at regular intervals via a load query, ensuring minimal overhead.
| Metric | Baseline query | ① Incremental MV (handle_per_user_mv) | ② Dictionary load query | ③ Dictionary storage (projected at 30M entries) |
|---|---|---|---|---|
| Memory usage | 45 GiB | 5.77 KiB | 479 MiB | 1.12 GiB → 4.5 GiB (projected) |
| Rows processed | Full dataset | ~645.87k per update | 8.89 million per refresh | 30 million entries (projected) |
| Duration | Long-running | ~285 ms per update | 106 ms per refresh | N/A |
| Metrics source | Execution statistics | Query views log | Query log | Estimated based on dictionaries metrics |
Even after factoring in the dictionary and its updates, plus the previously analysed optimized dashboard query, the total memory usage across all components remains well below the 45 GiB baseline query.
By carefully structuring incremental updates and periodic dictionary refreshes, we achieve efficient, low-latency lookups without the memory burden of full dataset scans.
Now, let’s step back and see the impact of these optimizations across all three dashboard scenarios.
Mission accomplished: sustained <100ms query performance #
With our optimizations, dashboard queries now run in under 100ms, no matter how much the dataset grows—even on moderate hardware. The key? Ensuring queries always operate on small, stable, and pre-aggregated data.
Despite 4+ billion JSON documents, with 1.5 billion new documents added every month, our input tables remain compact:
| Scenario | Pre-aggregated table | Rows | Size |
|---|---|---|---|
| Dashboard 1: Activity by hour | events_per_hour_of_day | 892 | 11.24 KiB |
| Dashboard 2: Ranked event types | top_event_types | 109 | 2.27 MiB |
| Dashboard 3: Most reposted posts | reposts_per_post_top10_v2 | 10 | 2.35 KiB |
The secret to fast queries at scale #
The trick is simple: never scan the full dataset, but always stay up-to-date.
- Dashboards 1 & 2: Incremental materialized views continuously update pre-aggregated tables in real-time.
- Dashboard 3: A refreshable materialized view maintains only the most relevant top-N results.
This ensures dashboard queries always run on small, stable, and fresh tables, regardless of dataset growth.
From sluggish to snappy: Before vs. after #
| Dashboard | Baseline query | Optimized query | Speedup | Memory usage reduction |
|---|---|---|---|---|
| Activity by hour | 44s (775 MiB) | 6ms (186 KiB) | ~7,300× faster | -99.97% RAM |
| Ranked event types | 56s (1 GiB) | 7ms (16 MiB) | ~8,000× faster | -98.4% RAM |
| Most reposted posts | 37s (45 GiB) | 3ms (45 KiB) | ~12,300× faster | -99.99% RAM |
Final takeaways for ClickHouse users #
✅ Incremental materialized views guarantee fast response times when pre-aggregated data remains independent of source table growth.
✅ Refreshable materialized views, often paired with incremental ones for efficiency, help when pre-aggregated data from incremental materialized views alone still depends on the source table’s growth. They balance performance and freshness by maintaining small and stable top-N query inputs.
✅ In-memory dictionaries enrich dashboards with real-time metadata lookups.
By keeping input tables small and independent of dataset growth, ClickHouse delivers real-time JSON analytics with sustained performance at any scale.