LLM observability has exploded in relevance over the past two years, with a growing ecosystem of tools emerging to help developers understand and optimize AI-driven applications. From LangChain's built-in ClickHouse integration to native OpenTelemetry support in popular AI toolkits, the demand for transparency into model behavior, usage, and cost has never been higher.
Given ClickHouse's reputation for high-performance LLM analytics and the launch of ClickStack, an open source observability stack on ClickHouse, we wanted to see how easily we can build LLM observability with ClickStack.
In this post, we'll walk through instrumenting LibreChat, an LLM chat interface which also integrates with MCP servers, using OpenTelemetry (OTel). Our goal: capture meaningful traces and metrics with minimal code changes and evaluate how far we can push observability for LLM-based applications using ClickStack.
Why does this matter? In production, LLMs often incur significant costs due to token consumption. Without proper visibility, teams risk flying blind - unable to assess usage patterns, performance bottlenecks, or cost-effectiveness. Observability isn't just a nice-to-have - it's essential for managing cost, improving UX, and proving ROI. Let's dive in.
What is LibreChat? #
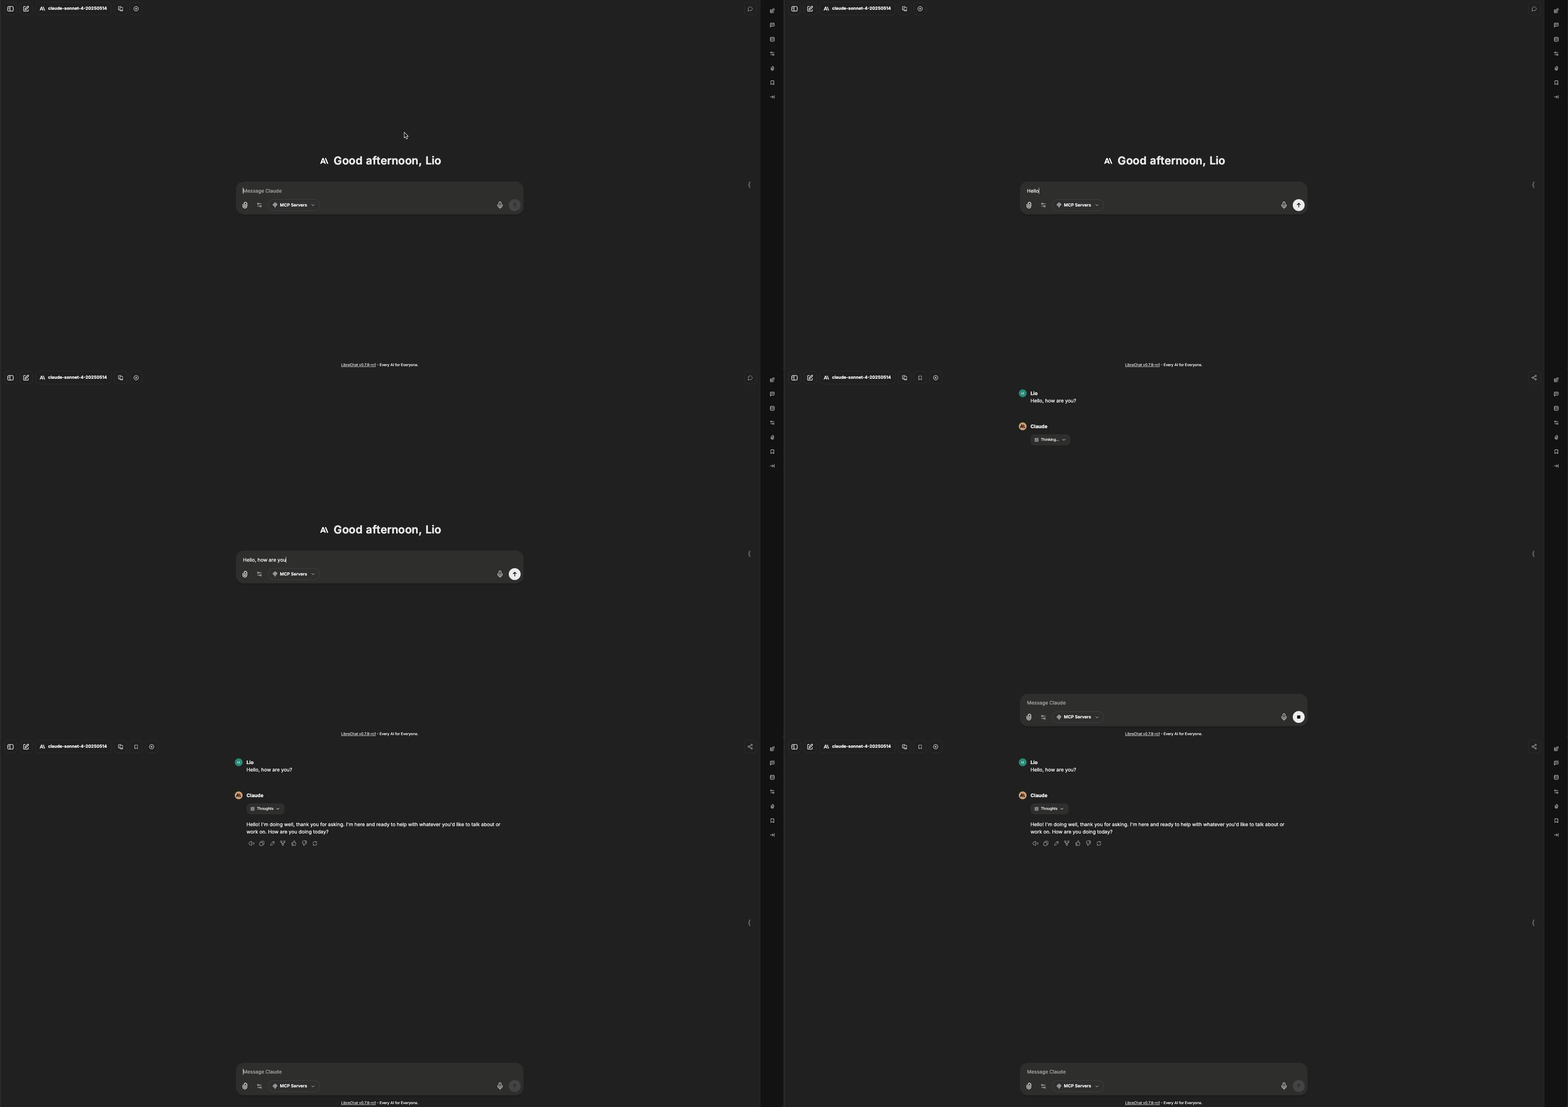
LibreChat is an AI chat platform that brings together models from providers like OpenAI, Anthropic, Google, and more into a single, unified interface. Designed as a powerful open-source alternative to ChatGPT or Claude Desktop, it supports extensive customization, plugin integrations, and multilingual access. With its familiar UI and modular architecture, LibreChat makes it easy to self-host, extend, and tailor your AI chat experience.
What is MCP? #
MCP (Model Context Protocol) is an emerging standard for connecting third-party services such as databases, APIs, and tools to language models. By implementing an MCP server, you define how your service can be used by clients powered by LLMs. On the other side, MCP clients- such as Claude Desktop, ChatGPT and LibreChat - enable these models to interact with your service in a structured way.
This protocol is rapidly becoming the default for LLM integrations, offering a lightweight, language-agnostic interface for service access. Earlier this year, we introduced the mcp-clickhouse server, allowing ClickHouse to be used seamlessly by any MCP client.
The value of MCP lies in what it unlocks. It allows LLMs to act not just as passive responders but as active interfaces for real-time systems. That means querying databases, triggering actions, and surfacing insights with the fluidity of natural conversation. In these agentic workflows, speed and interactivity are critical. ClickHouse excels in this space. Its low-latency analytical engine makes it well-suited for scenarios where a user expects a fast response - not hours later, but in the next few seconds of the conversation. MCP makes that connection possible.
In this example, we'll connect the ClickHouse MCP server to LibreChat, but the below instrumentation could be reproduced for any FastMCP implementation (the popular framework on which ClickHouse MCP is based). Our MCP server will in turn connect to our demo environment sql.clickhouse.com which has over 35 datasets it can use to answer user questions.
Deploying LibreChat #
LibreChat provides a docker compose file to get all the components up and running easily. In this section, we will see how we extended this docker compose file to instrument LibreChat and ClickHouse MCP Server. The full working example can be found on this Github repository.
Configuring LibreChat with ClickHouse MCP #
LibreChat supports MCP out of the box, this documentation describes how to integrate MCP servers using different examples. In this example, we're going to deploy ClickHouse MCP Server as a separate service and LibreChat will connect to it using the SSE protocol.
The ClickHouse MCP Server is available as an official Docker image, which makes it easy to run separately in our deployment.
The below section shows the Docker Compose configuration used to deploy the ClickHouse MCP server as a standalone service. This can be added to the out of the box compose file.
1mcp-clickhouse:
2    image: mcp/clickhouse
3    container_name: mcp-clickhouse
4    ports:
5      - 8001:8000
6    extra_hosts:
7      - "host.docker.internal:host-gateway"
8    environment:
9      - CLICKHOUSE_HOST=sql-clickhouse.clickhouse.com
10      - CLICKHOUSE_USER=demo
11      - CLICKHOUSE_PASSWORD=
12      - CLICKHOUSE_MCP_SERVER_TRANSPORT=sse
13      - CLICKHOUSE_MCP_BIND_HOST=0.0.0.0
In the LibreChat configuration file, librechat.yml, the MCP client is set up to connect to the MCP server using SSE.
1mcpServers:
2  clickhouse-playground:
3    type: sse
4    url: http://host.docker.internal:8001/sse
Deploying ClickStack #
The central element of our LLM observability solution is ClickStack, the ClickHouse observability stack. It is composed of three components: HyperDX UI, OpenTelemetry collector, and ClickHouse (which can be deployed and configured separately.) For this demo, we're using the simplest way to get started with ClickStack, the all-in-one deployment option using docker compose.
Run the following command to get ClickStack up and running locally.
docker run -p 8080:8080 -p 4317:4317 -p 4318:4318 -p 9000:9000 docker.hyperdx.io/hyperdx/hyperdx-all-in-one
Once started, you can access HyperDX UI at http://localhost:8080. You will need to register the first time you access it.
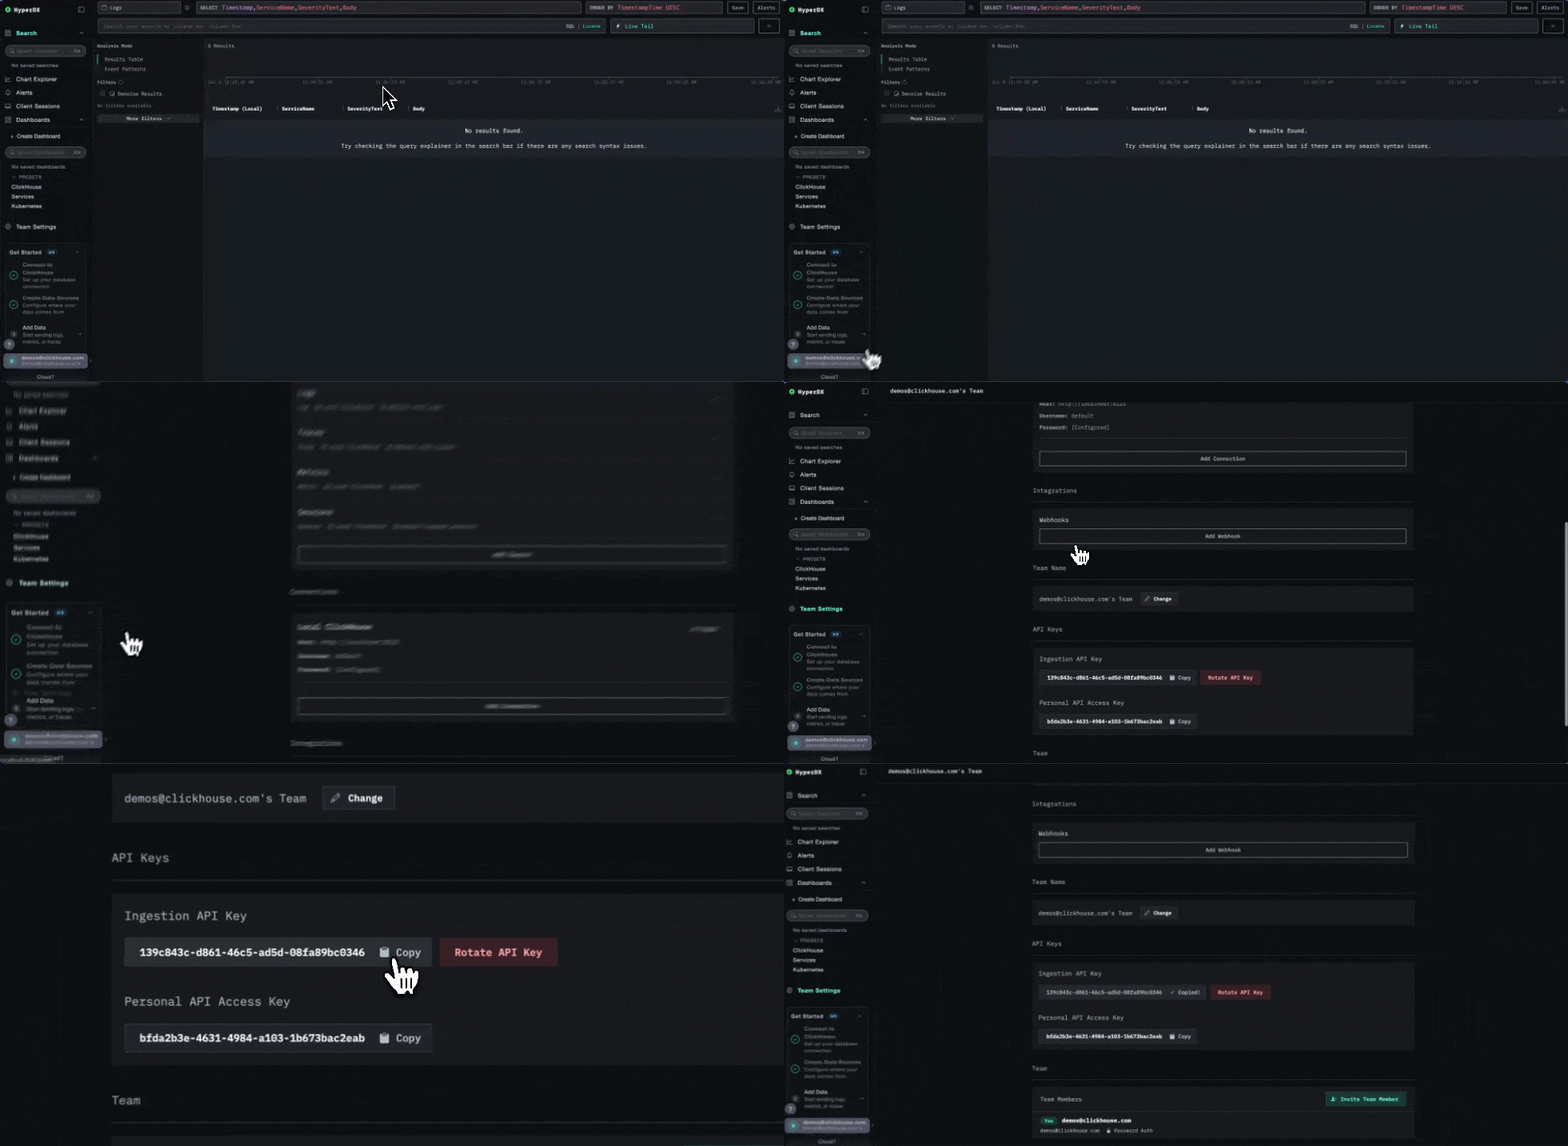
The OpenTelemetry collector deployed as part of ClickStack exposes, by default, the OTLP ports which require a secure ingestion API key. The API key is generated at startup and can be retrieved from the HyperDX UI in the Team Settings menu. We'll refer to this API key as CLICKSTACK_API_KEY in the rest of this document.
Instrumenting LibreChat (Node.js) #
LibreChat is a Node.js application that uses React for its frontend. ClickStack provides a simple way to instrument Node.js applications with minimum code modification.
To include the extra Node.js dependencies, we can extend the LibreChat Docker image.
# Use the existing image as base
FROM ghcr.io/danny-avila/librechat-dev:latest

# Optional: switch to root if needed to install globally
USER root

RUN apk add --no-cache git build-base python3-dev

# Install OpenTelemetry CLI
RUN npm install @hyperdx/node-opentelemetry

# Switch back to the node user if needed
USER node
EXPOSE 3080

# Replace CMD with OpenTelemetry-instrumented version
# Redirect stdout and stderr to a file
CMD sh -c "NODE_ENV=production \
  HDX_NODE_ADVANCED_NETWORK_CAPTURE=true \
  OTEL_EXPORTER_OTLP_ENDPOINT=$OTEL_EXPORTER_OTLP_ENDPOINT \
  HYPERDX_API_KEY=$CLICKSTACK_API_KEY \
  OTEL_SERVICE_NAME=librechat-api \
  npx opentelemetry-instrument api/server/index.js \
  >> /app/api/logs/console.log 2>&1"
Running the process with opentelemetry-instrument enables the instrumentation of the Node.js process and sends the application traces to ClickStack. Note that we pass the CLICKSTACK_API_KEY as environment variables to authenticate with the OpenTelemetry collector deployed with ClickStack.
The application logs are written to a local file console.log which gets collected by an OTel collector, see Collecting logs section.
Note that we direct our logs to
console.log. While LibreChat provides built-in logging, it doesn't support structured JSON output, which simplifies processing by the OTel collector. To address this, we redirect logs to console.log and set the log level to debug with structured logging via the environment variablesCONSOLE_JSON=trueandDEBUG_CONSOLE=true.
Instrumenting MCP (Python) #
The ClickHouse MCP Server is built with Python, so we can use OpenTelemetry's Python auto-instrumentation method to get started quickly.
Here is how the Docker image file extends the official ClickHouse MCP Docker image.
1FROM mcp/clickhouse
2
3RUN python3 -m pip install --no-cache-dir --break-system-packages \
4   opentelemetry-distro
5RUN python3 -m pip install --no-cache-dir --break-system-packages \
6   opentelemetry-exporter-otlp
7
8RUN opentelemetry-bootstrap -a install
9# Fix issue with urllib3 and OpenTelemetry
10RUN python3 -m pip uninstall -y pip_system_certs
11
12RUN mkdir -p /app/logs
13
14# Redirect stdout and stderr to a file
15CMD sh -c "OTEL_EXPORTER_OTLP_HEADERS='authorization=,[object Object],' opentelemetry-instrument python3 -m mcp_clickhouse.main >> /app/logs/mcp.log 2>&1"
At the time this blog was written, there was an issue with the Python instrumentation provided by ClickStack. However, the integration can still be done using standard OpenTelemetry instrumentation. The key requirement is to ensure the authentication API key is included in the headers via OTEL_EXPORTER_OTLP_HEADERS='authorization=$CLICKSTACK_API_KEY'.
Similar to LibreChat, the application logs are written to a local file and collected using a OTel collector, see Collecting logs section.
Collecting logs and metrics #
With our applications now writing logs to local files, we deploy a separate OTel collector in its own Docker container. A shared volume is mounted to both the application containers and this collector container, allowing the collector to access the log files using the filelog receiver.
This collector is separate from the one included with ClickStack. We connect it to the ClickStack collector using an OTLP connection.
LibreChat also exposes metrics on port 8000. Using Prometheus receivers, we collect those metrics and forward them to ClickStack.
Here's the full configuration of our OTel collector:
1receivers:
2  filelog:
3    include:
4      - /var/log/librechat/console.log
5      - /var/log/librechat/mcp-clickhouse/mcp.log
6    start_at: beginning
7    operators:
8      - type: json_parser
9        id: parse_json_log
10        on_error: send_quiet
11        timestamp:
12          parse_from: attributes.timestamp
13          layout_type: gotime
14          layout: '2006-01-02T15:04:05.000Z'
15        severity:
16          parse_from: attributes.level
17
18      - type: trace_parser
19        trace_id:
20          parse_from: attributes.trace_id
21        span_id:
22          parse_from: attributes.span_id
23
24      - type: move
25        id: promote_message
26        from: attributes.message
27        to: body
28        if: 'attributes.message != nil'
29      - type: regex_parser
30        id: extract_conversation_id
31        # look in the body line for conversationId
32        parse_from: body
33        regex: "conversationId: (?P[0-9a-fA-F-]+)"
34        on_error: send_quiet
35
36  prometheus:
37    config:
38      scrape_configs:
39        - job_name: 'librechat_metrics'
40          scrape_interval: 15s
41          static_configs:
42            - targets: ['host.docker.internal:8000']
43
44processors:
45  transform:
46    error_mode: ignore
47    log_statements:
48    - set(resource.attributes["service.name"], "librechat-api") where log.attributes["log.file.name"] == "console.log"
49    - set(resource.attributes["service.name"], "mcp-clickhouse") where log.attributes["log.file.name"] == "mcp.log"
50  resource:
51    attributes:
52      - key: service.name
53        value: librechat-api
54        action: upsert
55
56exporters:
57  otlp:
58    endpoint: http://host.docker.internal:4317
59    headers:
60      authorization: ${CLICKSTACK_API_KEY}
61    tls:
62      insecure: true
63
64service:
65  pipelines:
66    logs:
67      receivers: [filelog]
68      processors: [resource, transform]
69      exporters: [otlp]
70    metrics:
71      receivers: [prometheus]
72      processors: [resource]
73      exporters: [otlp]
Putting it all together #
Now we have customized the LibreChat and ClickHouse MCP Server Docker image and have a solution to collect the logs using a separate OTel collector service. Our final collection architecture:
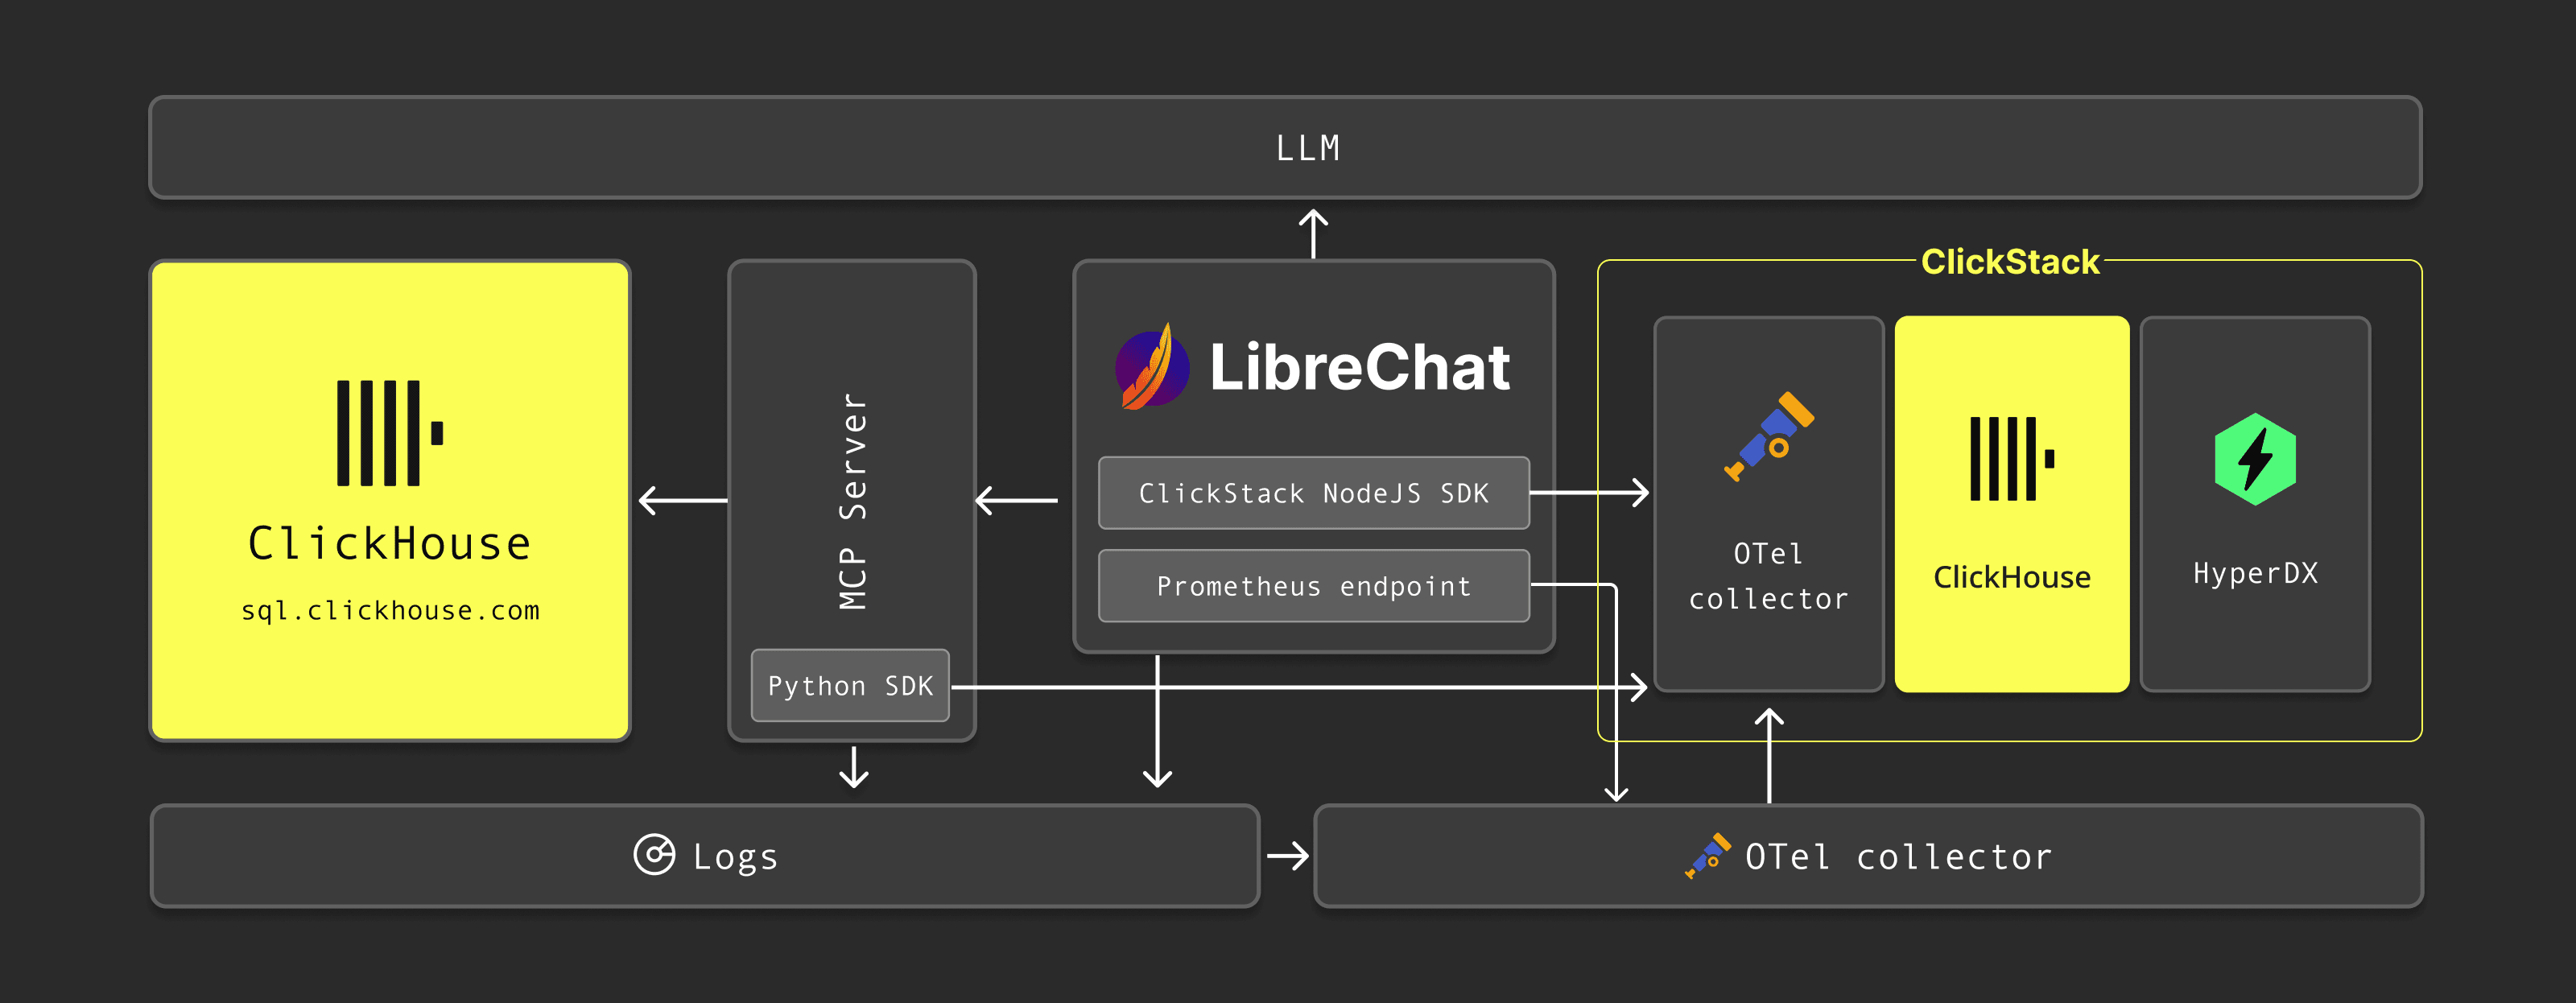
We can put it all together by extending the existing LibreChat docker compose file. The complete docker compose file with instrumentation can be found here.
To start the application, simply run docker compose up.
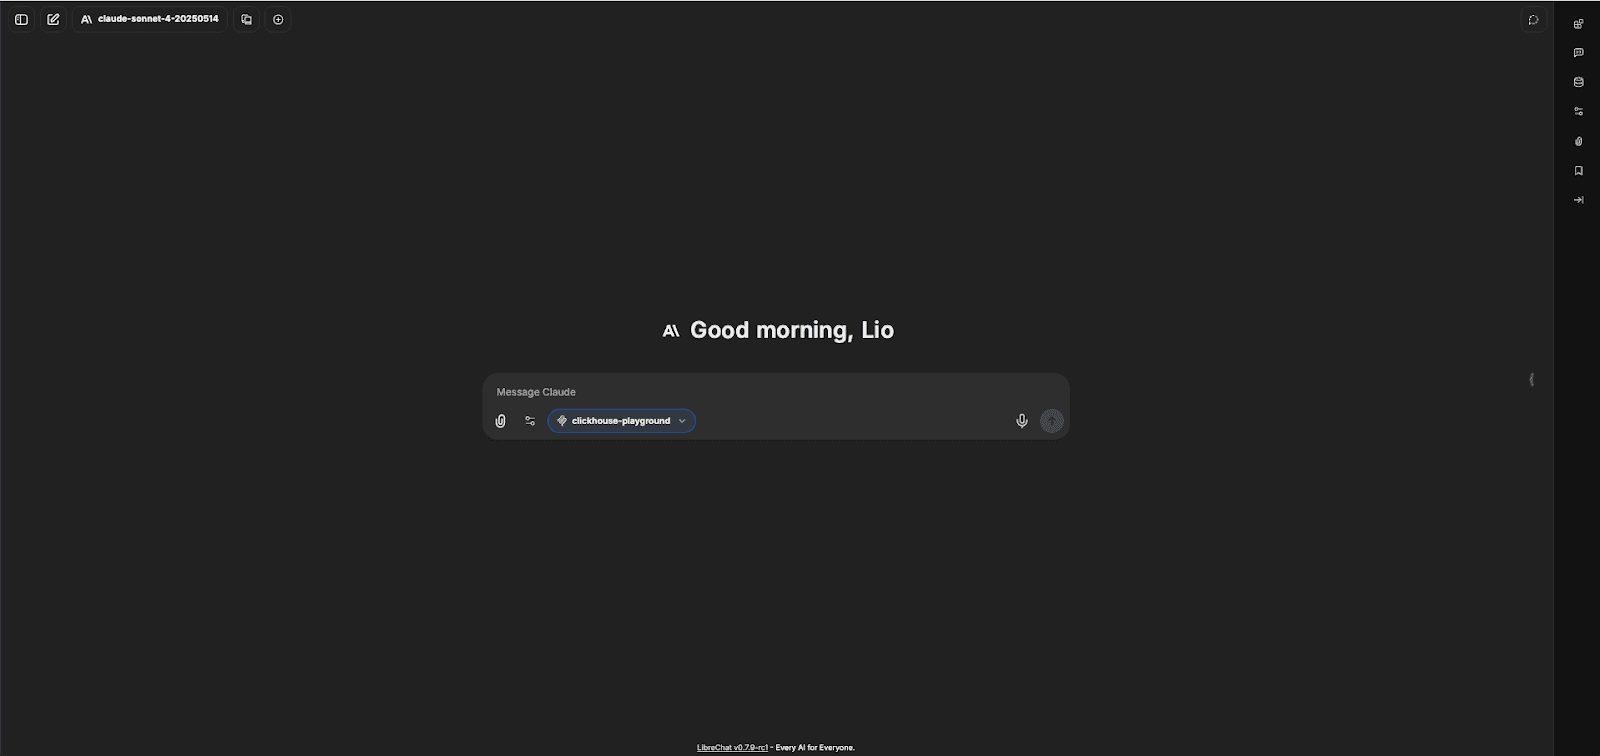
Once LibreChat is running, it can be accessed at http://localhost:3080. The first time you open it, you will need to create an account. To confirm that everything is working as expected, select the LLM model associated with the API key you provided, then choose the ClickHouse MCP Server from the options below the chat bar.
Below is a screenshot showing LibreChat properly configured and ready to handle prompts using the MCP server. Note our MCP server listed below the input box.
Exploring the data #
With the application running and instrumented, we can begin examining the observability data to gain better insight into the interactions between LibreChat, the LLM, and the MCP Server. A key focus is understanding how often the LLM model communicates with the MCP server and how many tokens are being used in those interactions.
Some LLM interaction statistics, like the number of conversations or tokens used, are already collected and stored in the MongoDB instance included in the default LibreChat stack (we could actually read this data from ClickHouse using the MongoDB table function). While this may be sufficient for monitoring LibreChat, the approach using ClickStack to observe the LLM application is more flexible and allows us to do analytics at scale. It can be applied to any LLM application, whether or not it integrates with MCP tools.
Simple prompt #
To confirm that the MCP server is functioning properly and that the LLM can interact with it, we can begin with a simple prompt.
Use the following prompt to get an overview of the databases available in the ClickHouse playground:
"What databases do you have access to?"
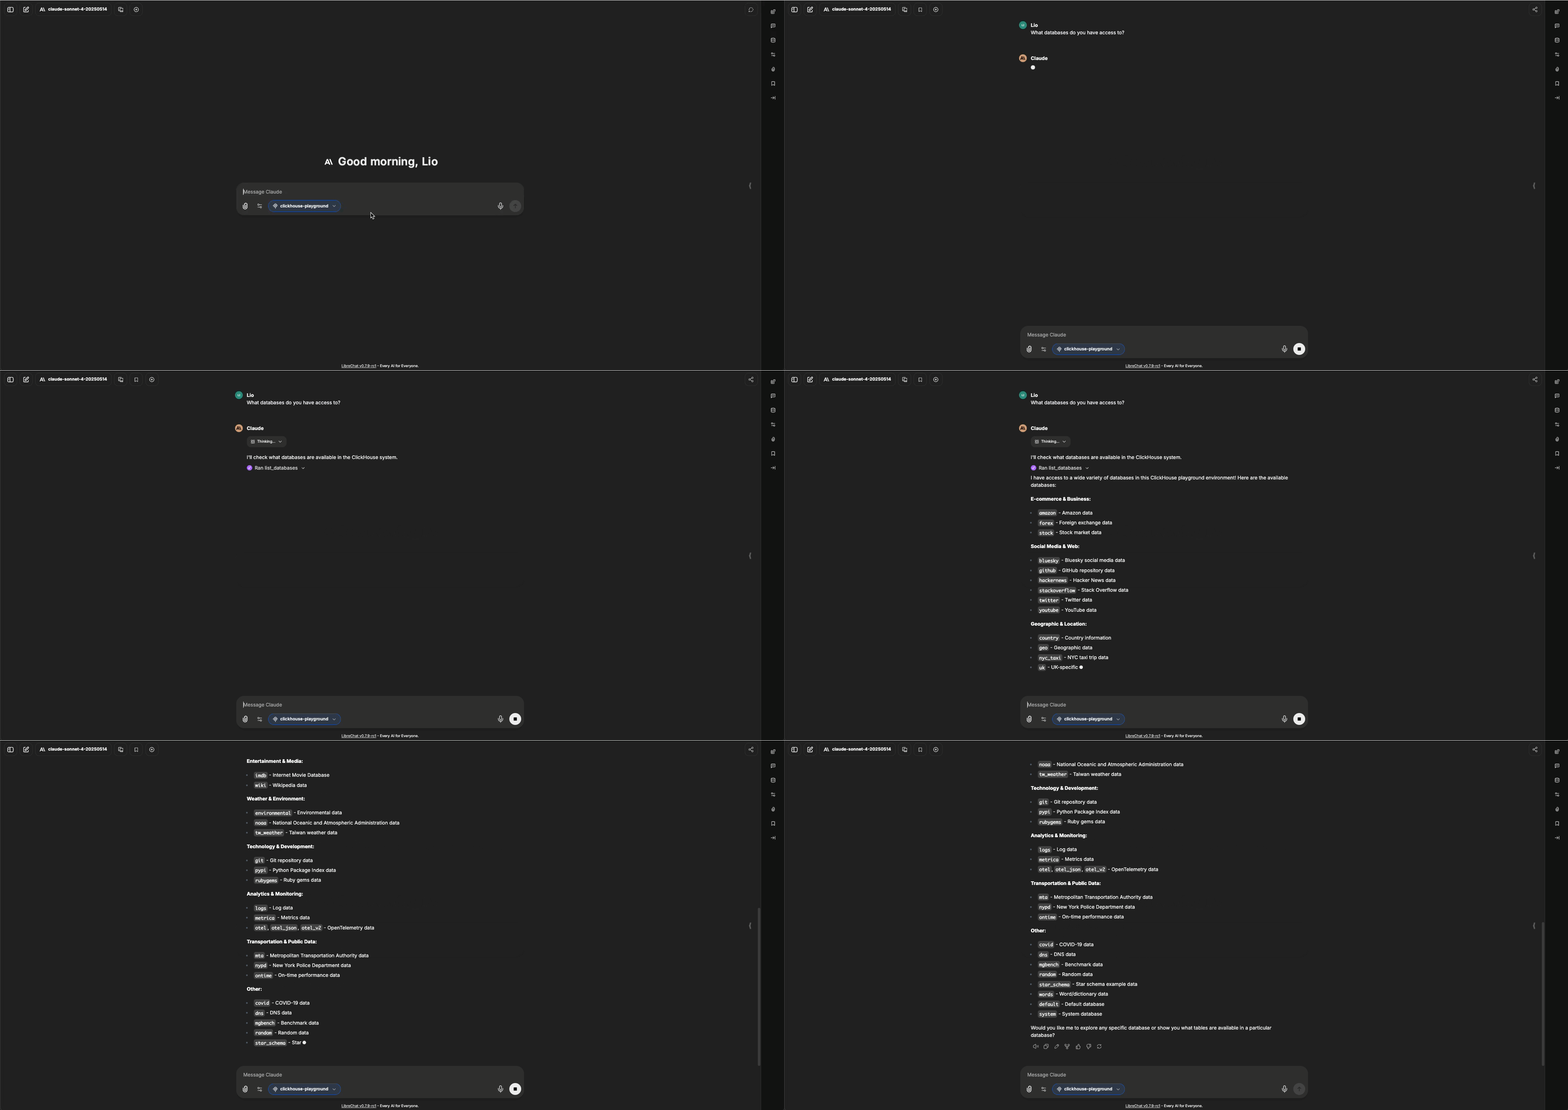
In the LibreChat interface, we can observe that the MCP tool has made only a single request to retrieve the list of databases.
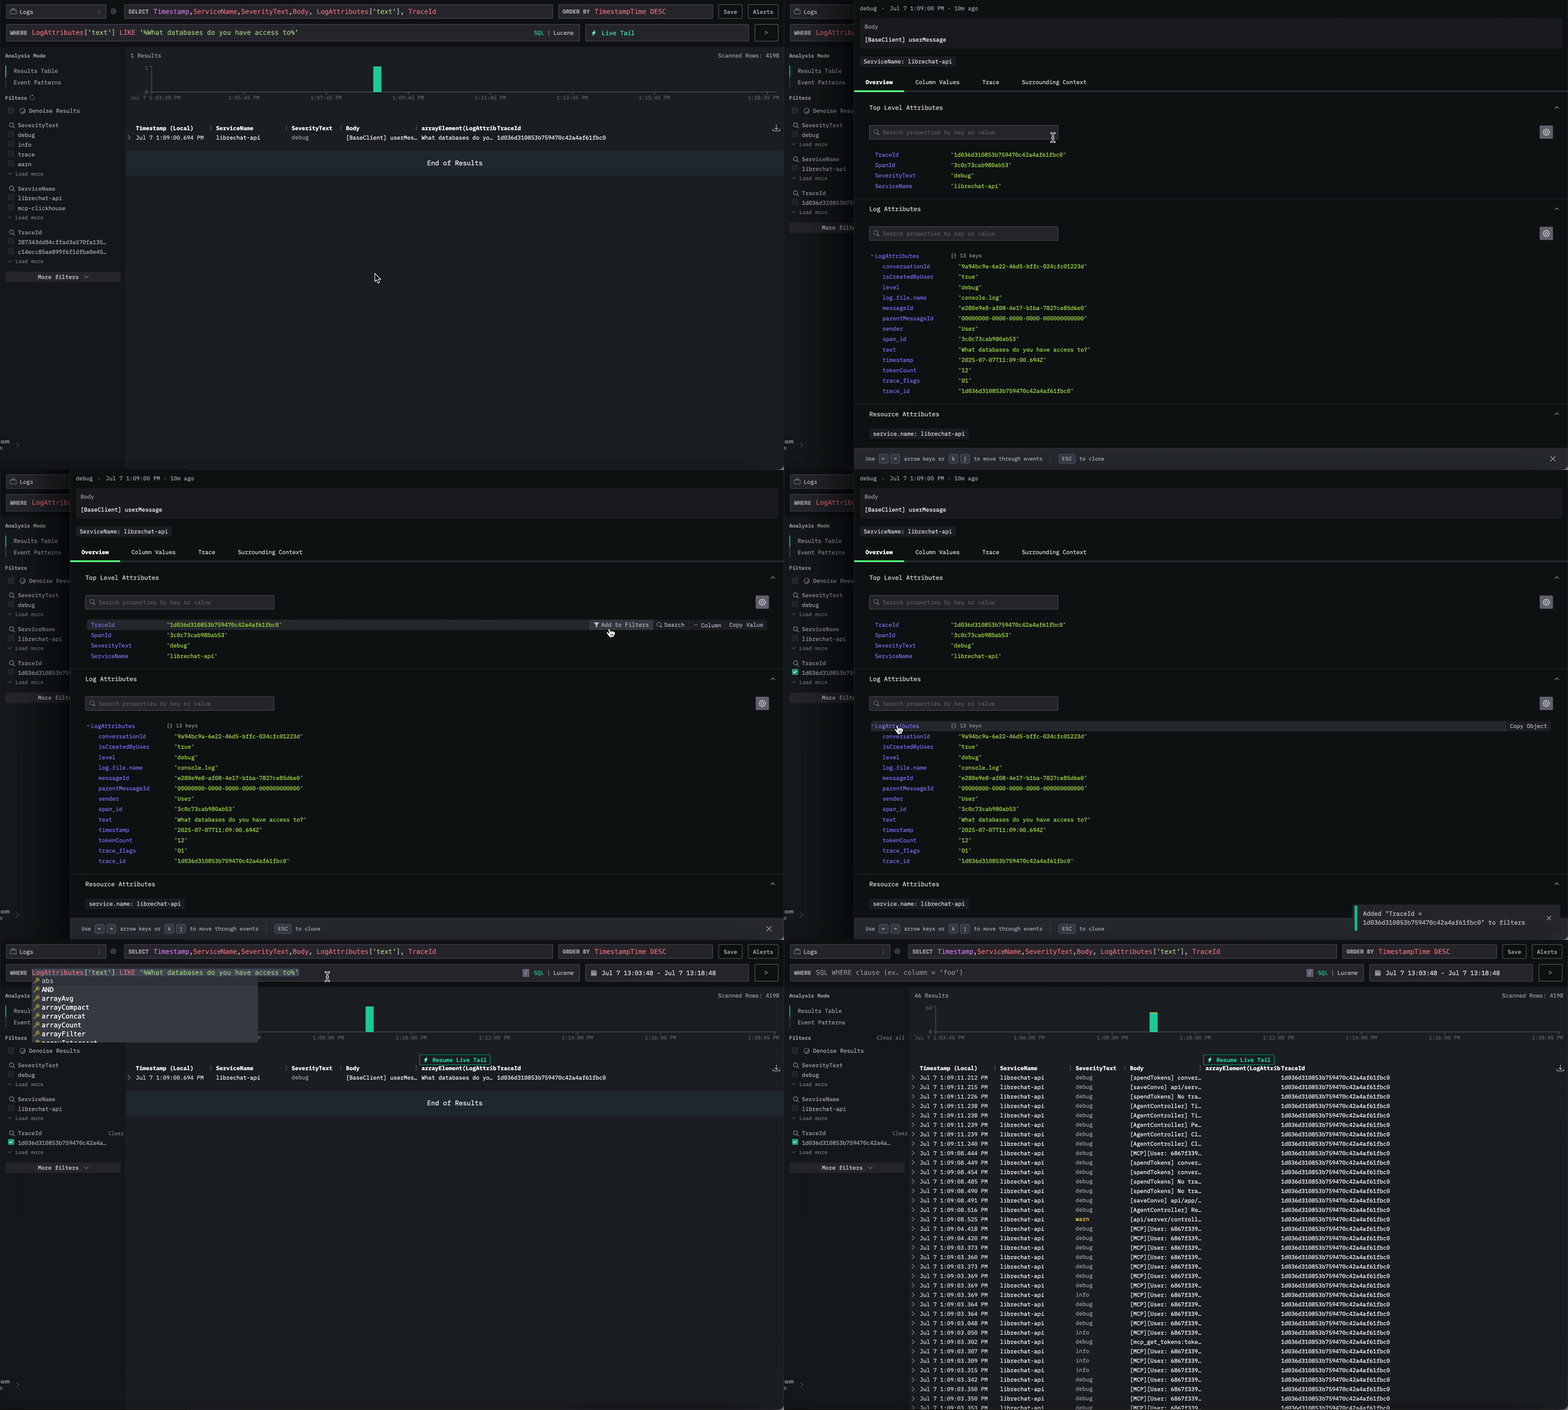
Let’s access the HyperDX UI to explore the data captured. By default, the Logs data source display logs from LibreChat (librechat-api) and the ClickHouse MCP Server (mcp-clickhouse):

To find the start of the interaction, we’ll use the prompt text as a filter. The prompt text is automatically recorded in the logs as a log attribute named text.
We can apply a filter using SQL syntax: LogAttributes['text'] LIKE '%What databases do you have access to%'
We also add two columns in the results table, the LogAttribute['text'] to display the prompt and the TraceId that will be used to isolate the full interaction. Note that trace is generated for each interaction with the LLM i.e. when the user enters a prompt. This is assigned a unique TraceId value.

Next, let’s filter by the TraceId. Click on a log entry, then select Add to Filter next to the TraceId field.
While collecting logs from LibreChat, we also captured additional metadata. Let’s show this data by adding it to the results table.
Timestamp,ServiceName,LogAttributes['conversationId'] AS cId, TraceId AS tId,LogAttributes['completionTokens'] as ct, LogAttributes['tokenCount'] as tc, LogAttributes['promptTokens'] as pt,LogAttributes['text'] as prompt, Body
Several attributes are especially relevant to our use case. Below is a brief overview of each. Note that the tokens attribute is based on assumptions, as we couldn’t find reliable documentation for each attribute.
- conversationId: The id of the LibreChat conversation. Each time a new conversation is initiated in LibreChat a new id is generated for it.
- TraceId: Every time a user initiates a new interaction, within a conversation, a new Trace is generated.
- completionTokens: This is the number of tokens produced by the LLM as a response
- promptTokens: This is the number of tokens produced by the LLM as a prompt input
- tokenCount: In this context, it’s the number of tokens sent as user prompt
- text: The actual prompt text sent by the user.
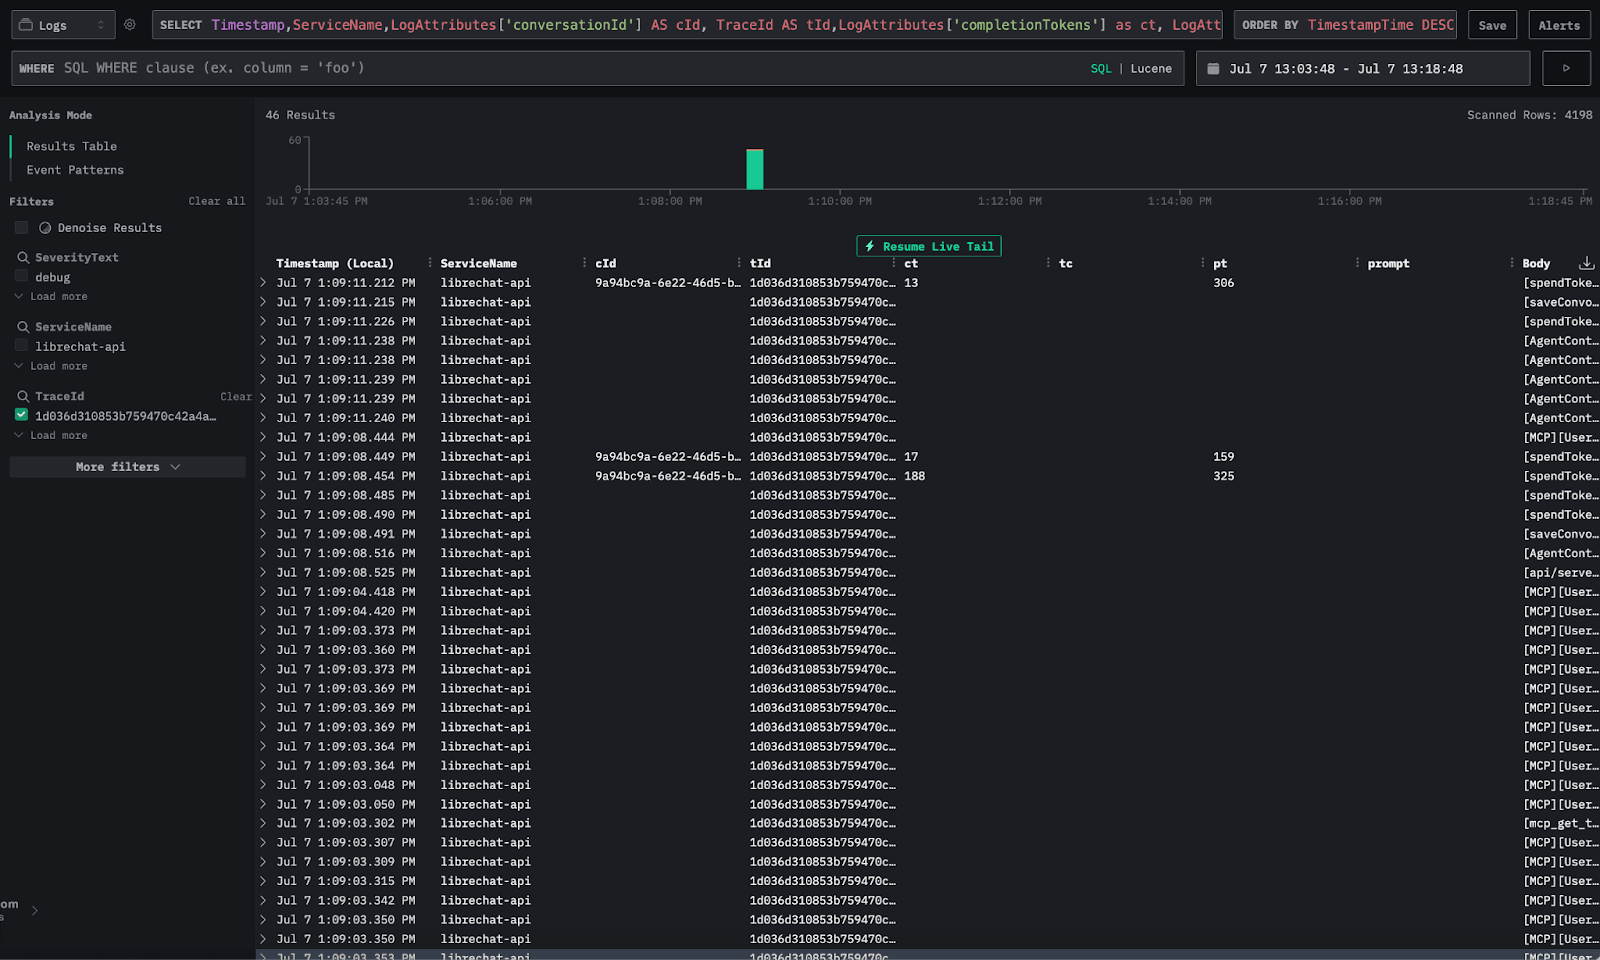
After filtering the logs by TraceId, we now see the full interaction. However, only a few entries involve the LLM. These are the ones where completionTokens or promptTokens are present.
Validate the data #
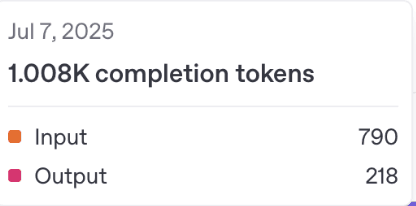
To check if the token counts are accurate, we’ll start by running a SQL query to sum the completionTokens and promptTokens for the conversation. Then, we’ll compare that total with the token usage shown in the OpenAI dashboard. We created a new API key specifically for this comparison.
Below is a screenshot from the OpenAI usage dashboard. For that specific API Key, we have 1008 tokens used, 790 as input tokens and 218 as output tokens.
Now let's compare this with the counts from ClickStack. ClickHouse's full SQL support enables much deeper analysis than you'd typically get with an observability tool. You can run SQL queries directly on the ClickHouse backend to compute precise counts and perform rich analyses - the benefit of storing everything as wide events!
Since we exposed port 9000 from the ClickStack Docker image, we should be able to connect directly to the ClickHouse instance using the clickhouse-client.
Let's run the SQL query to summarize the number of completion and prompt tokens for the conversation with id 9a94bc9a-6e22-46d5-bffc-024cfc01223d:
1SELECT
2    LogAttributes['conversationId'] AS conversationId,
3    LogAttributes['trace_id'] AS trace_id,
4    sum(toUInt32OrZero(LogAttributes['completionTokens'])) AS completionTokens,
5    sum(toUInt32OrZero(LogAttributes['tokenCount'])) AS tokenCount,
6    sum(toUInt32OrZero(LogAttributes['promptTokens'])) AS promptTokens,
7    anyIf(LogAttributes['text'], (LogAttributes['text']) != '') AS prompt
8FROM otel_logs
9WHERE conversationId = '9a94bc9a-6e22-46d5-bffc-024cfc01223d'
10GROUP BY
11    conversationId,
12    trace_id
The SQL query returns:
| conversationId | trace_id | completionTokens | tokenCount | promptTokens | prompt |
|---|---|---|---|---|---|
| 9a94bc9a-6e22-46d5-bffc-024cfc01223d | 1d036d310853b759470c42a4af61fbc0 | 218 | 12 | 790 | What databases do you have access to? |
The total completionTokens is 218, matching the output token count reported by OpenAI. The promptTokens total is 790, which aligns with the reported input tokens.
This gives us a reasonable level of confidence that the token counts tracked through ClickStack are accurate.
Track a more complex prompt #
We validated the approach using a simple prompt, let’s now use one that is closer to what a user could ask for.
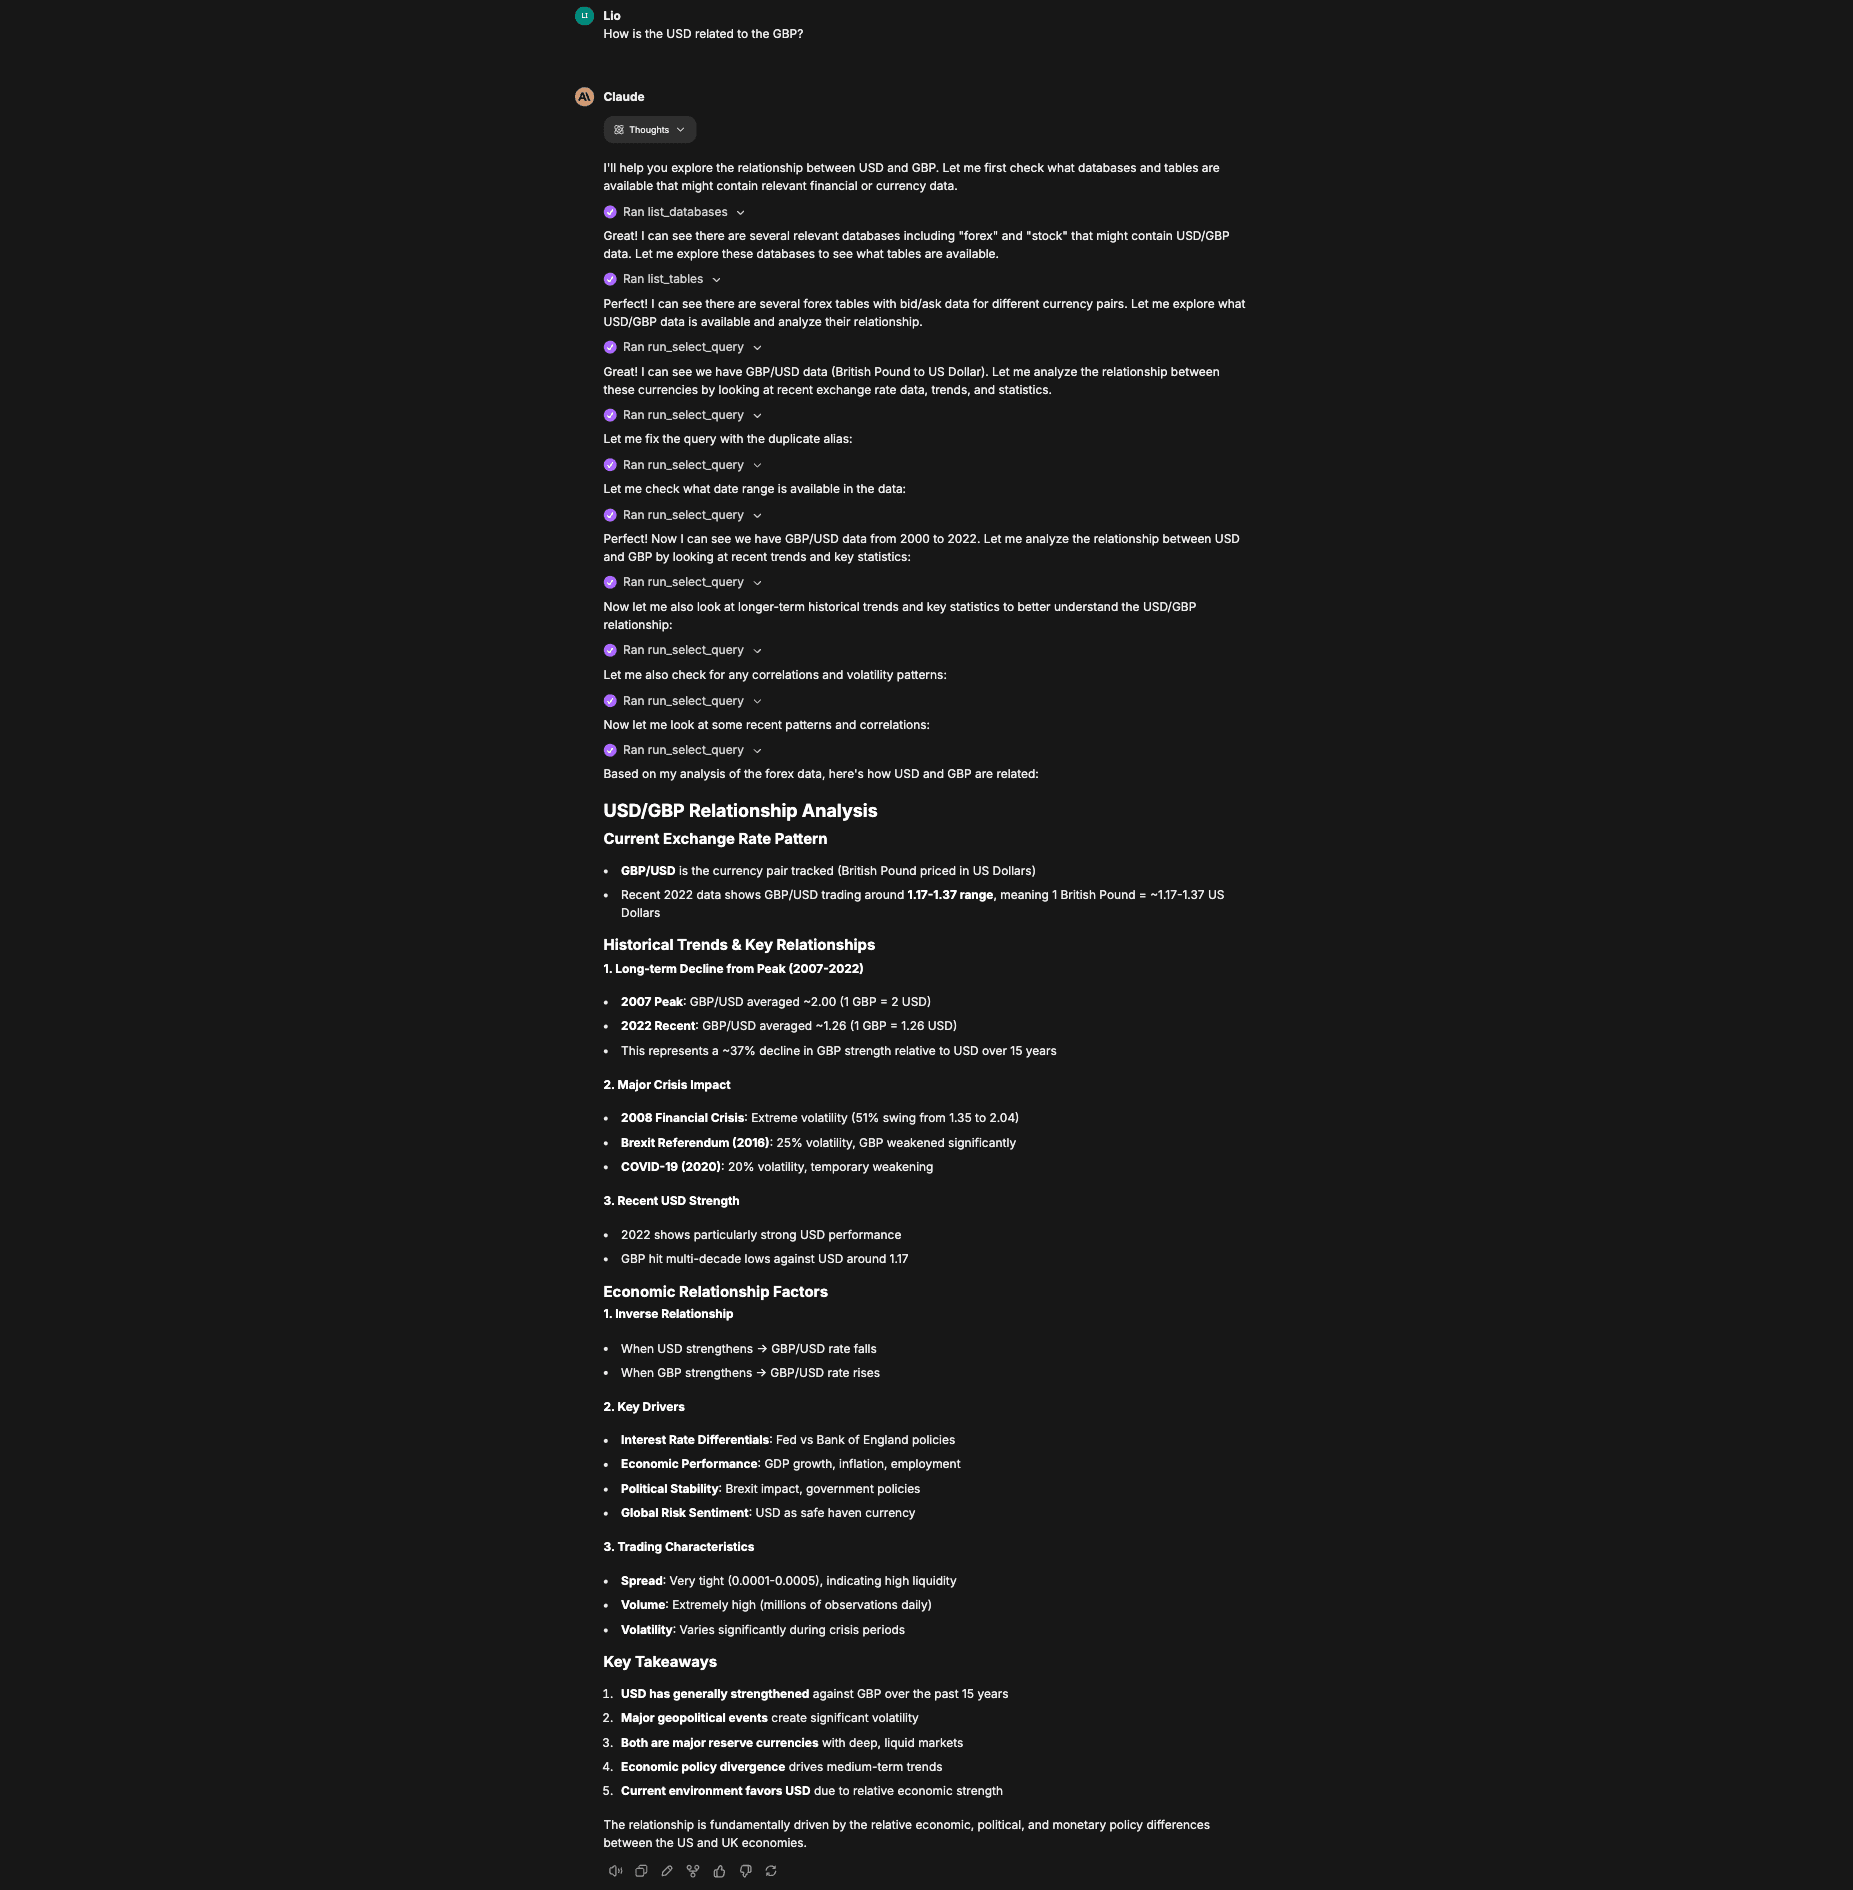
For the next experiment, we’ll ask the following prompt: "How is the USD related to the GBP?"
This time, the model needs extensive back and forth with the MCP server - first to explore the data and see if it can help answer the question, then to run multiple SQL queries to gather the details needed for a solid response.
Below is a screenshot of the full response to the question in LibreChat, we can see the number of times the MCP tool was called to query data from ClickHouse.
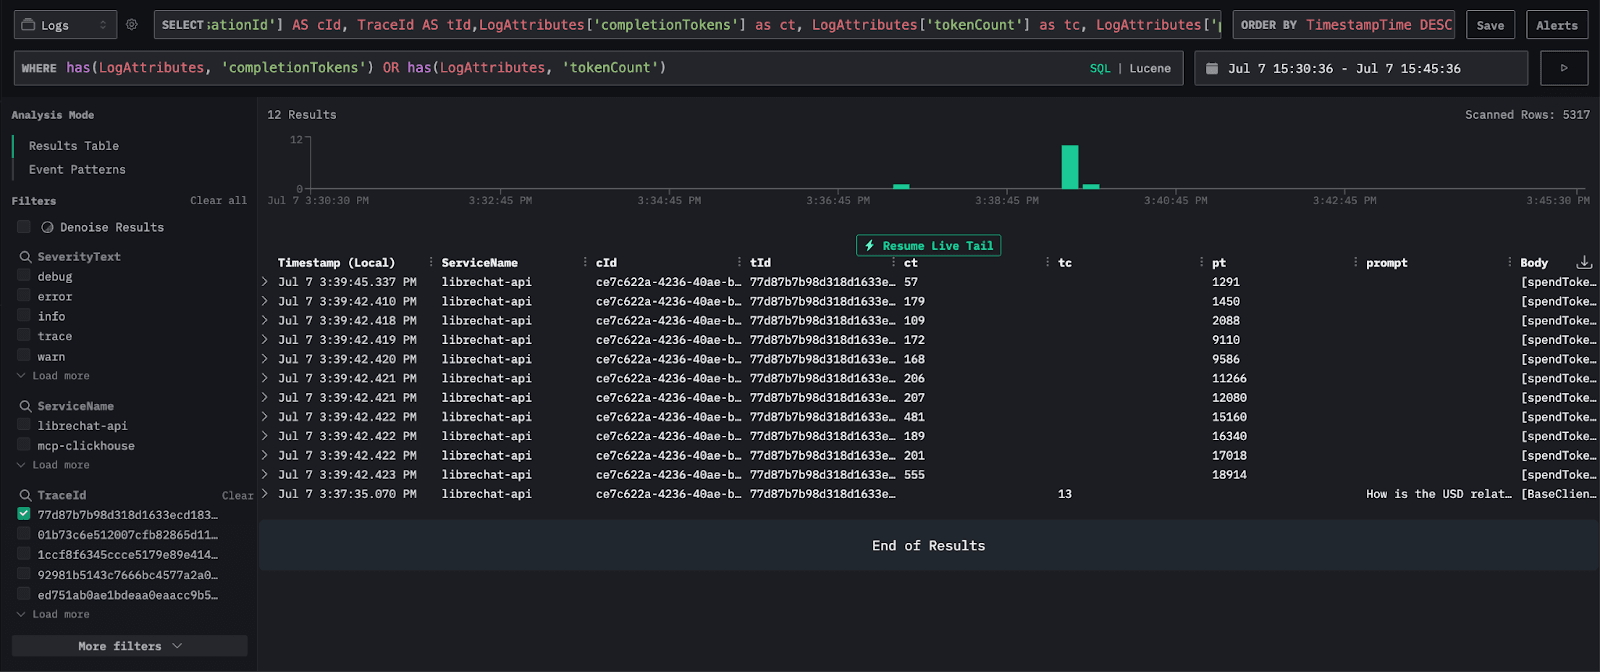
Back in the HyperDX UI, let's have a look at the logs generated by the user question. The number of logs can be a bit overwhelming, let's filter down to only the logs with tokens generated by requiring the fields completionTokens or tokenCount to exist in the log attributes.
has(LogAttributes, 'completionTokens') OR has(LogAttributes, 'tokenCount')
Now we can track only the LLM interaction and the number of tokens passed as input and the number of tokens returned.
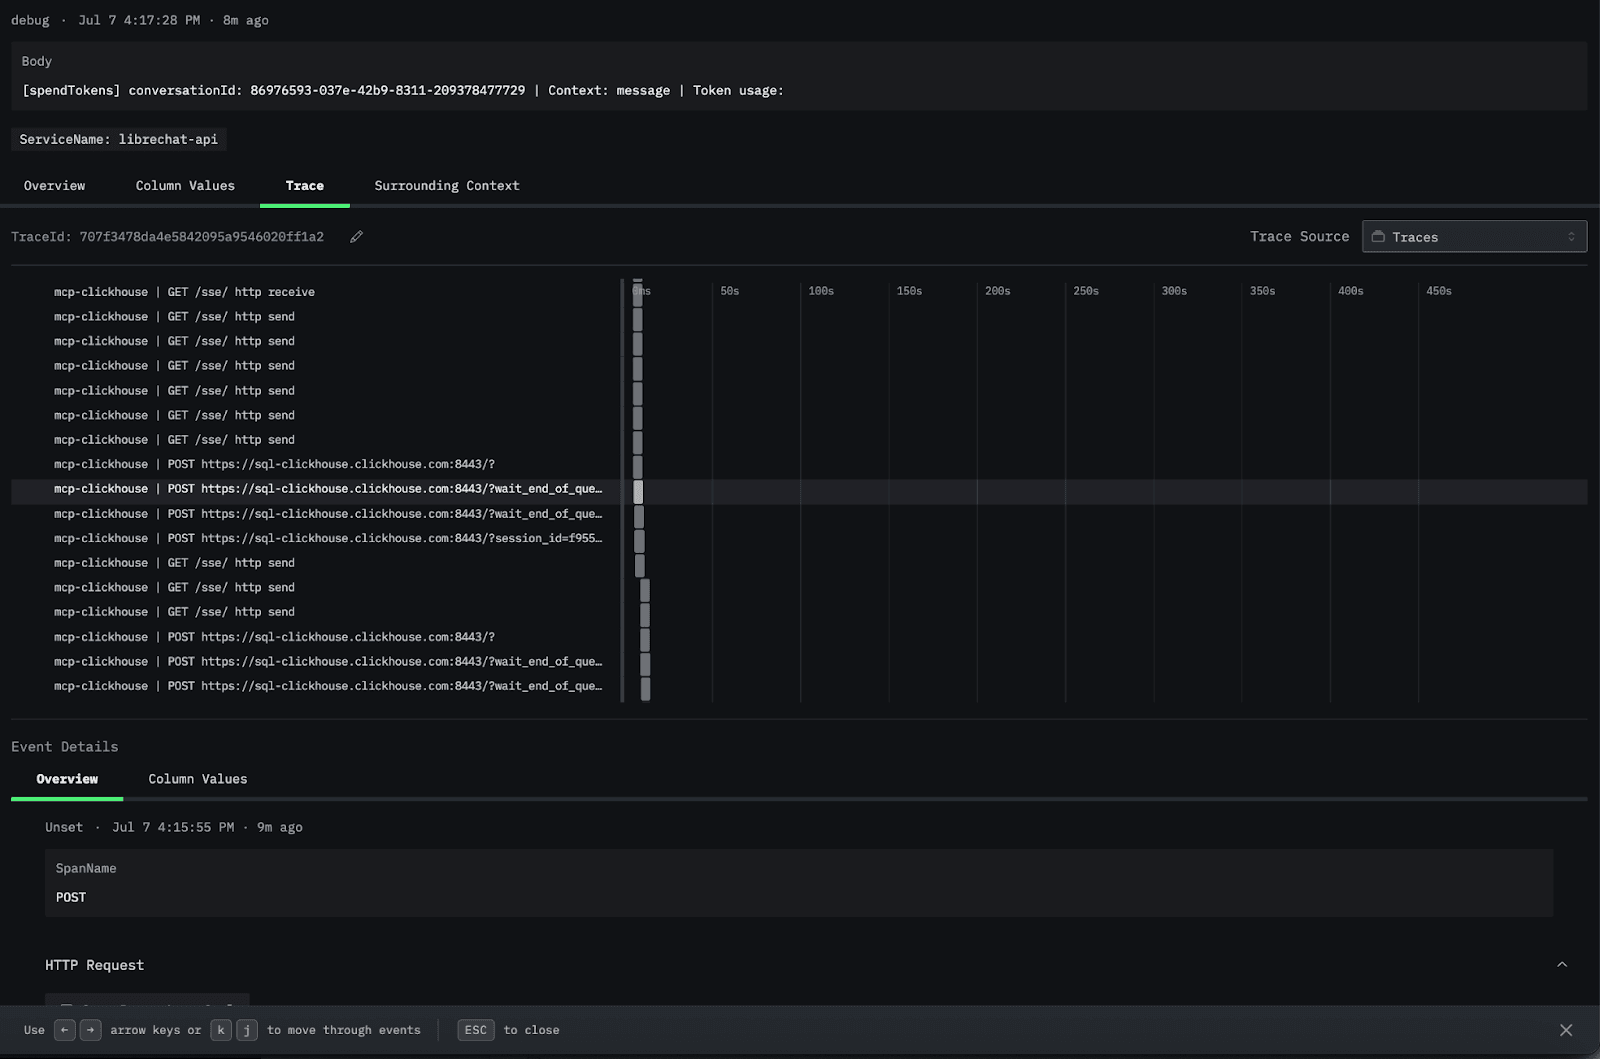
We can also explore the trace to understand the interaction between the components. Let’s click on one of the log entries and navigate to the Trace tab. Scrolling down to the mcp-clickhouse trace, you can see the call to ClickHouse.
Finally, let's look at the metrics exposed to ClickStack. These are provided through a Prometheus exporter and collected by our OTel collector. There's a wide range of available metrics, you can view the full list here.
For example, the metric librechat_messages_total tracks the total number of messages exchanged on LibreChat, which you can display on a chart.

Conclusion #
LLM observability is essential in production, especially for agentic applications and those using MCP tooling, which interact with LLMs more heavily than typical chat interfaces. Monitoring performance, usage, and cost helps ensure reliability and efficiency at scale. ClickStack allows you to define thresholds and automatically alert on high usage or unexpected spikes, so teams can respond quickly before costs or latency become a problem.
In this post, we showed how to achieve that using ClickStack with minimal configuration. The setup is easy to reproduce and works well in real-world environments. Since it's built on ClickHouse, it can scale to handle large volumes of logs, traces and metrics without performance issues.
Beyond monitoring, teams can also use this data and HyperDX to alert on key properties - such as flagging unusually expensive interactions, high volumes of requests, or when prepaid token thresholds are at risk of being exceeded.
To help teams get started, we've shared a complete working example on GitHub. It provides a solid foundation for adding observability to complex LLM workflows without unnecessary complexity.


