Modal uses ClickHouse Cloud to power real-time observability dashboards for AI workloads running across thousands of GPUs and containers. After running into scaling issues with writes and reads, the team migrated to ClickHouse Cloud for better performance and scalability. Today, a single ClickHouse table ingests 1-2 million events per minute, stores ~500 billion logs, and still delivers sub-second queries.
Summary
When you run AI workloads at scale, it’s important to know two things: what’s happening under the hood, and whether something’s about to go wrong.
Modal is an infrastructure platform that lets AI and ML teams run large-scale GPU workloads for training, batch processing, and low-latency inference in production. Developers can deploy workloads with just a few lines of Python, while Modal handles all the heavy lifting.
That kind of abstraction makes Modal feel fast and seamless to users, but it also creates complexity behind the curtain. Every time a function runs, Modal needs to capture what happened, when it happened, how long it took, and whether it succeeded. That means ingesting millions of events per minute and turning them into something actionable, all in real time.
At our recent Open House Roadshow in New York City, Modal engineer Ro Arepally shared how a single ClickHouse table powers hundreds of billions of logs and multiple real-time dashboards—and what the team is doing next to make it even faster.
AI infrastructure that developers love #
At a high level, Modal provides the infrastructure teams need to run large-scale AI workloads like inference, training, batch processing, and sandboxes. The platform offers primitives like queues, volumes, and dictionaries, and runs on a custom container runtime built for low-latency execution across thousands of CPUs and GPUs. Everything is accessible through a Python SDK that makes launching and scaling workloads feel like running code locally.
At Open House, Ro shared an example using OpenAI’s Whisper model for speech-to-text. A user defines a function, specifies the GPU (in this case, an NVIDIA L40), sets up the image with the necessary libraries, and runs it with modal run. Within seconds, the container spins up, processes the audio, and outputs a transcription (MLK’s “I Have a Dream” speech).
Behind the scenes, Modal orchestrates containers and compute across multiple clouds. But from the developer’s perspective, it’s just Python. That seamless abstraction is a big reason why teams at Scale, Meta, Mistral AI, Harvey, Ramp, Lovable, Quora, Substack, Cartesia, and elsewhere choose Modal to power their AI workloads.
Why Modal chose ClickHouse #
But making infrastructure disappear is only half the job. As Ro puts it, “Modal makes it super easy to run your code in the cloud—but once it’s running, a lot of our users care about how that code is doing. Are there issues? Are there things we need to debug?”
“As a company, we care a lot about observability for our customers,” he adds. “That requires us to build out integrated logging and full visibility into every function, container, and workload.”
One of the first observability features they built was a real-time logs view so users could inspect the output of their functions as they ran. But as more users came online and workloads grew, the system started to break down. “We started running into scaling issues with writes and reads,” Ro says. “So we sat down and said, okay, what do we do now?”
They considered building something custom. But around the same time, ClickHouse Cloud launched. “We heard really good things,” Ro says. “We decided to give it a go.”
The early returns were promising. “It turns out ClickHouse is super fast—we were all very impressed,” he says. At Open House, he shared an example from their production logs table: scanning over 100 million rows to find lines containing the string error. “We can do that in less than four seconds,” he explains.
That kind of speed opened the door to new features like instant search, a frontend interface that lets users filter logs in real time. “Fun fact,” Ro says, “two years ago, when I joined Modal, this was the first feature I built—and my first experience with ClickHouse. It was great.”
Three dashboards powered by one ClickHouse table #
At Open House, Ro walked through three real-time dashboards, each powered by ClickHouse, that give Modal’s customers visibility into how their code is running in the cloud.
The first is the Function Page, which shows how a given function is scaling over time. Engineers can see when calls started, how long they took, and whether they completed successfully.
The second is the Function Call Timeline, which traces the lifecycle of a single function call. It breaks things down into three stages: how long the call spent in queue, how long the container took to cold-start, and how long the function took to run.
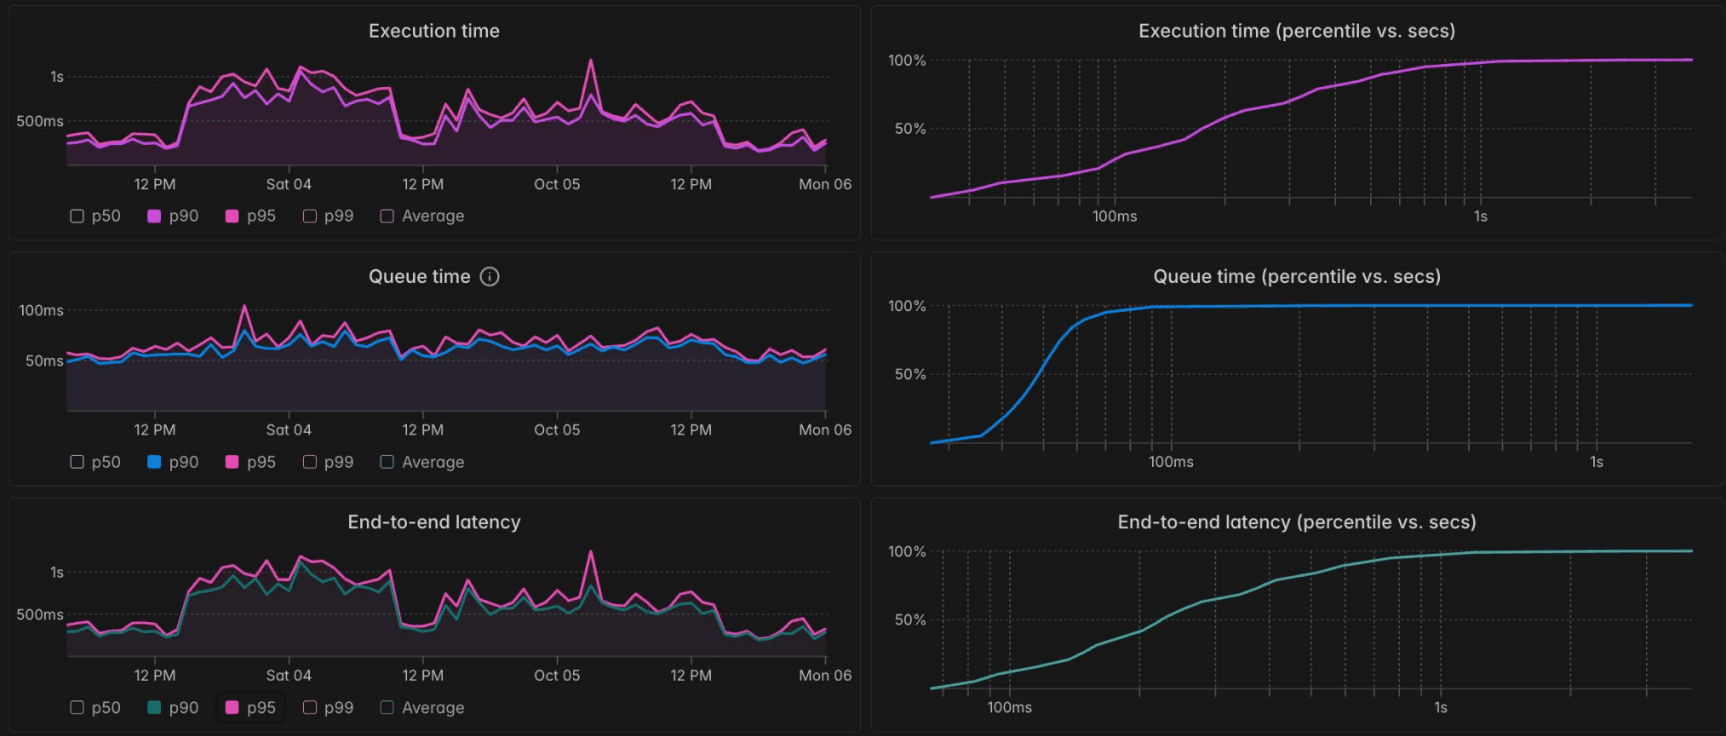
The third is Performance Metrics, which shows high-level latency trends across many calls. “Our customers really care about how their functions are doing in production,” Ro says. Users can inspect execution time, queue time, and end-to-end latency, and track percentile curves (e.g. P50, P90, P99) to understand how performance varies under load.

Modal’s performance dashboard with execution time, queue time, and end-to-end latency percentiles.
And the big “reveal,” as Ro puts it? All three dashboards are powered by a single ClickHouse table. “That’s really impressive to us,” he says, “because at Modal we try to keep things operationally simple. We want to be able to move fast, but we also care a lot about reliability."
Under the hood with ClickHouse #
Modal’s ClickHouse pipeline starts with events—1 to 2 million of them, every minute.
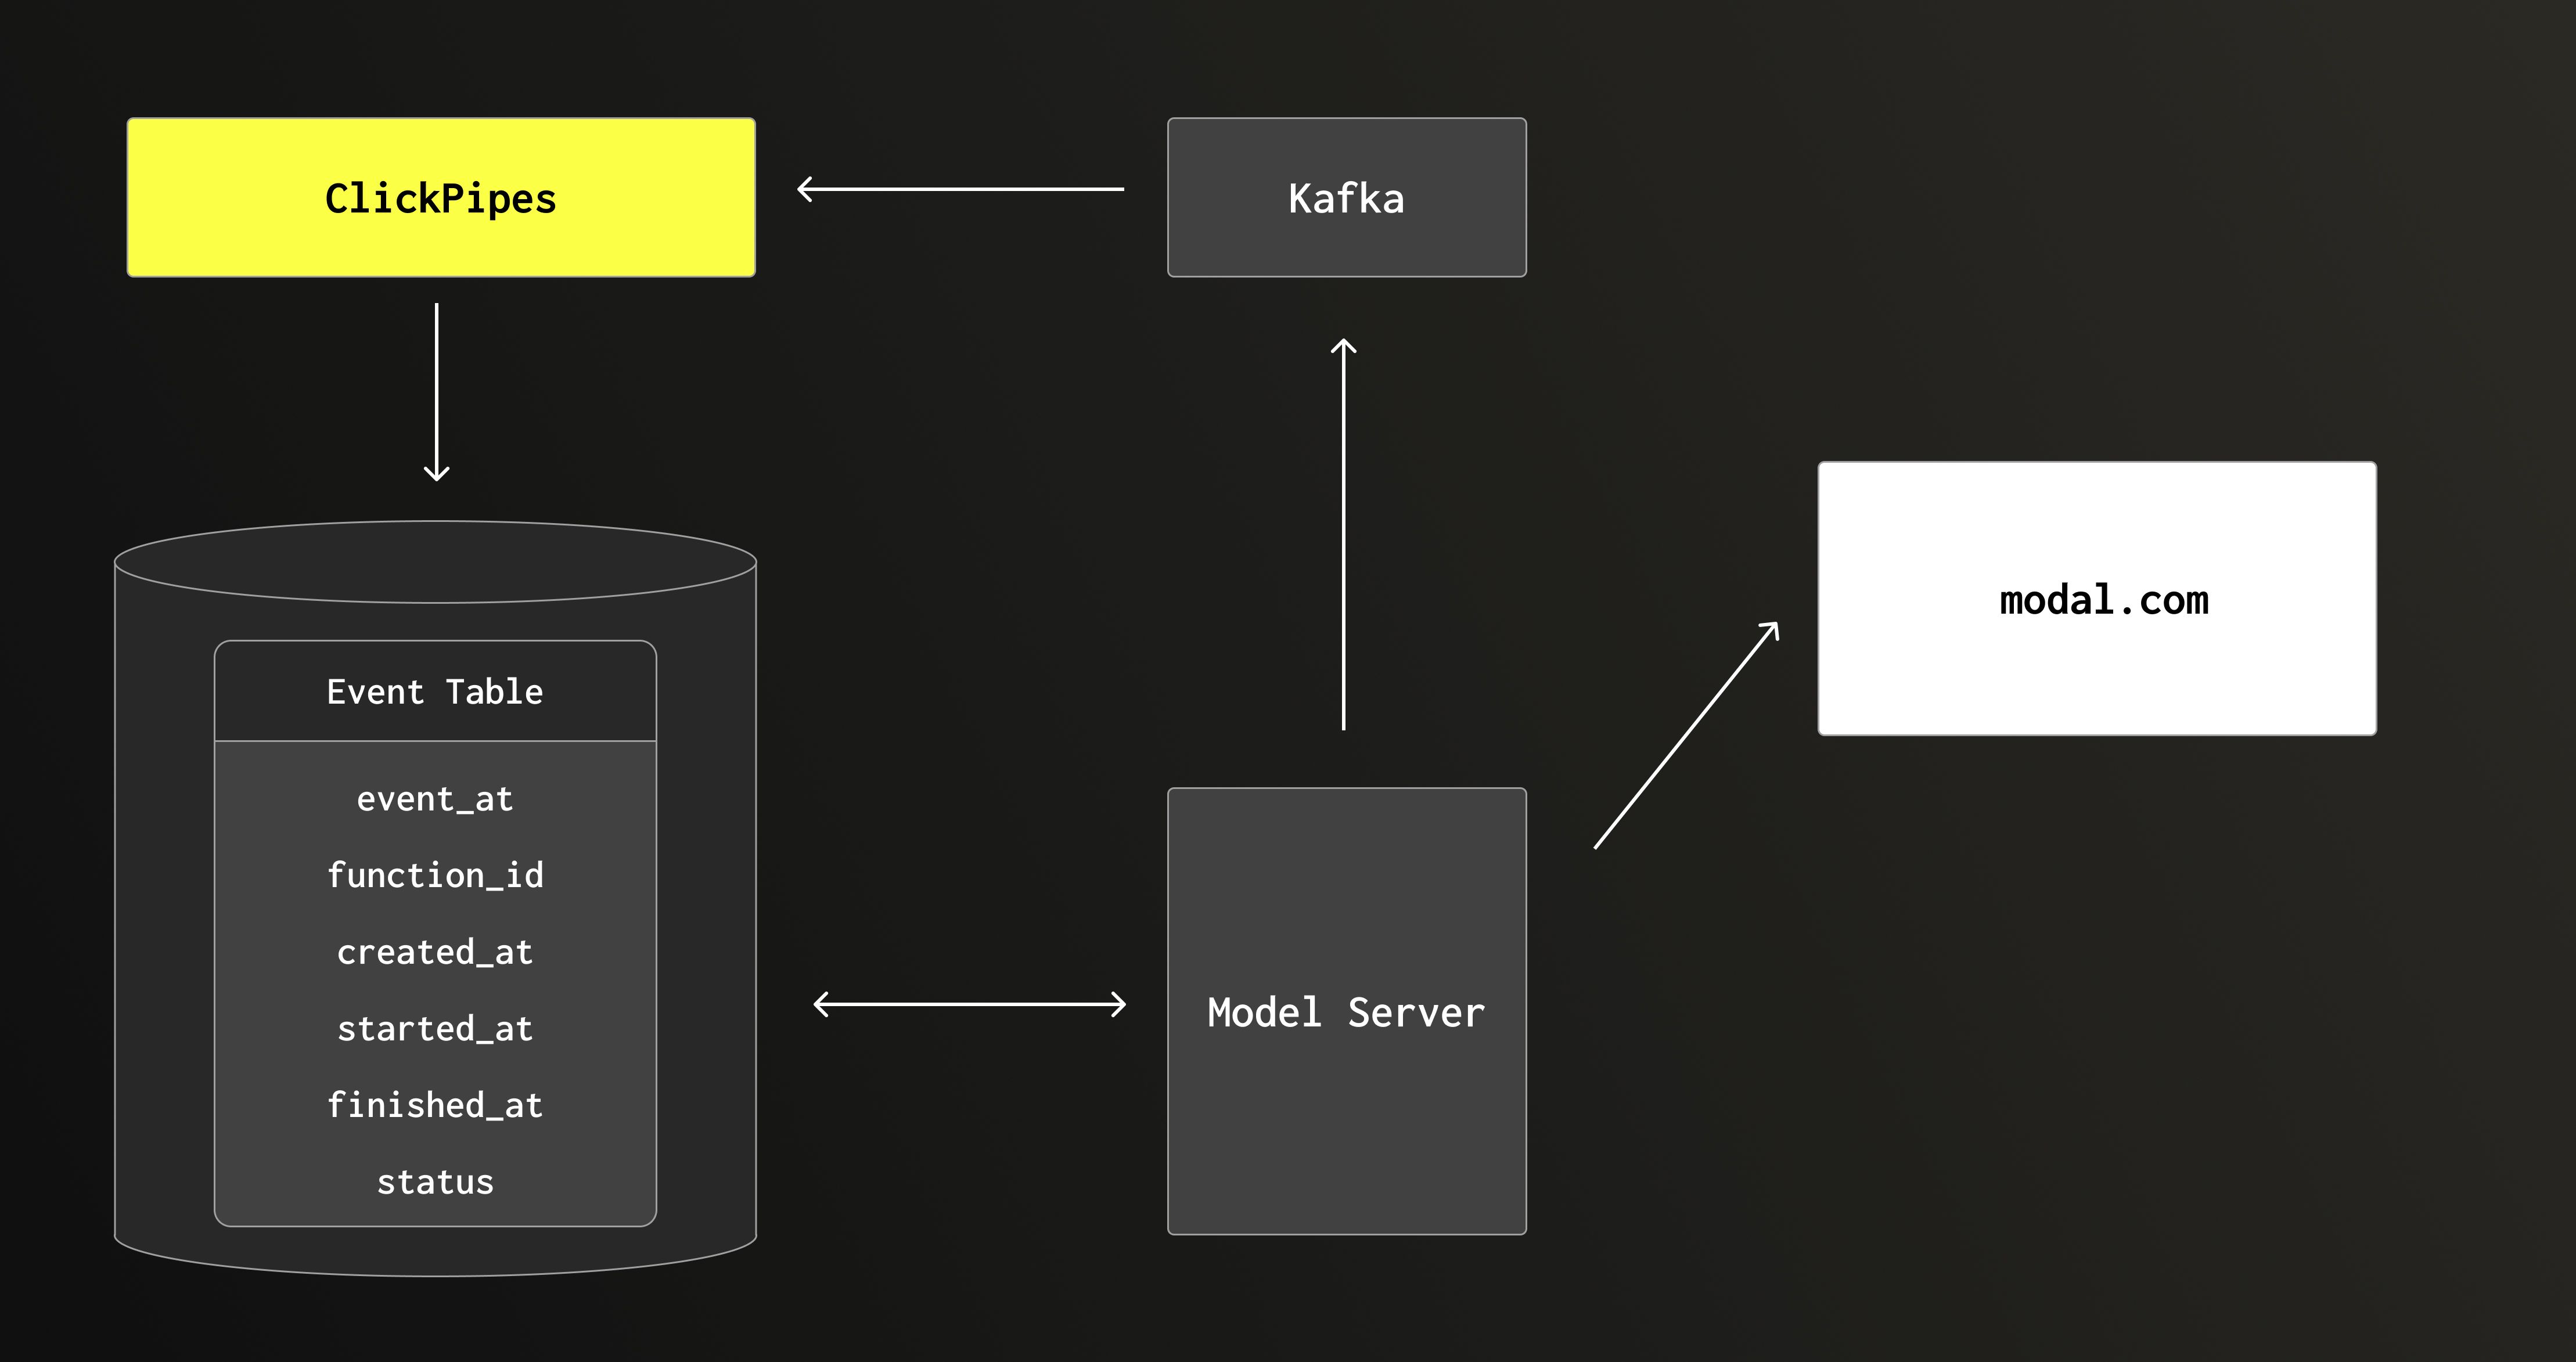
Each function call emits a sequence of events, including queued events, executing events, and finished events. These partial rows are streamed through Kafka and shaped by ClickPipes, ClickHouse Cloud’s native ingestion engine, before being written into ClickHouse.

Modal’s events architecture: data flows to ClickHouse dashboards via Kafka and ClickPipes.
The table itself uses ClickHouse’s ReplacingMergeTree engine, which Ro describes as “very convenient for streaming architectures.” Each row is keyed on a composite primary key of function_id, function_call_id, and event_at.
To query the data efficiently, Modal uses ULIDs—universally unique, lexiconographically sortable identifiers. “What that means is the IDs are sorted,” Ro explains, “so you can do range queries using the primary key on this table. That leads to efficient queries, since we can pass a single function call ID or a range of them.”
To reconstruct the full lifecycle of a function, they use GROUP BY function_call_id. To show only the latest status, they use argMaxIf, which Ro calls “really handy for event workloads.” It lets them return the most recent value of a field, filtered by condition and timestamp, so if a function fails and then later succeeds, the dashboard only shows the final result.
Even latency percentile metrics are calculated directly in ClickHouse. For queue time, Modal subtracts enqueued_at from started_at, and then uses aggregate functions like avg and quantile to calculate P50, P90, and P99 values.
Scaling up—and looking ahead #
Near the end of his talk, Ro showed a slide with some impressive numbers—19 TB of events ingested, 1 million events per minute, a P90 of ~420 milliseconds—but he had to revise that on the fly. “I actually checked today and it's 2 million events per minute,” he clarified. “So we're growing pretty fast.”
Even as usage scales, Modal has kept things simple. “We don’t use indexes or projections or materialized views,” Ro says. “Now we’re starting to optimize things to get better latency for our customers. And there are certain edge cases that we want to improve.”
Looking ahead, the team is exploring several new features and improvements. As Ro explains, these include a billing API that lets users answer questions like, “For this function, on this day, for this range of function calls—how much did that cost me?” They’re also building a visual function call graph, enhancing support for batched jobs, and continuing to improve performance for real-time queries.
“We’re focused on making it super easy for customers to understand how their code is running in the cloud,” Ro says. With ClickHouse Cloud, they’re well-positioned to do just that.


