TL;DR
-
Find structure in chaos: Event patterns in ClickStack automatically cluster similar logs and traces, surfacing key behaviors and anomalies without predefined rules.
-
Analyze at query time: Built on Drain3, ClickStack performs dynamic pattern analysis directly in the browser for any search result set.
-
Work smarter, not harder: Use patterns to cut through noise, identify recurring issues, and uncover rare signals to accelerate observability analysis.
Analyzing logs at scale is one of the most persistent challenges in observability. Modern systems emit massive volumes of unstructured data - they are often repetitive, noisy, and lacking the context engineers need to act on. The result is an ocean of log lines where the signal is buried in noise, and finding meaning becomes a slow, expensive process.
Event patterns help you cope with this noise, providing a way to make sense of what’s already there and surfacing the key events.
In this post, we’ll explore why log analysis is inherently hard, what event patterns solve, how ClickStack implements them, and why we’ve chosen to do so at query time. We’ll also share practical guidance on how to make the most of event patterns today, and look ahead to how this technology could further improve compression and performance in the future.
The problem: Why log analysis is hard
When something goes wrong, you often start with an alert or a trace, which is ideal - you already have a direction and context. But in exploratory scenarios, when you only know that “something’s off” and need to start from raw logs, the challenge multiplies.
Logs, especially from undisciplined systems or teams, can be incredibly verbose. They mix valuable signals with overwhelming amounts of noise, often repeating similar messages or recording irrelevant details. This verbosity makes it nearly impossible to chart every event or review each line individually. Engineers resort to iterative analysis with charting patterns, filtering errors, and refining queries over and over - hoping to gradually uncover the story beneath the noise.
Event patterns aren’t a silver bullet. Most logs are noise - and the real solution starts upstream, with better decisions about what to log in the first place. The reality is that not every team or system logs perfectly, however, and event patterns still help surface the important signals amongst the noise.
While Lucene-style search helps when you know what you’re looking for, it offers little support when you don’t. In these cases, the process becomes one of pattern discovery: scanning massive datasets to find recurring behaviors or outliers. It’s an inherently difficult problem and akin to finding a needle in a haystack, except the haystack keeps growing every second.
Lucene (aka. Natural language querying) helps with needle in a haystack when you know what you’re looking for.
Event analysis extends beyond logs to traces and metrics, but the same challenge applies: when the data is unstructured and high-volume, extracting insight quickly is both computationally demanding and mentally taxing.
Get Started with ClickStack today
Spin it up with a single command, download the open-source stack, and start exploring real-time analytics in minutes.
Get startedHow event patterns help log analysis
Event patterns in ClickStack make log and event analysis simpler by turning overwhelming noise into clear, structured insight. Instead of forcing you to sift through millions of raw events, they automatically detect recurring structures and group similar messages together into clusters - each representing a generalized “pattern” of behavior.
These clusters give you a compact, high-level view of your data: you can immediately see which patterns occur most frequently, which are new or unusual, and how their frequency changes over time.
Frequent patterns often represent healthy or expected system behavior, while rare ones tend to reveal anomalies or emerging issues.
Because event patterns are generated dynamically, you don’t need to define regular expressions or maintain brittle parsing rules. ClickStack adapts automatically to whatever data your systems produce, whether structured or free-text. This flexibility makes it easy to spot recurring errors, uncover noisy sources, or understand the types of logs a service emits - all without prior knowledge of what to search for.
Beyond incident response, event patterns also help teams improve their observability hygiene. By visualizing which logs dominate the volume, you can identify redundant or low-value messages to trim - giving you patterns you can add to your pipeline to filter events before ingestion or make sure your developers are “educated” on logging discipline!
Using event patterns in ClickStack
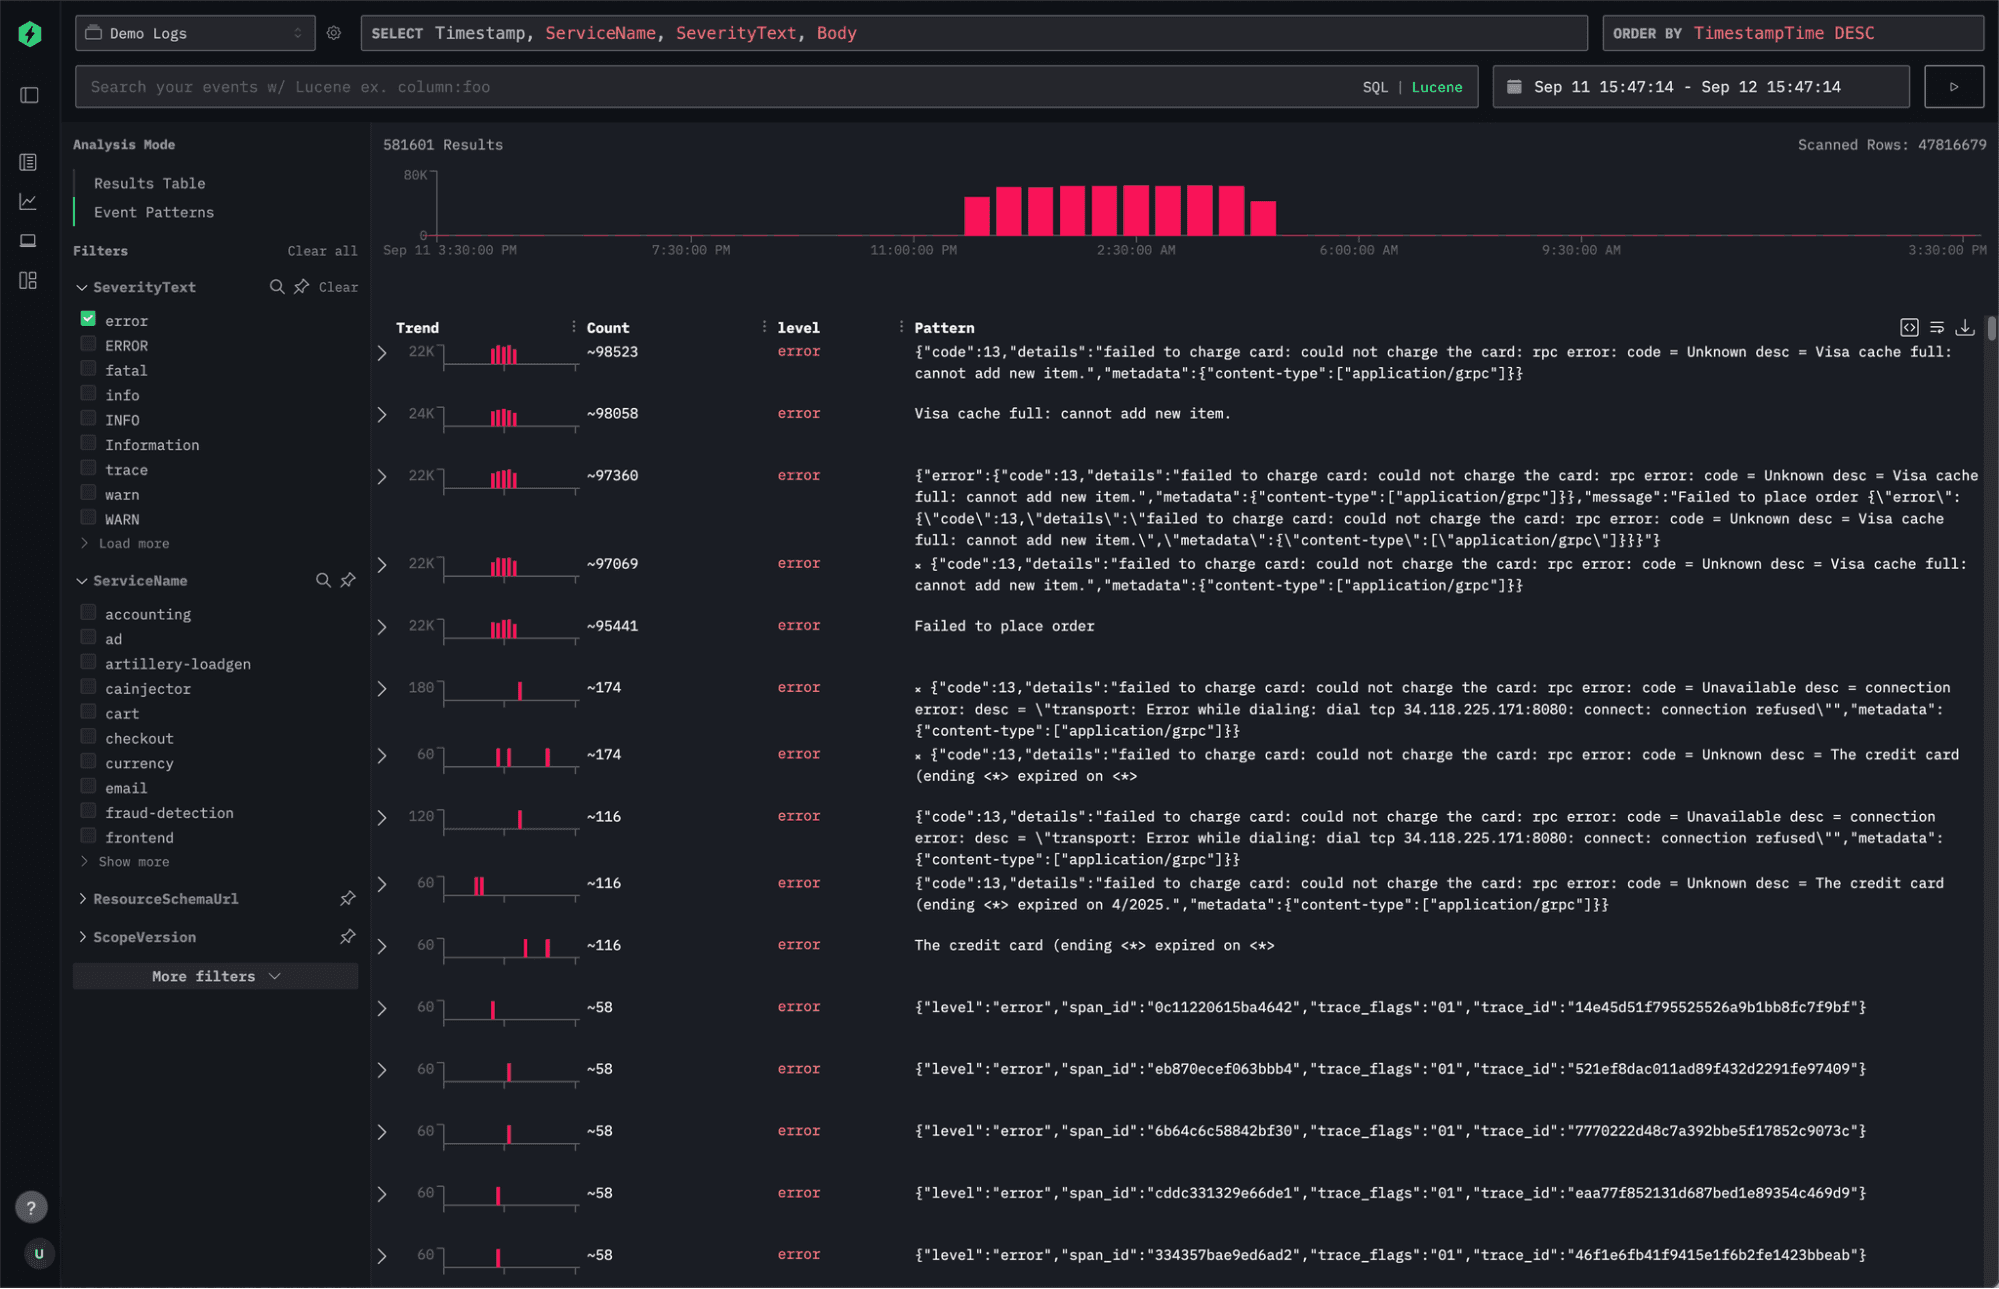
Event patterns in ClickStack are designed to complement, not replace, traditional search. The workflow starts with a familiar step: issuing a search query to narrow the full corpus down to a relevant subset of events. That subset might still include millions of results - too many to inspect directly. Instead of displaying a giant table of raw logs, you can select “Event Patterns” on the left side to trigger a structured analysis of those returned events.
When selected, ClickStack begins analyzing the matching data to identify recurring message structures. Importantly, it doesn’t attempt to cluster every single result - doing so would be computationally expensive and unnecessary. Instead, ClickStack samples a representative subset of the data, ensuring that the sample is large enough to be statistically meaningful and evenly distributed across the result set.
Once the analysis completes, you’re presented with a condensed view of your events grouped by similarity. Each cluster corresponds to a distinct log or event pattern, allowing you to instantly see which types of messages dominate the sample and which rare ones might warrant deeper investigation.
In the example above, we begin by filtering down to the payment service, then apply an error filter. Within seconds, event patterns surface an interesting and recurring error - something that would have taken far longer to spot by scrolling through raw logs or iteratively refining search queries.
How ClickStack implements event patterns
Under the hood, event clustering in ClickStack is powered by Drain3, an open-source, high-performance log template mining library. Drain3 is an online log clustering algorithm that efficiently extracts templates, or “patterns”, from streams of log messages. It uses a fixed-depth parse tree to guide how log groups are formed, avoiding the deep and unbalanced structures that can make other algorithms slow or memory-heavy. This approach makes it fast enough to operate interactively, even on large log datasets.
We made a deliberate decision to integrate Drain3 at query time rather than at insert time. This design gives users the flexibility to discover and analyze patterns dynamically within any subset of their data, directly complementing the search experience. Running clustering at ingest would allow pre-tagging of log patterns but would also introduce heavy overhead - especially at ClickStack’s ingestion scales of gigabytes per second across petabytes of data. Performing the analysis on demand keeps ingestion lightweight and ensures the insights are always contextual and up to date.
Because Drain3 is written in Python, we use Pyodide to execute it directly in the browser. Pyodide is a full Python runtime compiled to WebAssembly that runs entirely client-side, with no backend processing required. It supports much of the Python standard library and key data science packages such as numpy, pandas, and matplotlib. Using Pyodide allows ClickStack to run Drain3 seamlessly within the browser environment while still interacting with JavaScript for visualization and UI updates.
Even with a lightweight algorithm like Drain3, running clustering over billions of rows at query time would be impractical. To balance accuracy and performance, ClickStack applies sampling, selecting a statistically representative subset of 10,000 events for analysis with the aim of returning clusters within a few seconds. This sampling is random but evenly distributed to ensure coverage across the query’s time range and services.
For example, when analyzing logs in the above example, ClickStack might issue a query like:
WITH
now64(3) AS ts_to,
ts_to - INTERVAL 900 SECOND AS ts_from,
tableStats AS
(
SELECT count() AS total
FROM otel_v2.otel_logs
WHERE TimestampTime >= ts_from
AND TimestampTime <= ts_to
)
SELECT
Body AS __hdx_pattern_field,
TimestampTime AS __hdx_timestamp,
SeverityText AS __hdx_severity_text,
TimestampTime,
ServiceName
FROM otel_v2.otel_logs
WHERE
TimestampTime >= ts_from
AND TimestampTime <= ts_to
AND if(
(SELECT total FROM tableStats) <= 10000,
1,
cityHash64(TimestampTime, rand()) %
greatest(
CAST((SELECT total FROM tableStats) / 10000, 'UInt32'),
1
) = 0
)
LIMIT 10000;This query employs some tricks to make sampling efficient, over the naive approach of just ordering by rand().
In practice, this sample size is sufficient to identify both dominant and anomalous patterns with high confidence - providing a fast, accurate snapshot of what’s happening without overwhelming compute resources or the user.
Making the most of log patterns
Event patterns are most powerful when used as part of an iterative exploration process - bridging the gap between broad searches and precise debugging. Here are a few practical ways to get the most out of them in ClickStack:
Start broad, then narrow down
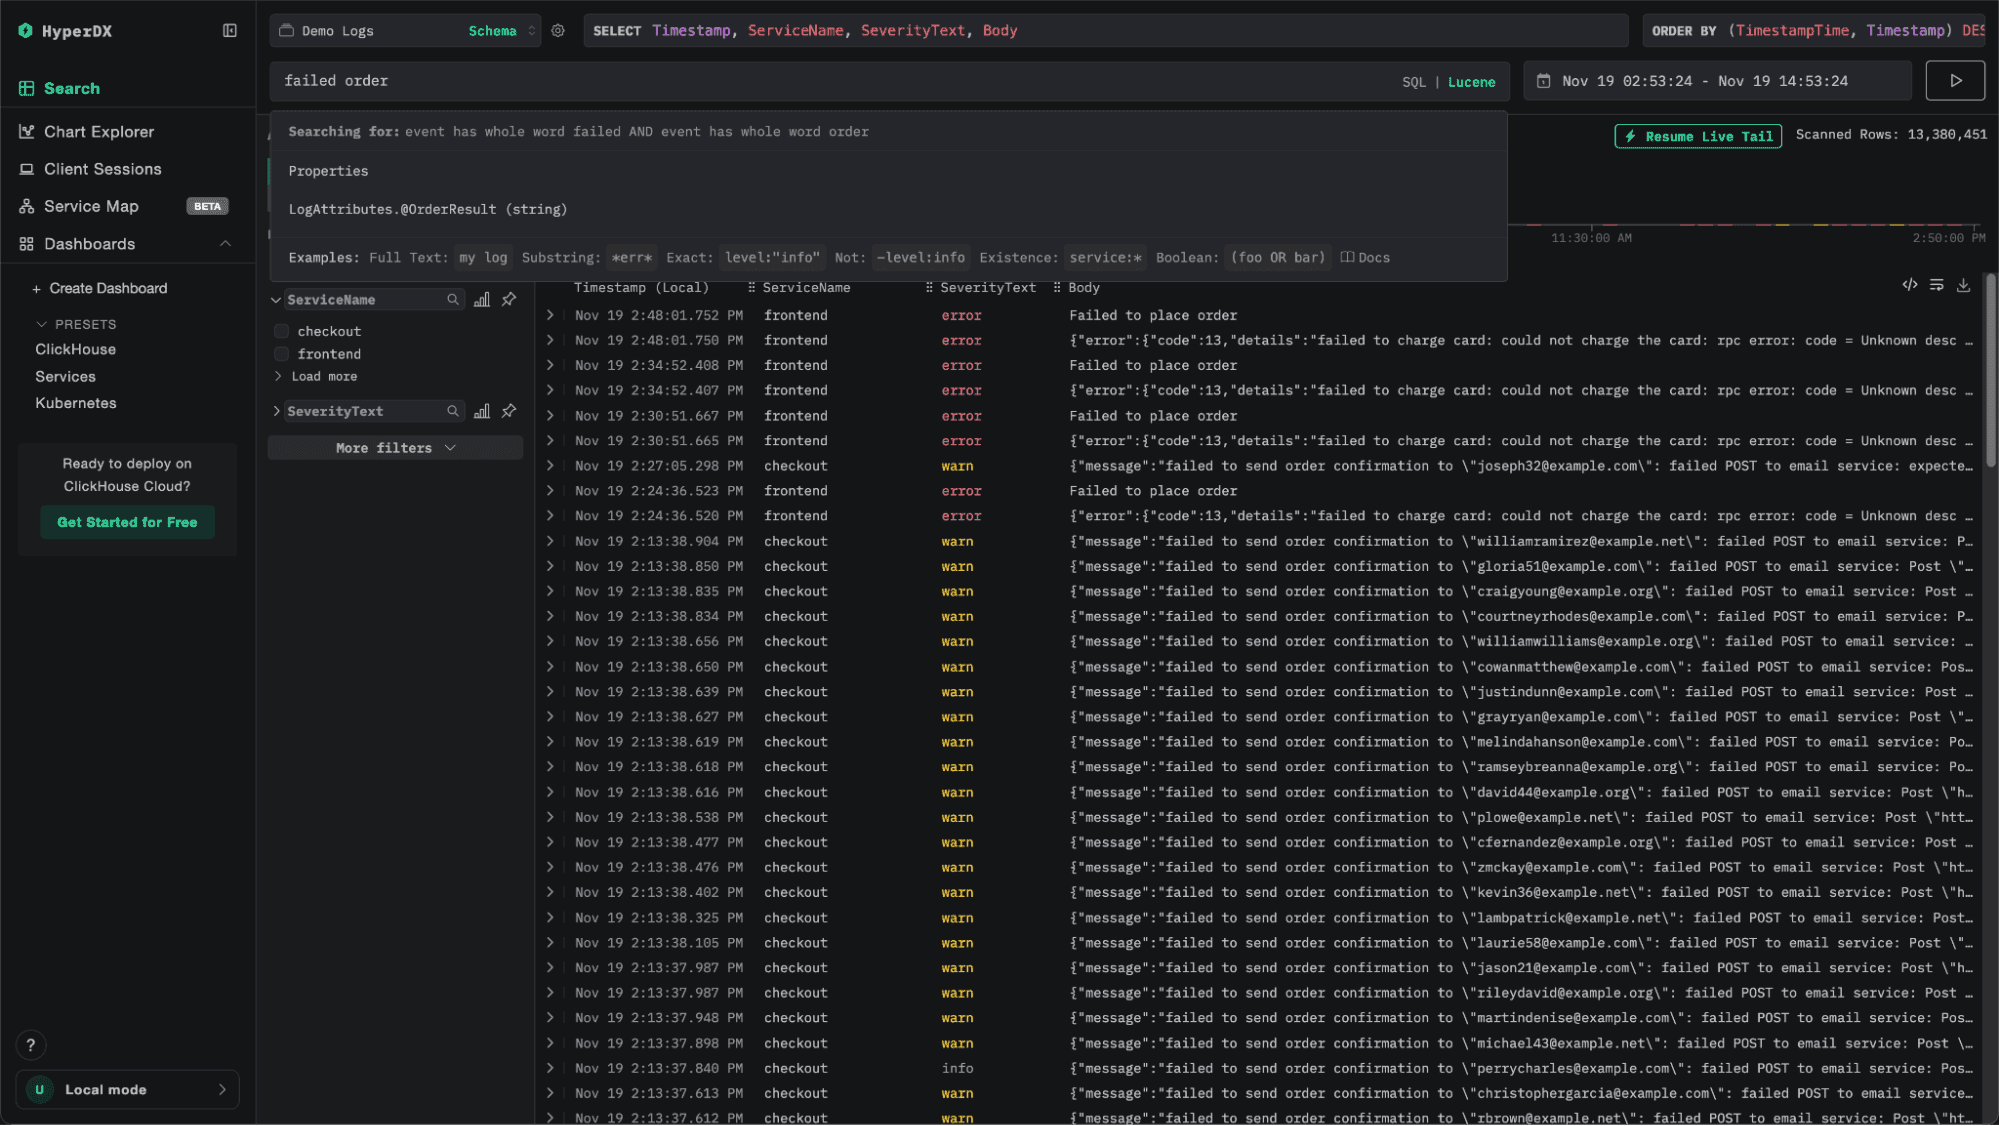
Begin with a wide search, such as filtering by service or severity, to capture a representative view of recent activity. Then, use Event Patterns to quickly identify dominant behaviors and narrow in on unusual or emerging signals. Once a pattern of interest appears, pivot back to traditional search or traces for deeper investigation.
Combine with structured filters
Event patterns shine when paired with meaningful filters like ServiceName, SeverityText, or deployment_id. This ensures that sampling focuses on relevant data, improving both performance and accuracy. For example, filtering by error logs before running pattern analysis will highlight failure types across a service, while filtering by warn might uncover degradation before it becomes critical.
Treat rare patterns as signals
In most systems, rare patterns are sometimes more interesting than common ones. They may indicate new error paths, edge-case failures, or recently introduced regressions. Sorting or filtering by frequency within the event pattern view helps quickly surface these valuable outliers.
In summary, pattern analysis is best for understanding what’s happening at a high level, not for pinpointing why it’s happening. Use it to orient yourself quickly and find leads, then switch to raw search, traces, or metrics for root cause analysis.
Finally, remember event patterns don’t eliminate the need for better logs - but they make it far easier to see through the noise of an imperfect world.
Looking ahead
Looking ahead, we see several opportunities to extend how event patterns are used across the ClickStack ecosystem. In a recent blog post, we explored how the Drain3 algorithm can be invoked directly as a user-defined function (UDF) within ClickHouse - allowing larger sets of data to be analyzed. Beyond just larger samples at query time, this opens some other interesting possibilities.
For example, event patterns can be used to identify common structures within specific log sources, such as those belonging to a single service or component. These learned templates could then be compiled to regular expression-based extraction rules, allowing ClickHouse to capture structured fields automatically at ingest time. Beyond accelerating queries, and avoiding schema-on-read operations, this structure can also significantly boost compression efficiency. We demonstrated this concept in a recent blog post which allowed compression to be increased to 170x.
We’re continuing to explore these directions and would love feedback from users who see potential applications in their own workflows. If you’re experimenting with event clustering in ClickStack, or using Drain3 as a UDF in ClickHouse, let us know how you’re using it and what capabilities you’d like to see next.
Conclusion
Event patterns bring a powerful layer of intelligence to observability in ClickStack by helping teams navigate noisy, unstructured data with clarity and speed. By grouping similar events and surfacing anomalies in context at query time, they reduce time to insight and make exploratory log analysis far more approachable. While they don’t replace disciplined logging practices, they provide a practical way to uncover meaningful signals in complex systems. As ClickStack continues to evolve, event patterns lay the groundwork for smarter, more adaptive analytics that turn even the messiest data into actionable understanding.


