It’s hard to believe that ClickStack only launched in late May last year. The pace since then has felt more like a full year of product evolution than 7 months. ClickStack has gained native JSON support, dashboards import/export, support for Materialized Views, performance wins across every layer, a full alerting system, and the arrival of features like Service Maps.
Alongside the monthly releases, we also brought ClickStack into ClickHouse Cloud, marking the first step toward a unified environment where observability and analytics live side by side. And we’re nowhere near done. 2026 will raise the ceiling again with deeper Cloud integration, a fully managed ClickStack experience, AI powered notebooks, anomaly detection, out-of-the-box integrations and even more opinionated defaults that let teams adopt observability with almost no operational effort.

This post looks back on our journey from May through December: the key features introduced each month as the stack has matured into something far more capable than the version we first announced. This list is in no way exhaustive, rather focusing on those features we’re most proud of. We’ll close with a look ahead at where we’re investing next and what users can expect from ClickStack in 2026.
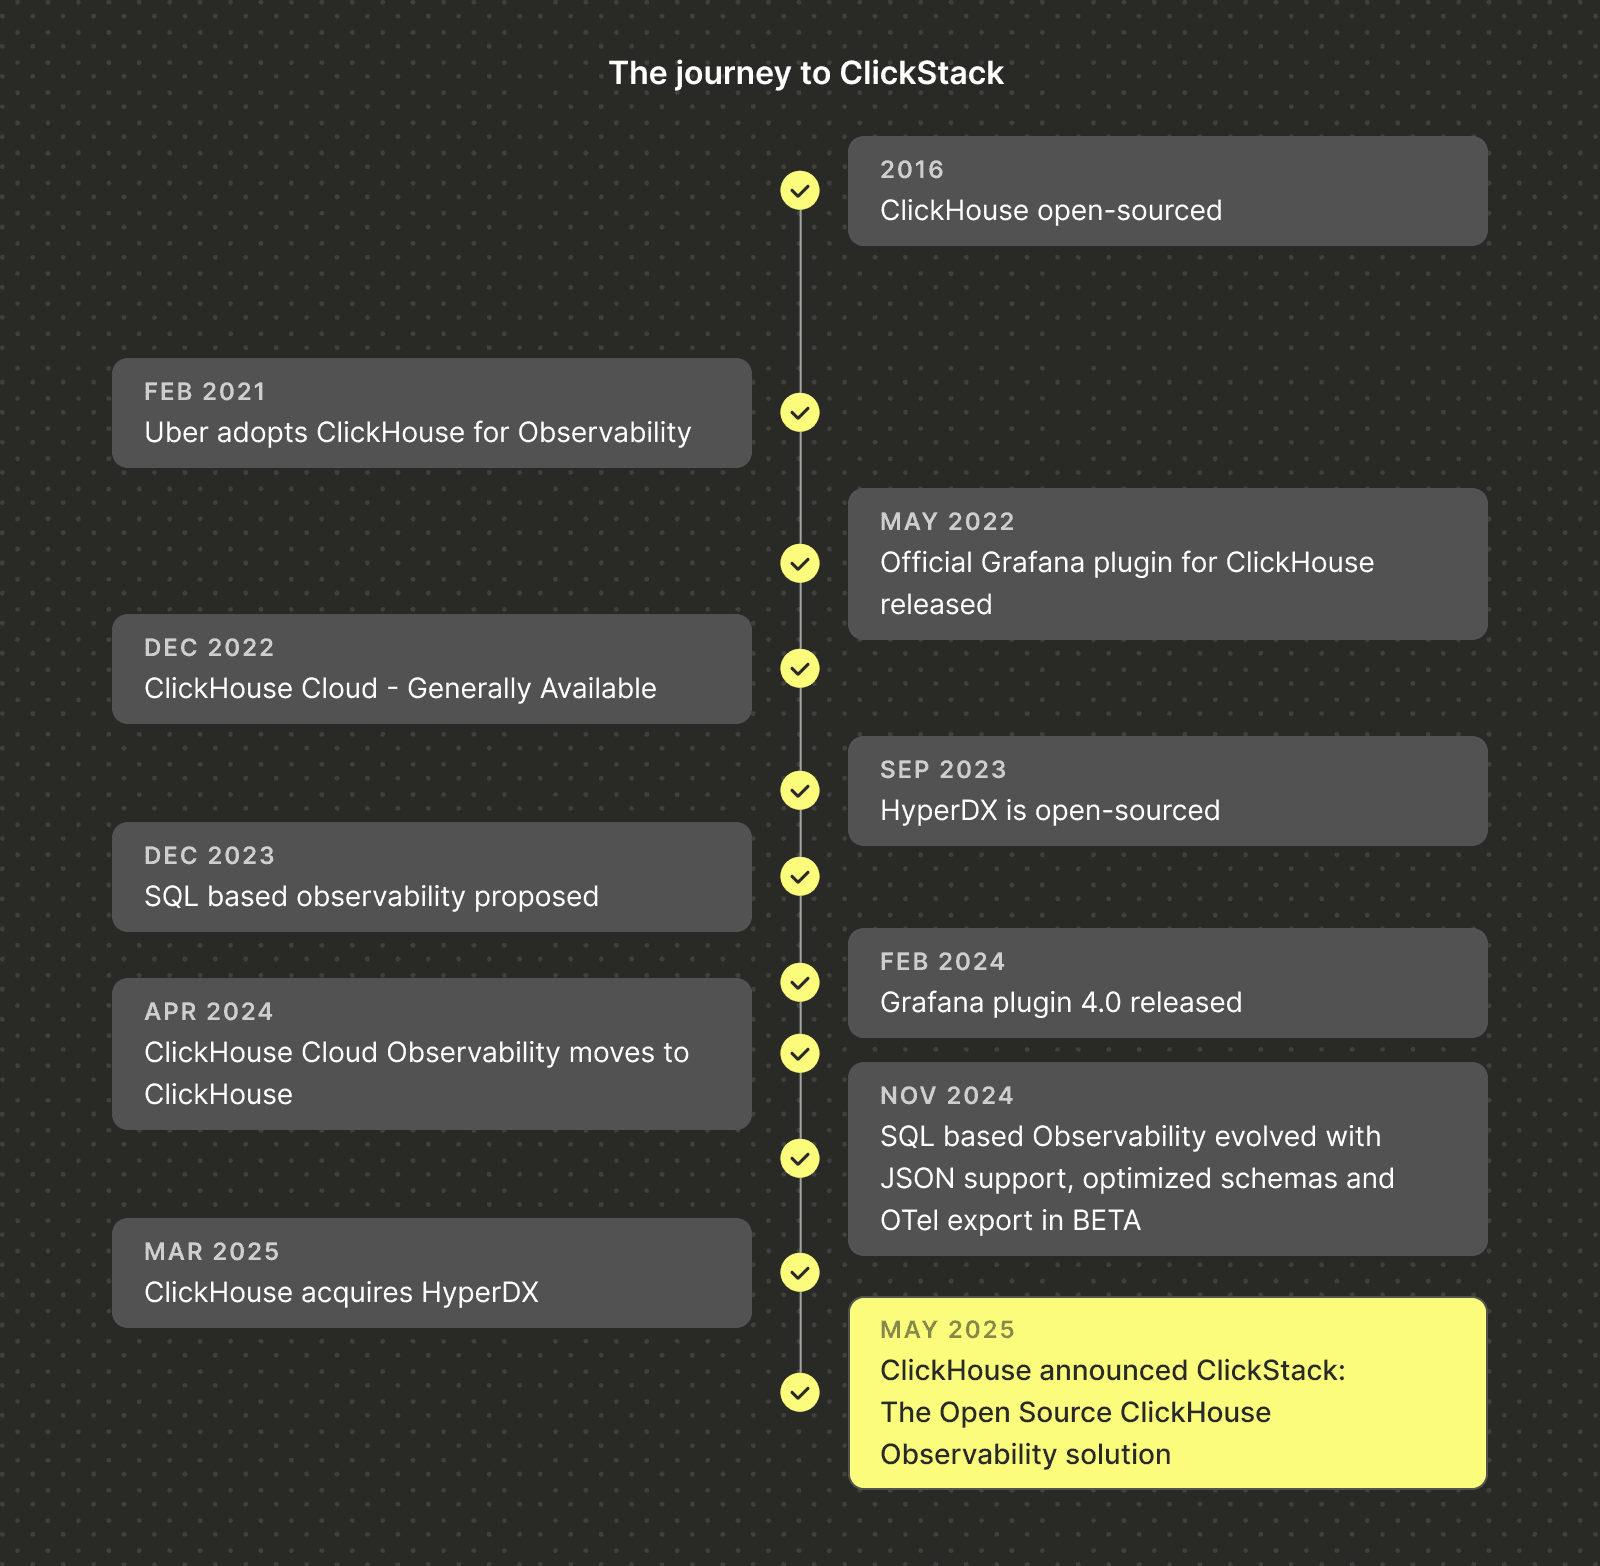
ClickStack began as a response to a clear pattern we had seen for years. Teams at scale such as Netflix and Anthropic, were already using ClickHouse as the foundation for their observability systems, taking advantage of its ability to store and query wide events with high cardinality and deep context. What they lacked was an opinionated, end to end experience. HyperDX changed that trajectory. When the project open sourced its next generation UI in late 2024, it gave us a modern workflow layer built specifically around ClickHouse strengths: fast search, fast aggregations, and a UI that understands how to construct efficient queries without hiding the power of SQL. Bringing HyperDX and ClickHouse together created an opportunity to offer something the ecosystem had been missing, a complete open source observability stack that embraced OpenTelemetry and delivered logs, metrics, traces, and session replay in one place.

That vision became real in May with the launch of ClickStack. This first release bundled an opinionated OpenTelemetry collector, and a ClickHouse native UI through HyperDX. It delivered a turnkey workflow for ingestion, search, dashboards, and debugging while still giving advanced users full access to SQL and the ability to customize schemas as needed. What started as an integration of proven building blocks quickly became a cohesive product, built around the idea that observability is a data problem best solved by a column store and an experience tailored for it.
Most importantly, ClickStack democratized access to the advantages that only large engineering teams had previously enjoyed. Until now, the full potential of ClickHouse for observability was reserved for organizations that could afford to build custom ingestion paths, schemas, and UI layers. Open-source ClickStack removed that barrier. It delivered a unified experience where the UI, schema, and engine work together by design, offering an observability workflow that finally takes full advantage of ClickHouse performance while remaining open, accessible, and effortless to adopt.
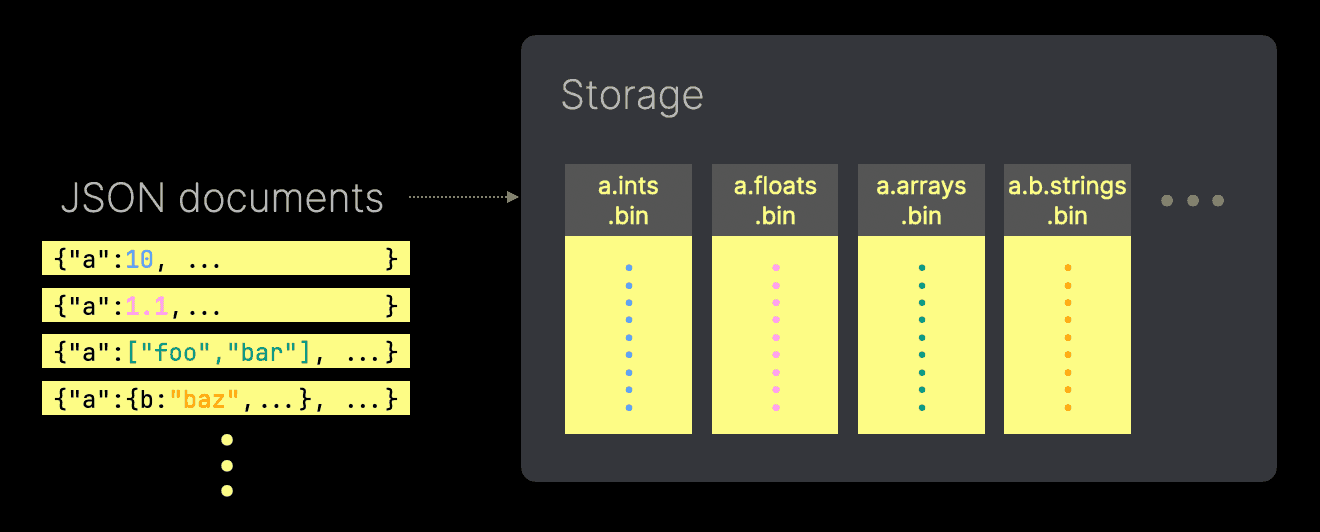
Just weeks after launch, July brought the arrival of native JSON type support. JSON had been evolving inside ClickHouse for several release cycles, gradually maturing into a high performance, column aware format that preserves structure and types while enabling sub column pruning. By July, the feature was ready for production workloads, and ClickStack became one of the first large scale use cases to adopt it. Moving from Map based attribute storage to native JSON can unlock dramatic improvements for some workloads, including far less I/O, and the ability to work with deeply nested observability data without flattening or manual preprocessing.

Introducing JSON early in ClickStack’s lifetime promises faster queries, more expressive schemas, and an ingestion model that better reflects modern OpenTelemetry data. But the work isn’t done. We continue to study when JSON is the right choice, how to pair it with indexing strategies, and how it behaves under high volume observability workloads. Expect more guidance and benchmarking in the months ahead as we refine best practices and explore how far JSON can be pushed for real time, high cardinality telemetry at scale.
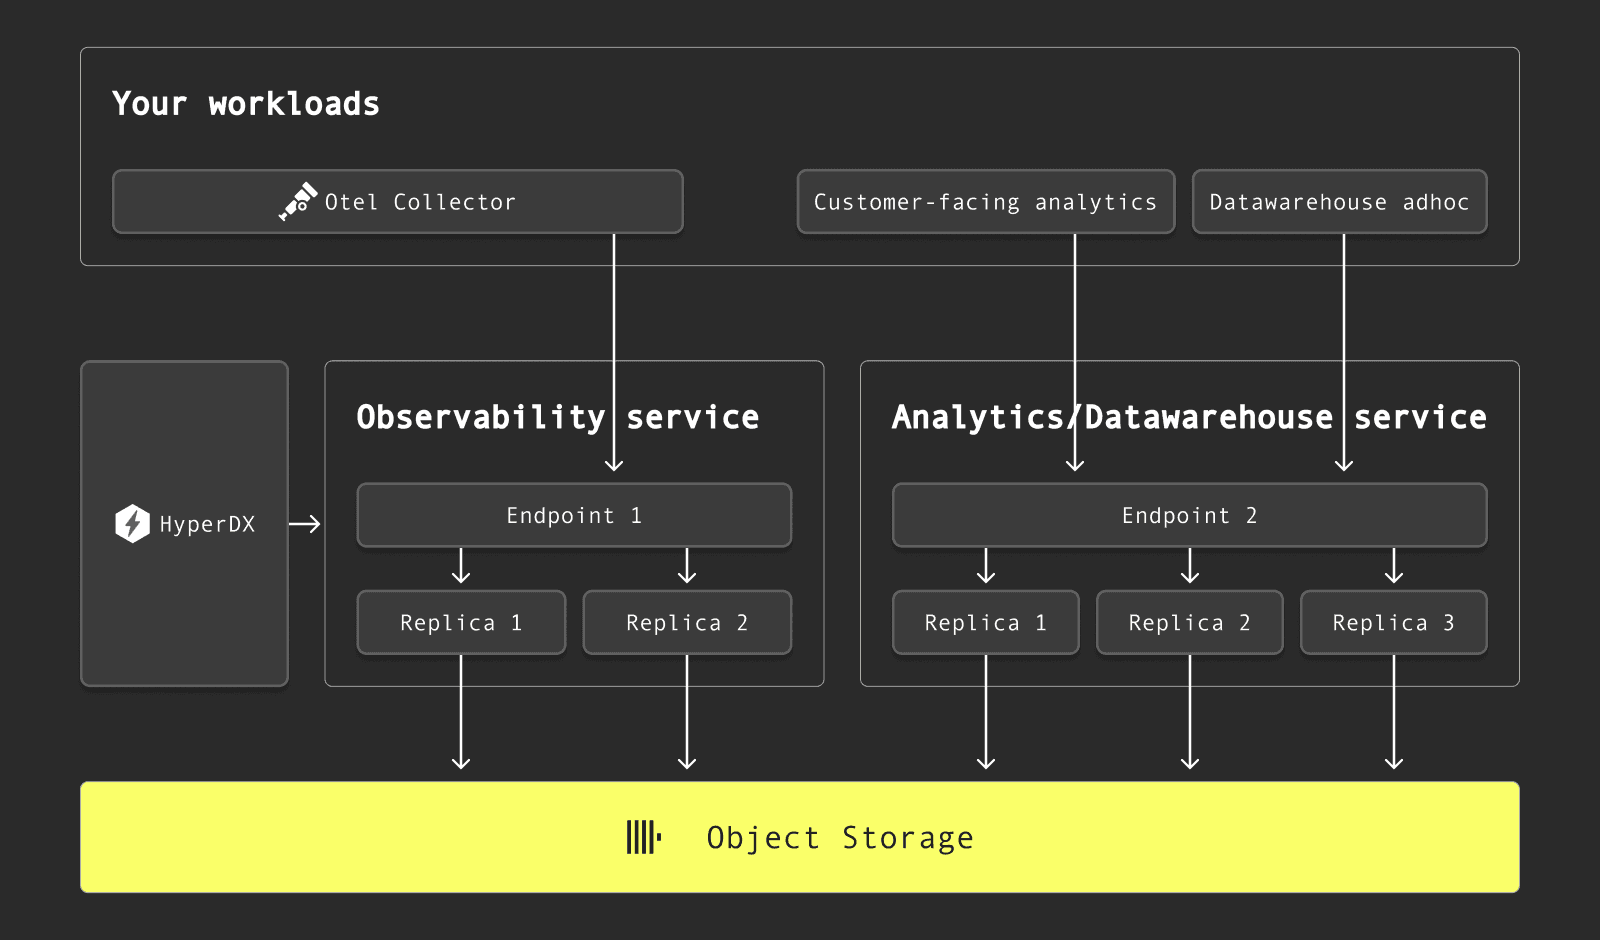
August marked a major milestone for ClickStack, the debut of the HyperDX powered UI directly inside ClickHouse Cloud. This wasn’t just about convenience. It represented the moment ClickStack moved from a self hosted open source experience to a first class, Cloud integrated product. For the first time, users could launch ClickStack with no infrastructure, no separate authentication, and no operational surface area, instantly pairing observability workflows with the same real time warehouse they already relied on for analytics. It opened ClickStack to three key groups: existing ClickStack users running on Cloud who now had one less component to manage, companies migrating large workloads from proprietary observability vendors who needed a cost efficient alternative that didn’t compromise on performance, and application teams already using ClickHouse Cloud for analytics who could now add observability with a single click.
This Cloud integration also made our broader vision tangible, unified observability and analytics in one system. Instead of treating telemetry as a separate silo, ClickStack in Cloud allows teams to join traces, logs, and metrics directly with application data, product events, and operational KPIs. It shifts observability from after the fact diagnosis to a fully correlated analytical workflow where business impact, performance regressions, and customer behavior can all be understood through one engine. At the core of this belief is the principle we’ve stated throughout the year:
We believe observability is just another data problem. And that it belongs in the same database as your business-critical analytics. With ClickHouse Cloud, you get the performance of a real-time warehouse, the scale and flexibility of object storage, and now the visibility of a modern observability UI - all in one stack.

Since launching in Cloud, we’ve continued onboarding customers steadily and have gathered feedback from some of the largest organizations using ClickHouse for observability today. These include deeply scaled teams such as Anthropic and character.AI, whose input has shaped how the UI behaves under high volume, high cardinality workloads. Their use cases have pushed the product further, influencing everything from performance optimizations to workflow simplifications. August wasn’t just a feature release, it was the start of a new chapter where ClickStack became a native part of ClickHouse Cloud and a foundation for the unified observability experience we’ll continue building in 2026.
Alongside this, we added further performance improvements for scale as well as early support for ClickHouse’s new inverted index - an effort aimed at improving full text search over log bodies. While still experimental, it’s an area we’re actively still evaluating, and it will remain a focus as we move into January 2026.
September: Dashboard import/export, custom collector config, and smarter queries
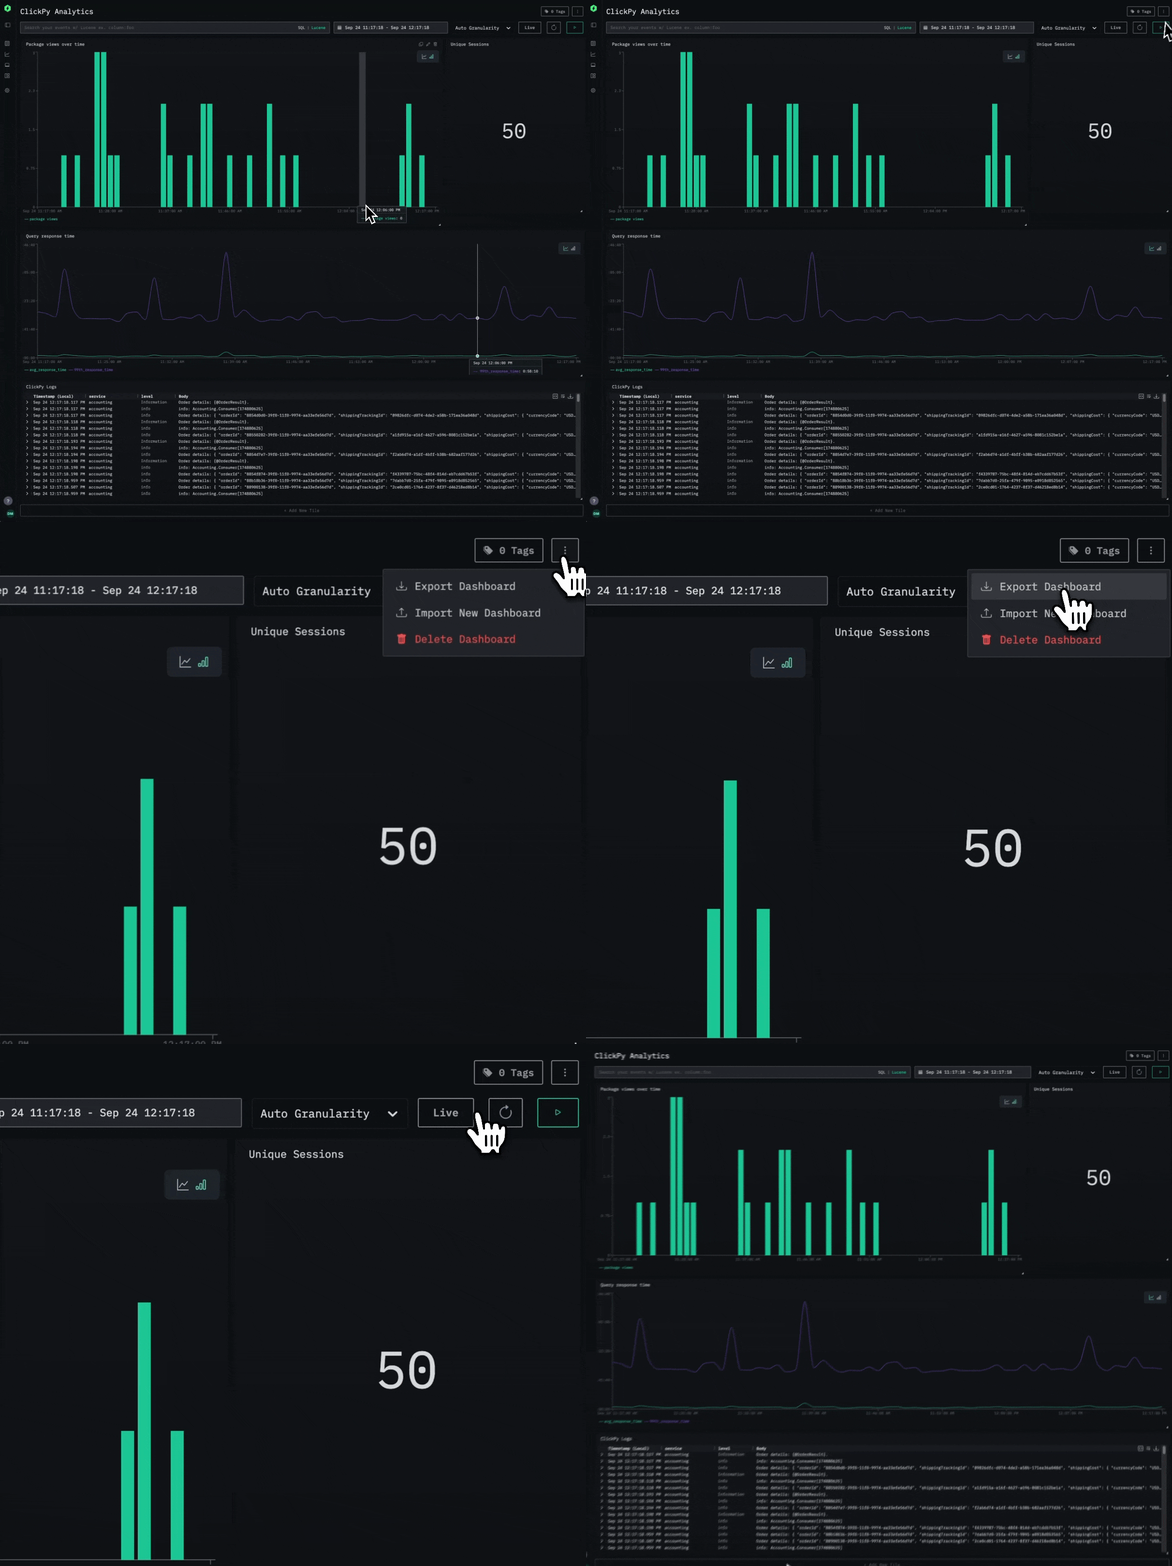
September introduced one of the most meaningful initial quality of experience improvements in ClickStack: dashboard import and export. This feature gives teams a faster path to value by allowing them to share dashboards internally, version them alongside code, and quickly spin up known good views when onboarding new services or teams. More importantly, it lays the groundwork for a community driven ecosystem of shared dashboards. Throughout the year we’ve been expanding our documentation with out of the box dashboards for common integrations and getting started scenarios, and we expect import/export to make it easier for users to contribute their own patterns back to the broader ClickStack community. Our hope is simple, dashboards should be as portable and composable as the SQL behind them.

September also introduced a powerful capability for extending ingestion workflows: custom OpenTelemetry collector configuration. Users can now layer their own pipelines and receivers on top of ClickStack’s default distribution, which is essential when consuming logs from sources such as Kafka, tailing host files, or adding custom processors. This change not only enables more complex production deployments, it also underpins the richer integration guides we’ve been publishing, making ClickStack easier to adopt across a variety of environments.
Alongside ingestion improvements came a major step forward in query performance. We implemented time window chunking for search, allowing ClickStack to fetch recent data first and stop early once enough results are returned. This optimization has since become a foundation for other performance wins, including faster chart rendering and more responsive histogram queries. It’s a clear example of how incremental improvements in September ultimately shaped the performance story of the entire stack.

Finally, September added support for custom aggregations in the UI, letting users tap directly into the full power of ClickHouse’s aggregation engine.
October: Alerting, flexible Event Deltas, and dashboard filters
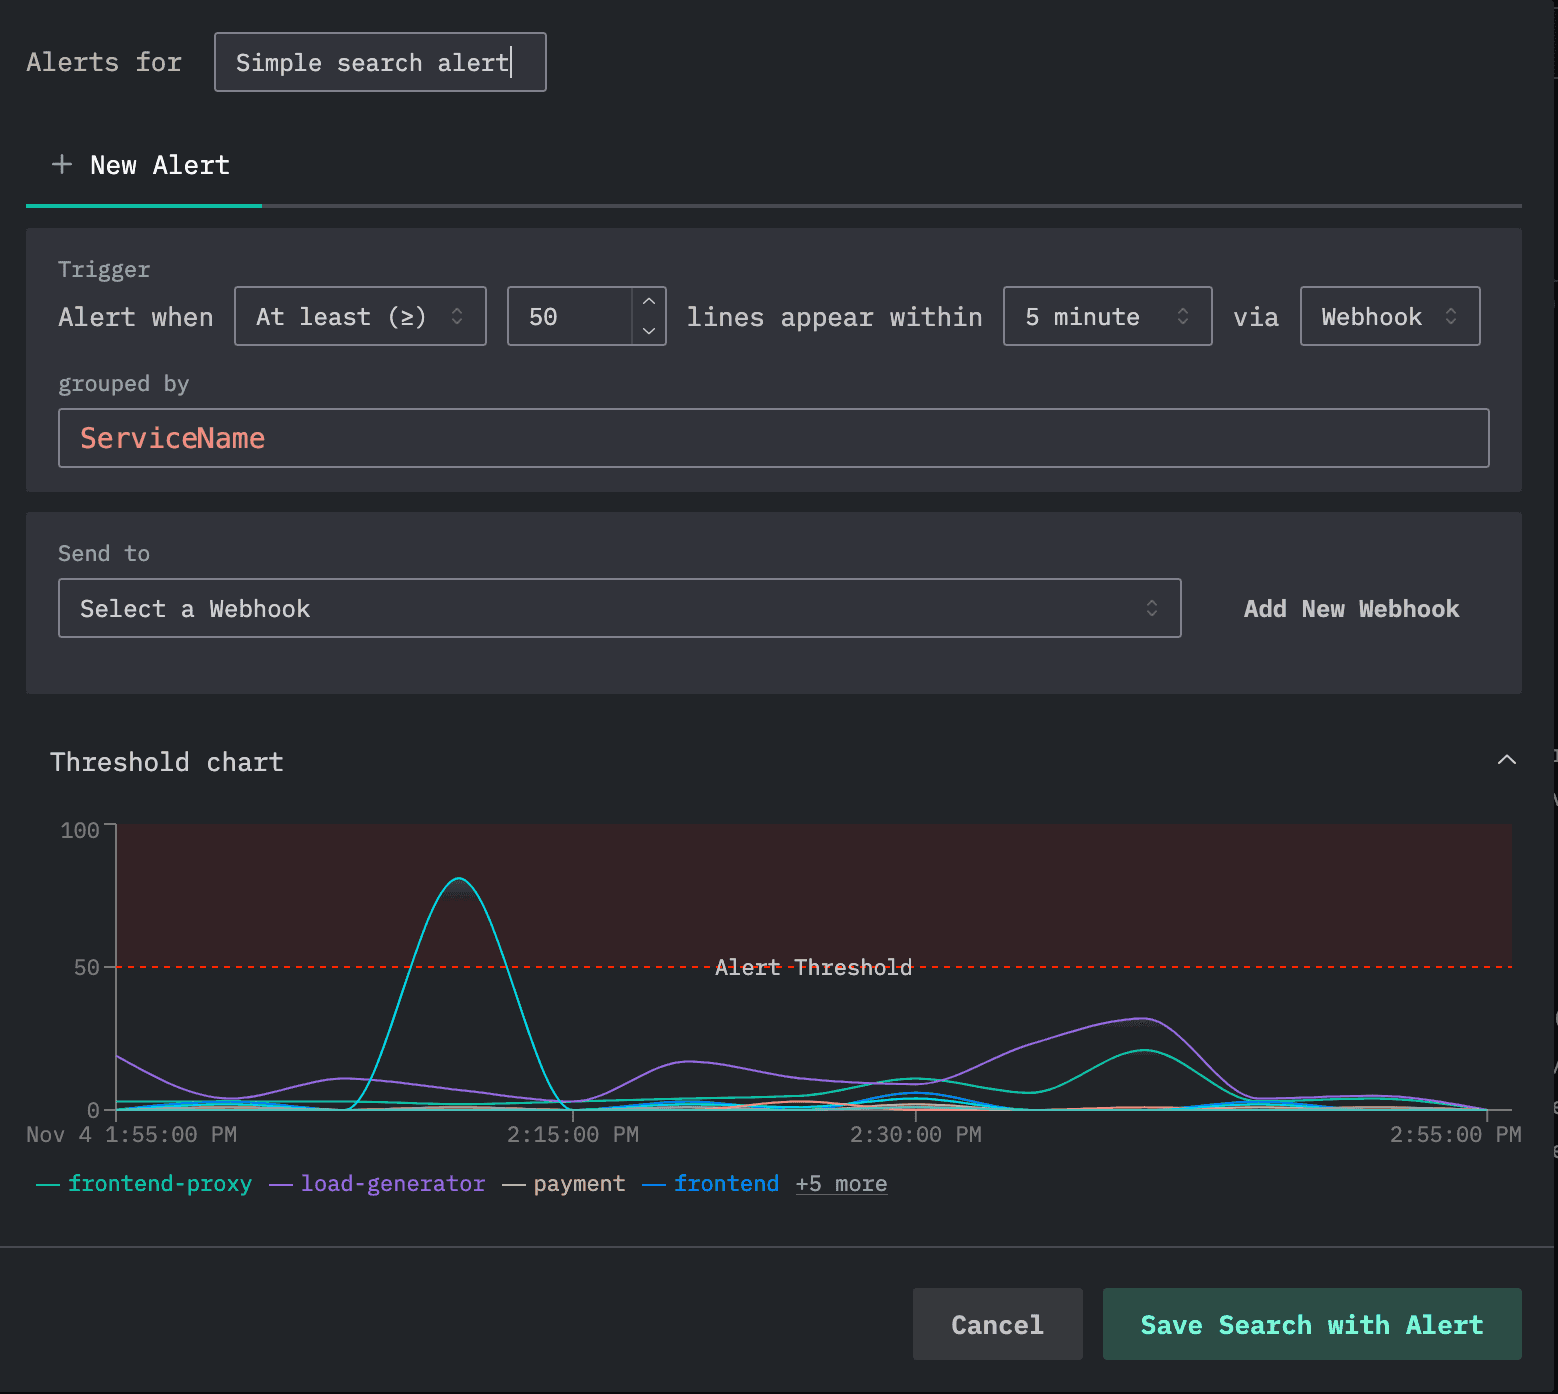
October marked another major milestone with the introduction of threshold based alerting in ClickHouse Cloud. Users can now create alerts directly from either searches or charts, allowing them to monitor latency, error rates, throughput, or any SQL derived metric. The initial release also added built in integrations with PagerDuty and Incident.io along with generic webhooks for custom pipelines. More importantly, this laid the architectural foundation for alerting at serious scale. Alert workloads can run on dedicated compute through ClickHouse Cloud’s read-write separation and compute pool model, which ensures that ingest and analytical queries remain unaffected. It opens the door to thousands of alerts running reliably and independently, with future updates planned to expand to anomaly detection logic with new out-of-the-box destinations.

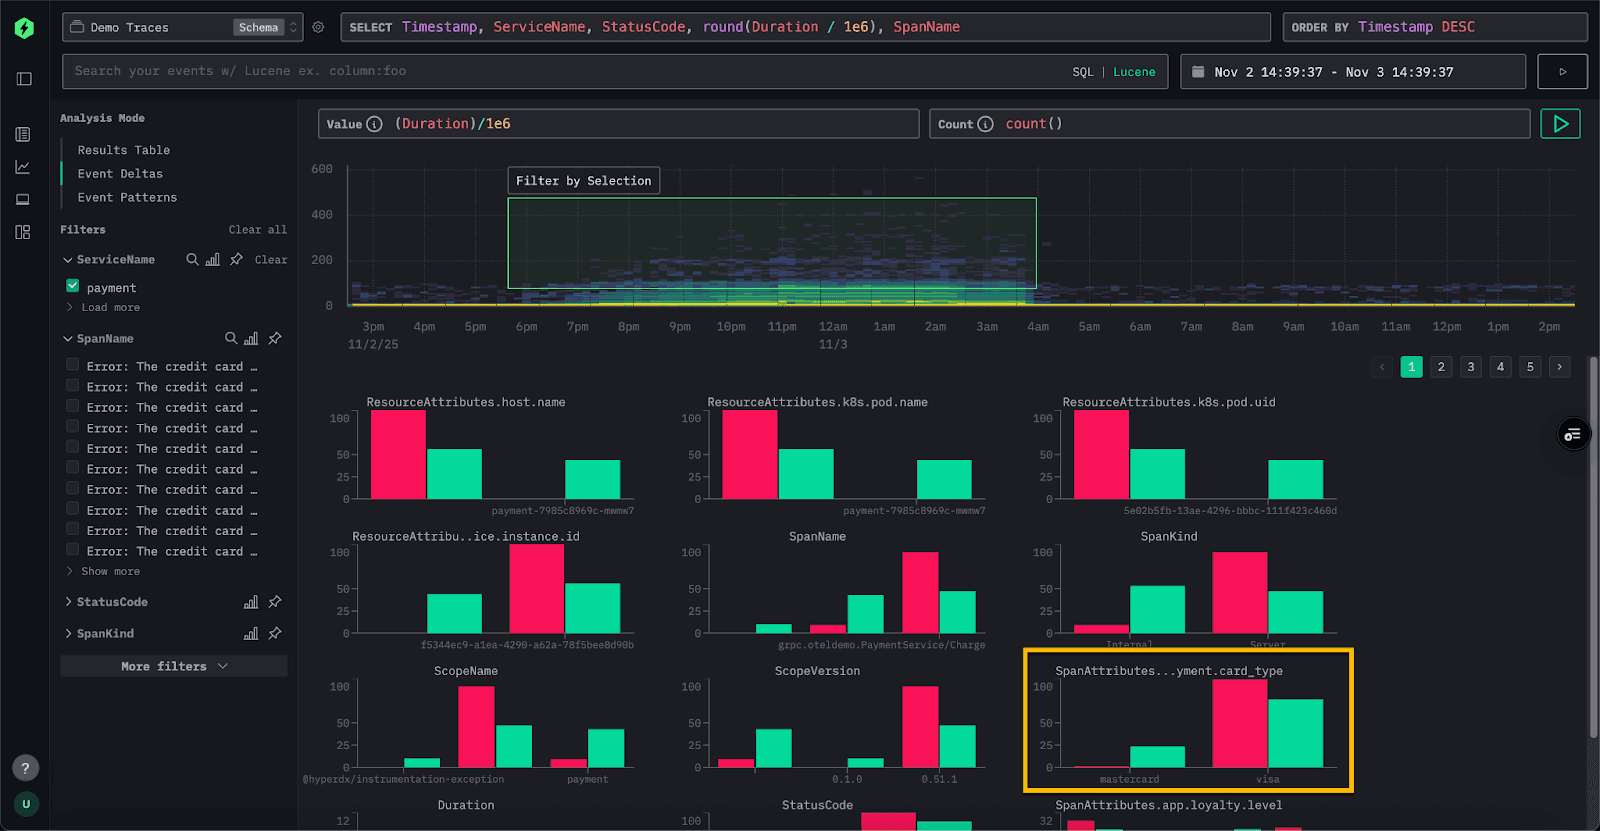
Another highlight of October was the evolution of Event Deltas. Event Deltas have become one of the most distinctive features in ClickStack. At their core, they allow users to select a subset of slow spans, compare them against a baseline population, and automatically surface the attributes and values most associated with the regression. This offers a lightweight form of anomaly detection at query time, rooted in actual distributions rather than heuristics. In October, we made Event Deltas fully configurable. Instead of being limited to span duration, users can now build deltas on any numeric field, such as database latency or queue delay. This makes the feature far more flexible and unlocks entirely new investigative workflows.

We also introduced dashboard filters, a usability improvement that immediately resonated with users - before users had to type filters. Some observability tools require predefined variables to make filters work, adding friction and setup overhead. In ClickStack, dashboard filtering is as simple as choosing a column. The UI automatically determines the correct filter type and renders it inline. The filter then applies to every visualization on the dashboard that shares the same data source. This allows users to slice and refine dashboards naturally, without configuration work or template engineering. October in many ways embodied the ClickStack approach: powerful features, simple workflows, and an experience that keeps getting faster and more intuitive.Finally, September added support for custom aggregations in the UI, letting users tap directly into the full power of ClickHouse’s aggregation engine.
November: What’s New - Service Maps and attribute highlighting
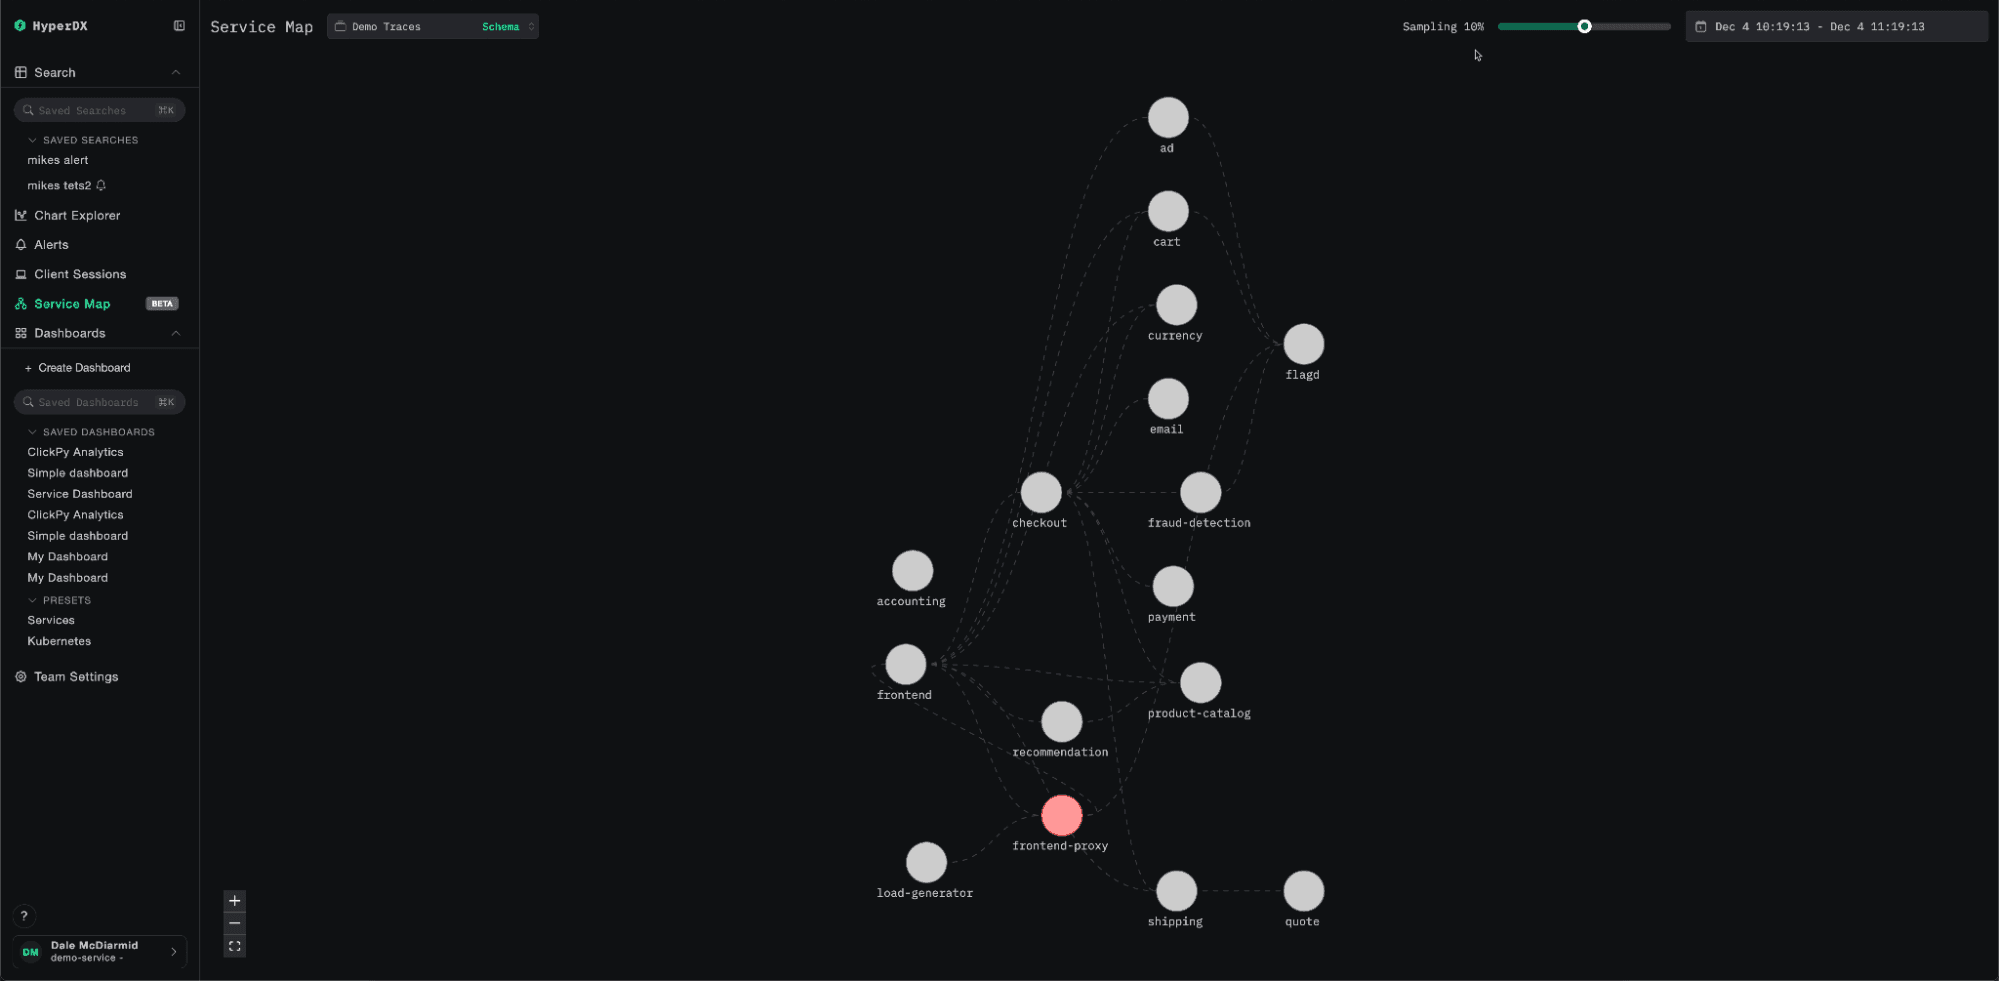
November introduced one of the most anticipated features in ClickStack: Service Maps, now available in beta. Service Maps transform trace data into a visual representation of how services interact, allowing teams to understand traffic flows, dependencies, and failure patterns at a glance. Crucially, ClickStack exposes them not only as a dedicated view but also in context. When users inspect an individual trace, a focused service map appears alongside the waterfall, showing the precise path that request took through the system. While the current beta already delivers valuable insight, we plan to accelerate performance and scalability in early 2026. This includes exploring internal ClickHouse capabilities such as refreshable materialized views to support high volume, real time graph construction.

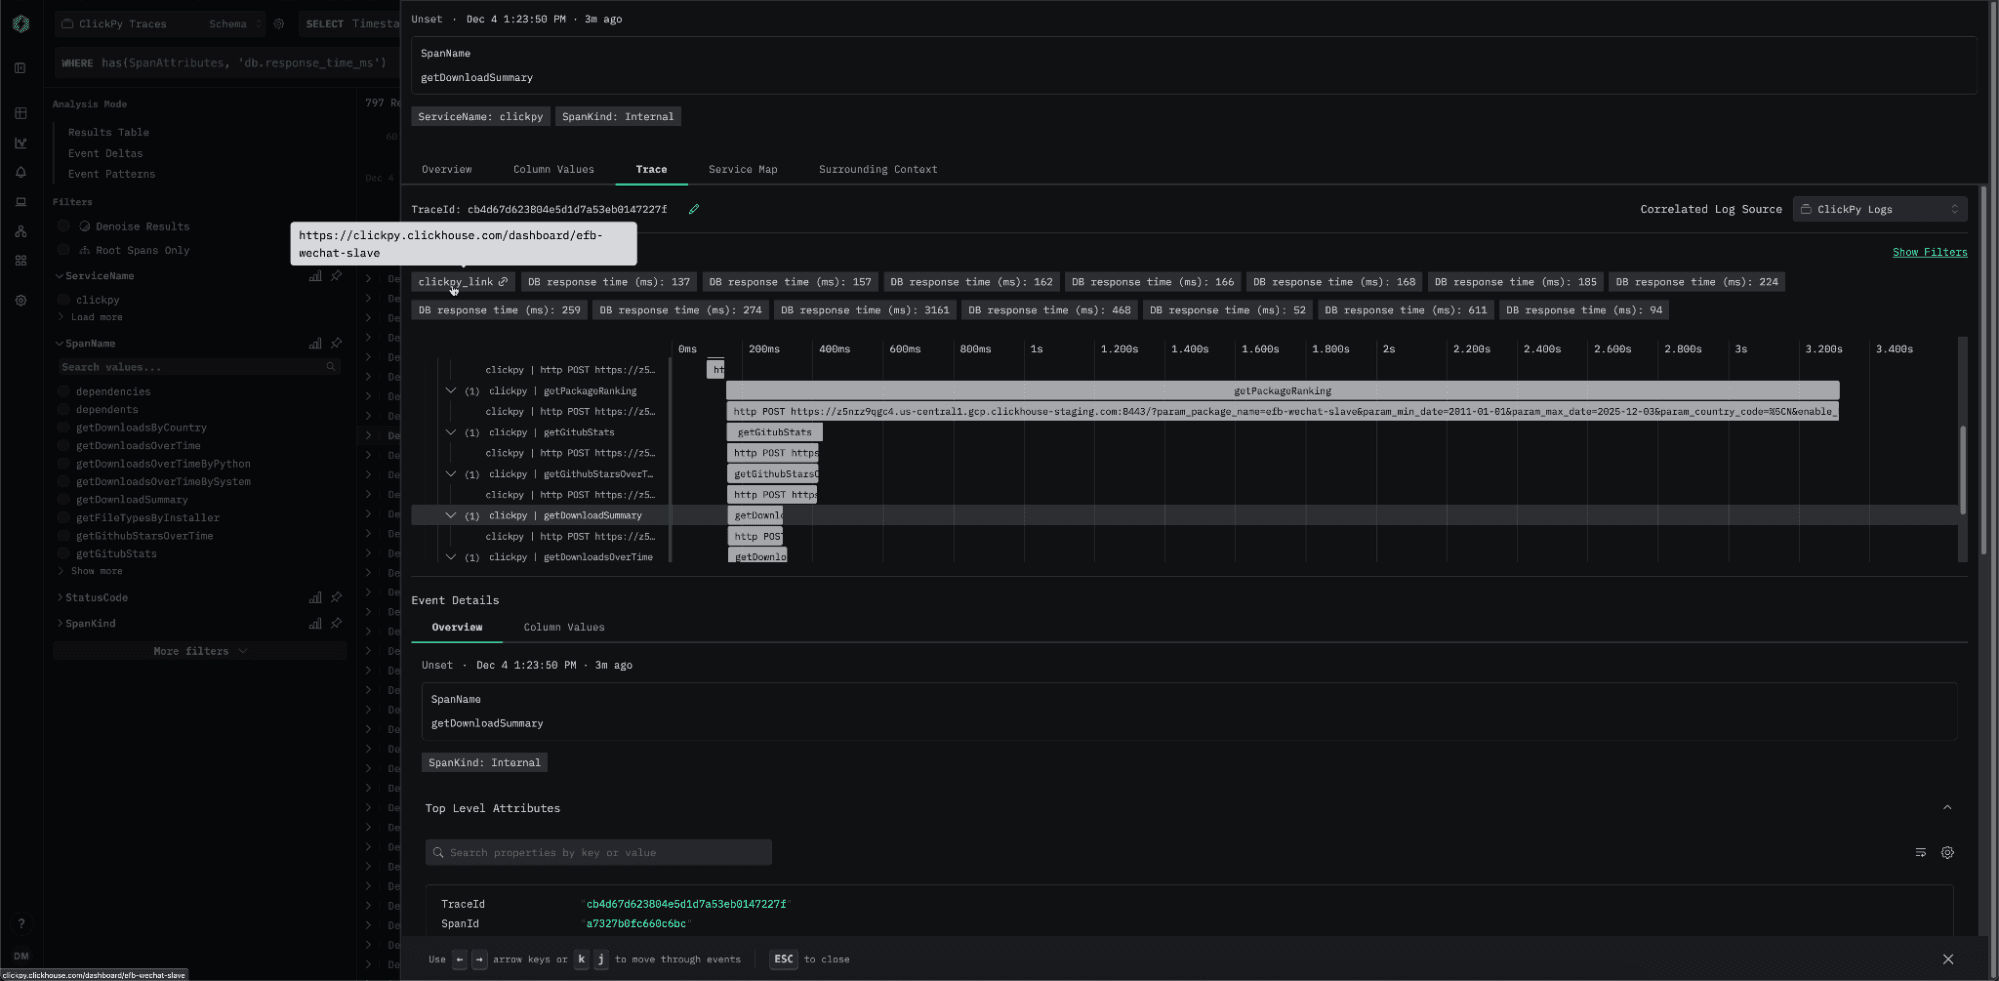
We also introduced configurable attribute highlighting, a lightweight but powerful feature for both logs and traces. Users can now define specific fields to surface automatically when inspecting a span or log entry. These appear immediately in the side panel or trace header, making important identifiers, labels, or metadata visible without searching through full attribute payloads. Highlighted attributes can define custom search expressions and can include automatically detected clickable links. This helps teams build opinionated, domain specific debugging workflows that reflect the unique structure of their telemetry.

Finally, we added line chart comparison, a small feature that quickly became a community favorite. With a single toggle, users can overlay the previous period on any time series chart, making regressions or improvements immediately visible without building separate dashboards or calculating offsets manually. It is a simple addition that dramatically improves exploratory analysis and reinforces our focus on delivering fast, intuitive tooling that shortens the path from data to understanding.
December closed the year with the biggest performance leap yet, the arrival of fully integrated Materialized Views inside ClickStack. While ClickStack had previously allowed users to materialize individual charts, the approach was limited. Any filter or change in grouping pushed the query back to the base table, making performance gains inconsistent. The new design changes everything. Users can now create Incremental Materialized Views directly in ClickHouse, register them with a source, and let ClickStack’s query layer automatically select the most efficient view for each query. The system understands each view’s time granularity, available dimensions, and exposed metrics. At query time, it uses ClickHouse’s EXPLAIN ESTIMATE to determine which candidate view scans the fewest granules. This allows any query in HyperDX - searches, dashboards, histogram views, and charts - to be accelerated at scale with no additional work from the user.
This is more than a performance enhancement. It represents a new scalability tier for ClickStack. Incremental Materialized Views compute only changes as data arrives, shifting small amounts of work to ingestion while drastically reducing query depth for downstream workflows. As a result, deployments can maintain near real time responsiveness even at very large volumes. This feature remains in beta, and we plan to refine it through early 2026, including smarter view selection and future support for automatically generated views based on user access patterns. Ending the year with Materialized Views sets the foundation for a new class of performance optimization across the stack, and one of the clearest demonstrations of how ClickStack continues to evolve by using the full power of ClickHouse’s engine.
As we look ahead to 2026, we are focused on making ClickStack the de facto open-source stack for teams operating OpenTelemetry at scale. Many of this year’s foundations from JSON support to Materialized Views will continue to unlock new performance and workflow improvements across the stack. In early 2026, we plan to build directly on these capabilities to deliver even faster dashboards, searches, and histograms for high volume environments.
Two of the most requested features from customers, RBAC and audit logging, are also on the way. RBAC will allow administrators to create and manage roles directly inside ClickStack, bringing enterprise grade access control to the full observability workflow. Audit logs will bring better visibility into usage and change tracking, a key requirement for regulated environments and organizations operating at scale.
We are also investing heavily in new analysis experiences. An AI powered notebook experience will likely be released in private preview with select users and will offer a streamlined way to explore data, generate queries, and combine observability and analytics in the same workspace. Anomaly detection for alerts remains a major priority with the aim to augment threshold based alerting with statistical based models that reduce noise and help teams catch regressions earlier.
Integration work will continue to accelerate. You can expect a growing catalog of pre-built dashboards, tighter getting started guides, and simplified ingestion paths for common environments. We are particularly focused on CSP integrations, such as CloudWatch, and making it easier than ever to pull data from Kafka with minimal configuration. Longer term, we plan to improve our support for Prometheus style metrics, including the upcoming developments in PromQL inside ClickHouse.
But the most significant milestone on the horizon is the shift toward a fully managed ClickStack offering in ClickHouse Cloud. Teams will simply send telemetry and get a complete, continuously optimized observability experience powered by ClickStack. It is an ambitious step, but it represents the natural evolution of the platform and the culmination of the vision we started in May - observability that is fast, scalable, open, and effortless to adopt.
Finally, happy new year to all our readers and we look forward to meeting you in events and online in 2026.

