Announcing ClickStack #
Today we’re excited to announce ClickStack, a new open-source observability solution built on ClickHouse. ClickStack delivers a complete, out-of-the-box experience for logs, metrics, traces, and session replay - powered by the performance and efficiency of ClickHouse, but designed as a full observability stack that’s open, accessible, and ready for everyone.
Start your journey with ClickStack by checking out our Getting Started guide in the docs.
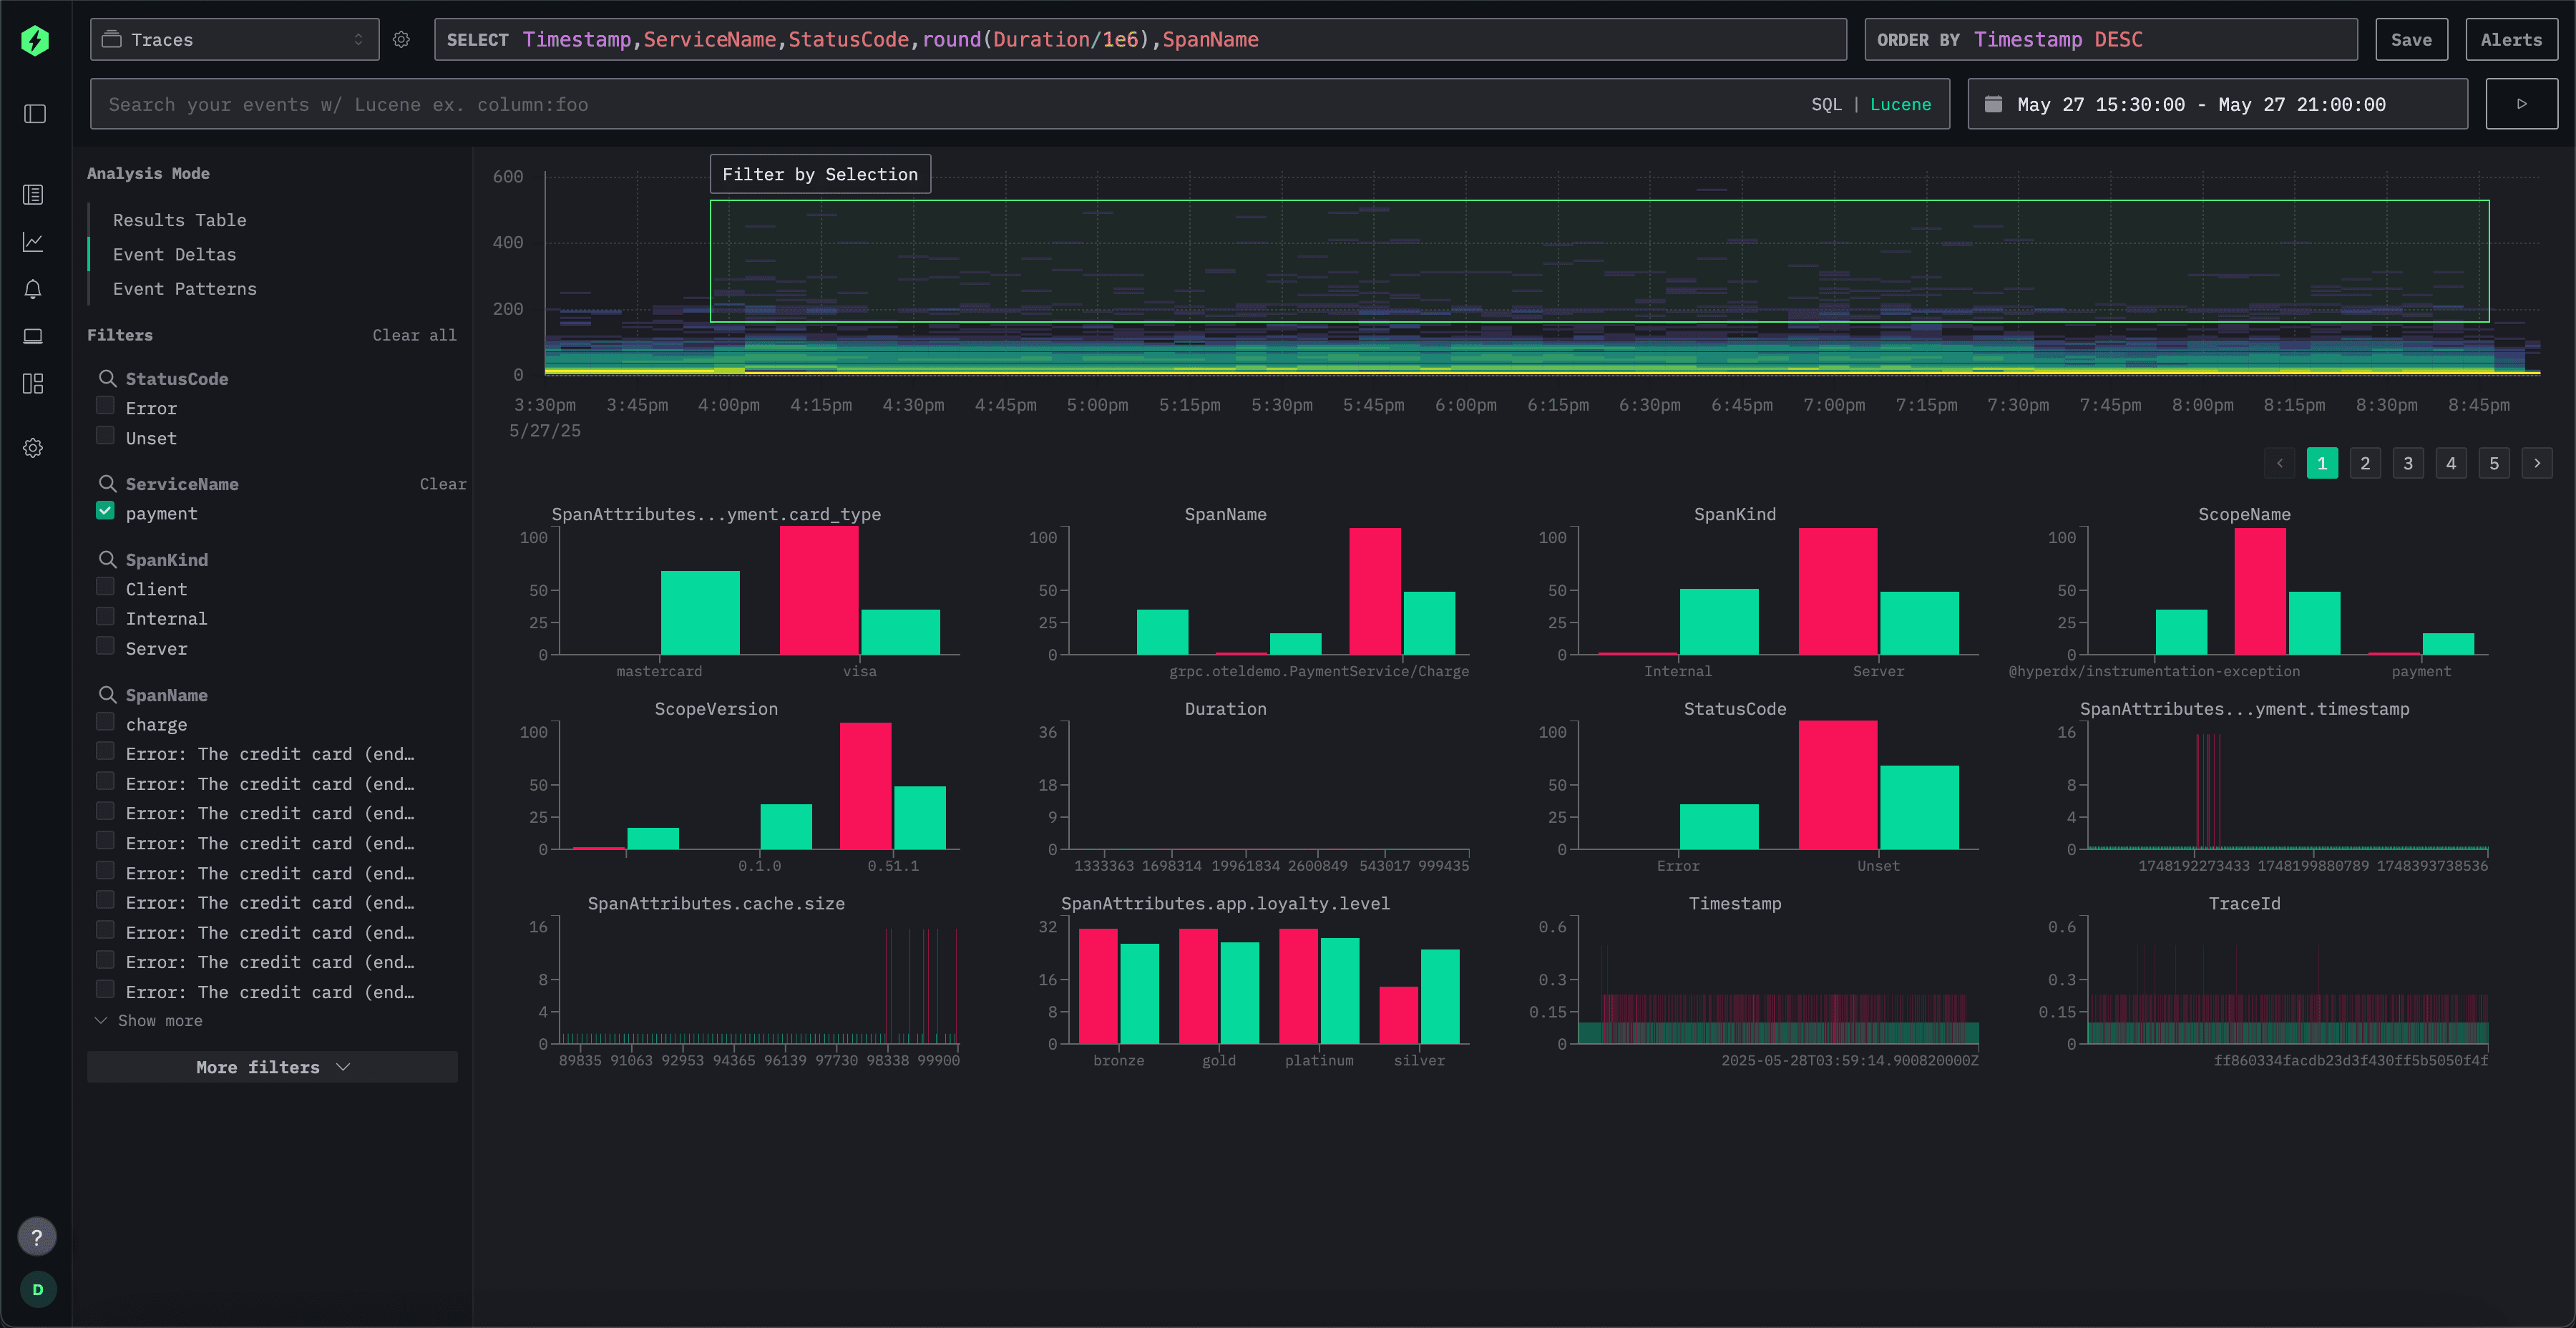
For years, engineering teams at scale such as Netflix and eBay have turned to ClickHouse as the database of choice for observability. Its column-oriented design, compression, and high-throughput vectorized query engine made it ideal for storing wide events- context-rich, high-cardinality records that unify logs, metrics, and traces. This modern Observability approach (some have called this "Observability 2.0"), breaks away from the traditional "three pillars" model and eliminates the complexity of stitching together siloed telemetry sources.
Until now, the full benefits of this model were mostly only realized by teams with the resources to build bespoke observability experiences on top of ClickHouse. Everyone else? They relied on general-purpose visualization tools or third-party proprietary platforms built on ClickHouse. While these tools provided basic interfaces for ClickHouse, they sometimes required long SQL queries for routine observability tasks or didn't fully utilize ClickHouse's performance capabilities and open architecture.
That changes today. With the release of ClickStack, powered by HyperDX, we’re leveling the playing field. This fully open-source stack includes an out-of-the-box OpenTelemetry collector, a UI designed for wide events, natural language querying, session replay, alerting, and more.
And it all runs on the same high-performance, high-compression ClickHouse engine trusted by the biggest names in observability.
Try ClickStack today #
Getting started with the world’s fastest and most scalable open source observability stack, just takes one command.
Before this, teams were often forced to choose between expensive closed-source SaaS products or piecing together open-source alternatives. Before this, teams were often forced to choose between expensive closed-source SaaS products or piecing together open-source alternatives, a common challenge when evaluating OpenTelemetry compatible platforms. Search engines offered fast, flexible querying, but operating them at scale and achieving fast aggregation performance proved challenging. Metrics stores offered better aggregation performance but required rigid pre-aggregation and lacked deep search capabilities. Neither approach handled high-cardinality data well, and stitching them together added complexity without solving the core problem—a frequent bottleneck when mastering Kubernetes observability.
With ClickStack, you don’t have to choose - enjoy fast search and fast aggregations over high-cardinality, wide event data. At scale. Open source. And now, for everyone.
The evolution of ClickHouse for Observability #
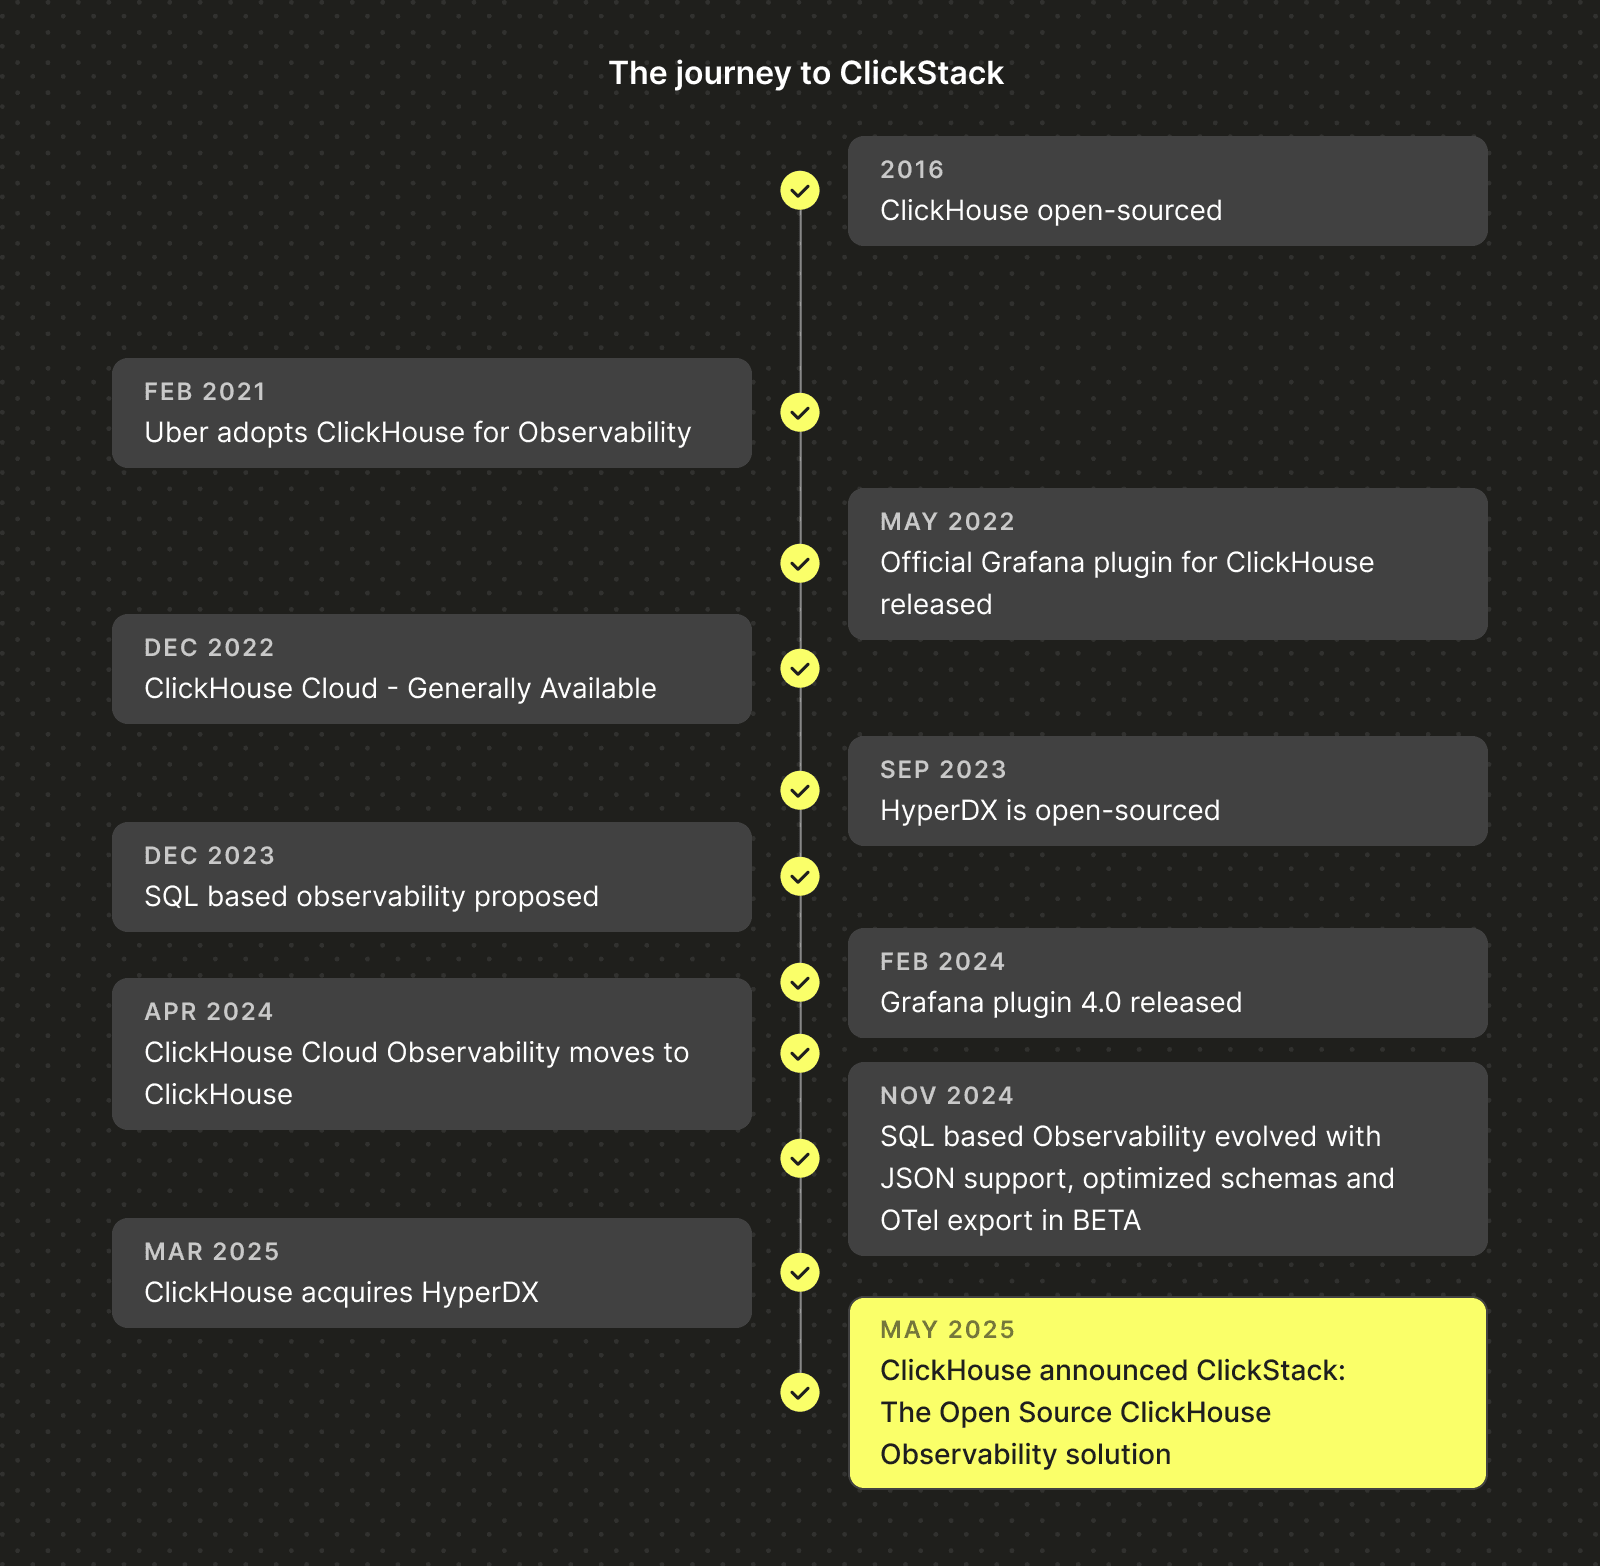
Just another data problem #
Early adopters of ClickHouse recognized something fundamental: observability is a data problem. The database you choose defines the cost, scale, and capabilities of your observability platform - which is why selecting the right database for time-series data is often the most important architectural decision when building in-house or starting an observability company.
This is exactly why ClickHouse has been at the core of observability stacks for years. From industry giants like Netflix and eBay to observability startups like Sentry and Dash0, ClickHouse powers logs, metrics, and traces at a massive scale. Its column-oriented storage, aggressive compression, and vectorized execution engine dramatically reduce costs and deliver the sub-second queries engineers need to debug live systems without waiting on slow tooling.
Get started with ClickStack #
Ready to explore the world's fastest and most scalable open source observability stack? Start locally in seconds.
All you need is wide events…and a column store #
In our earlier post "The State of SQL-Based Observability" and subsequent follow-ups, we explored this trend in depth - though we didn't name it at the time, it aligns perfectly with today's Observability 2.0 movement: a unified model built around wide events, not pillars. For too long, teams relied on separate stores for logs, metrics, and traces, which led to fragmentation, manual correlation, and unnecessary complexity. Wide events eliminate these silos by consolidating all observability signals into a single, queryable structure.
A wide event captures the full application context in a single record - user, service, HTTP path, status code, cache result, and more. This unified structure is key to eliminating silos and enabling fast search and aggregation across high-cardinality data - provided you have a storage engine that can compress and store it efficiently!
While No-SQL solutions, such as search engines, embraced this structure they lacked the aggregation performance to deliver on the promise - great for search and "finding needles in galaxies", less so if you want to aggregate across wide ranges. ClickHouse's secret sauce to this problem remains unchanged: columnar storage, a rich codec library for deep compression, and a massively parallel engine optimized for analytical workloads.
Resource efficient and scalable #
In ClickHouse Cloud we went further and embraced object storage to deliver separation of storage and compute, essential if you're needing to scale your observability to PB and beyond and need to scale elastically. To support even more demanding use cases, we also introduced compute-compute separation allowing users to dedicate compute to specific workloads while reading from the same data e.g. ingest and querying.
As observability needs became more complex, we recognized that native JSON support for semi-structured events was table stakes. ClickHouse evolved to meet this need, adding first-class support for semi-structured data while preserving the benefits of column-oriented processing. Columns are auto-created as data arrives, and ClickHouse manages type promotion and column growth automatically. It's the schema-on-write you need for observability with the performance, compression, and flexibility expected from a modern analytical engine.
The rise of OpenTelemetry #
This evolution coincided with the rise of OpenTelemetry (OTel), now the de facto standard for collecting telemetry across logs, metrics, and traces. We began officially supporting and contributing to the OpenTelemetry Exporter for ClickHouse.
OpenTelemetry has been a major unlock for our ecosystem. It offers a standardized, vendor-neutral way to collect and export observability data, and the Collector can be configured to send data directly into ClickHouse using the exporter we now help maintain. We've worked closely with the community to ensure the exporter is robust, scalable, and aligned with the core principles of ClickHouse.
One of the hardest problems we tackled early was schema design. There's no one-size-fits-all schema for observability; every team has different query patterns, retention needs, and service architectures. So, the exporter ships with default schemas for logs, metrics, and traces that work well for most users, but we encourage teams to customize based on their own workloads.
What was missing from existing ClickHouse observability solutions? #
But as we quickly learned, just having a great database, good schema, and robust means of collecting and ingesting isn’t enough. Engineers need turnkey ingestion, visualization, alerting, and a UI that’s tailored to their workflow. Until now, that meant relying on OpenTelemetry for collection and Grafana for dashboards.
This worked well enough - even ourown observability team replaced Datadog with a ClickHouse-based stack, saving millions and achieving over a 200x cost reduction. Today, our internal logging system stores more than 43 petabytes of OpenTelemetry data, with schemas and primary keys tuned specifically for that scale. It proved the performance and cost-efficiency of the approach - but we knew the experience could be simpler.
We wanted something more opinionated. An easier way for users to get started. But most importantly, a UI built for ClickHouse. And not just any UI, but one that understands how to construct efficient queries, surface patterns in wide events, and deliver an exceptional user experience without hiding the power of the database underneath.
Finally, while we believe SQL-based observability has played an important role in reinforcing the wide event model, we also knew we had to meet users where they were. Search engines like the ELK stack succeeded because they offered something intuitive: a natural language for querying logs. We wanted that experience for our users, but powered by ClickHouse.
Welcome HyperDX #
That’s when we found HyperDX, an open-source observability layer purpose-built on ClickHouse. When HyperDX open-sourced their v2 UI in late 2024, we tested it internally and quickly realized this was the missing piece. The setup was seamless, the developer experience was excellent, and we knew our users deserved the same.
HyperDX brought everything we were looking for:
- Standards-based data collection: HyperDX embraced OpenTelemetry from day one, aligning perfectly with our investment in the ClickHouse OpenTelemetry exporter.
- Open-source first: We believe robust observability tooling should be available to everyone, and HyperDX shares that philosophy. Its cloud-native design makes for a simple, cost-effective operational experience.
Beyond standards compliance, HyperDX is built with ClickHouse in mind. The team takes query optimization seriously, so you don’t have to. The UI is tightly coupled to the engine, ensuring fast, reliable performance where milliseconds matter, especially during incident investigations.
Combined with a built-in OpenTelemetry collector ingress and a schema optimized for the HyperDX UI, ClickStack brings together ingestion, storage, and visualization in a unified experience. The default schema is designed to just work out of the box, so users don’t need to think about it - unless they want to customize it for their specific needs.
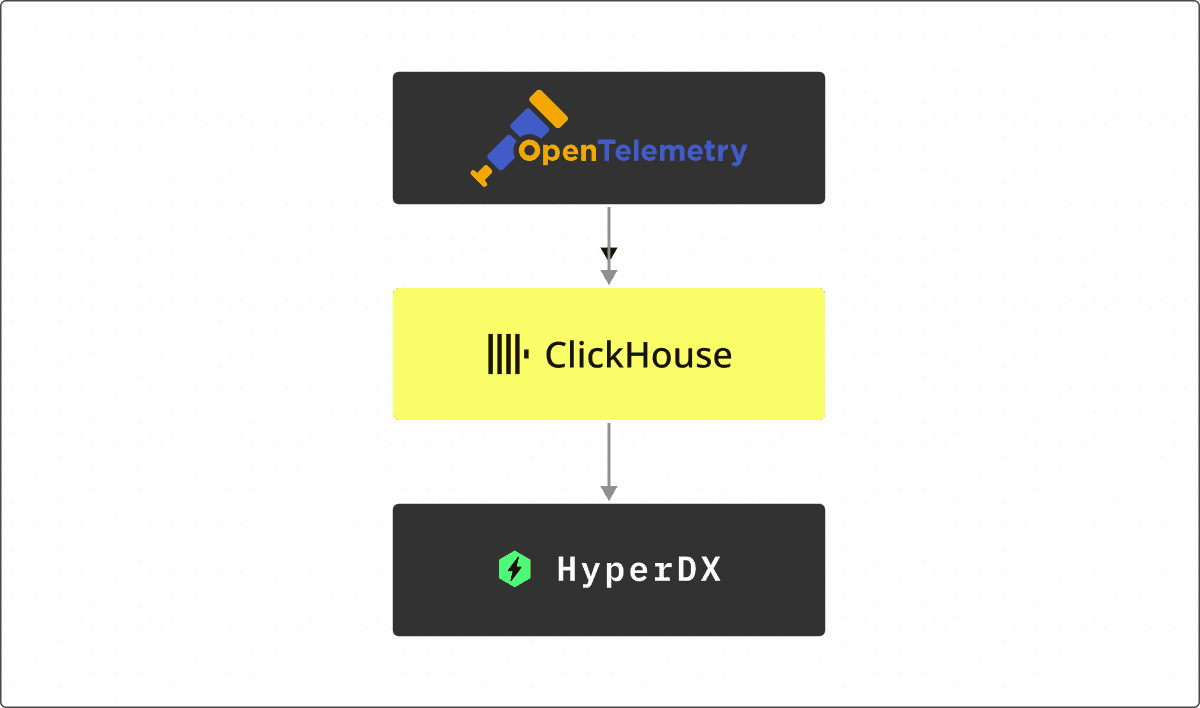
The simplicity of ClickStack means that each layer scales independently. Need higher ingestion throughput? Just add more OpenTelemetry collector gateways. Need more query or storage capacity? Scale ClickHouse directly. This modular design makes it easy to grow with your data and your team - without overhauling the stack.
Since acquiring HyperDX, we’ve focused on simplifying the product and expanding its flexibility. You can use the default schema for a seamless out-of-the-box setup or bring your own schema tailored to your needs. Just like with ClickHouse itself, we recognize that one size never fits all, and flexibility is key to scale.
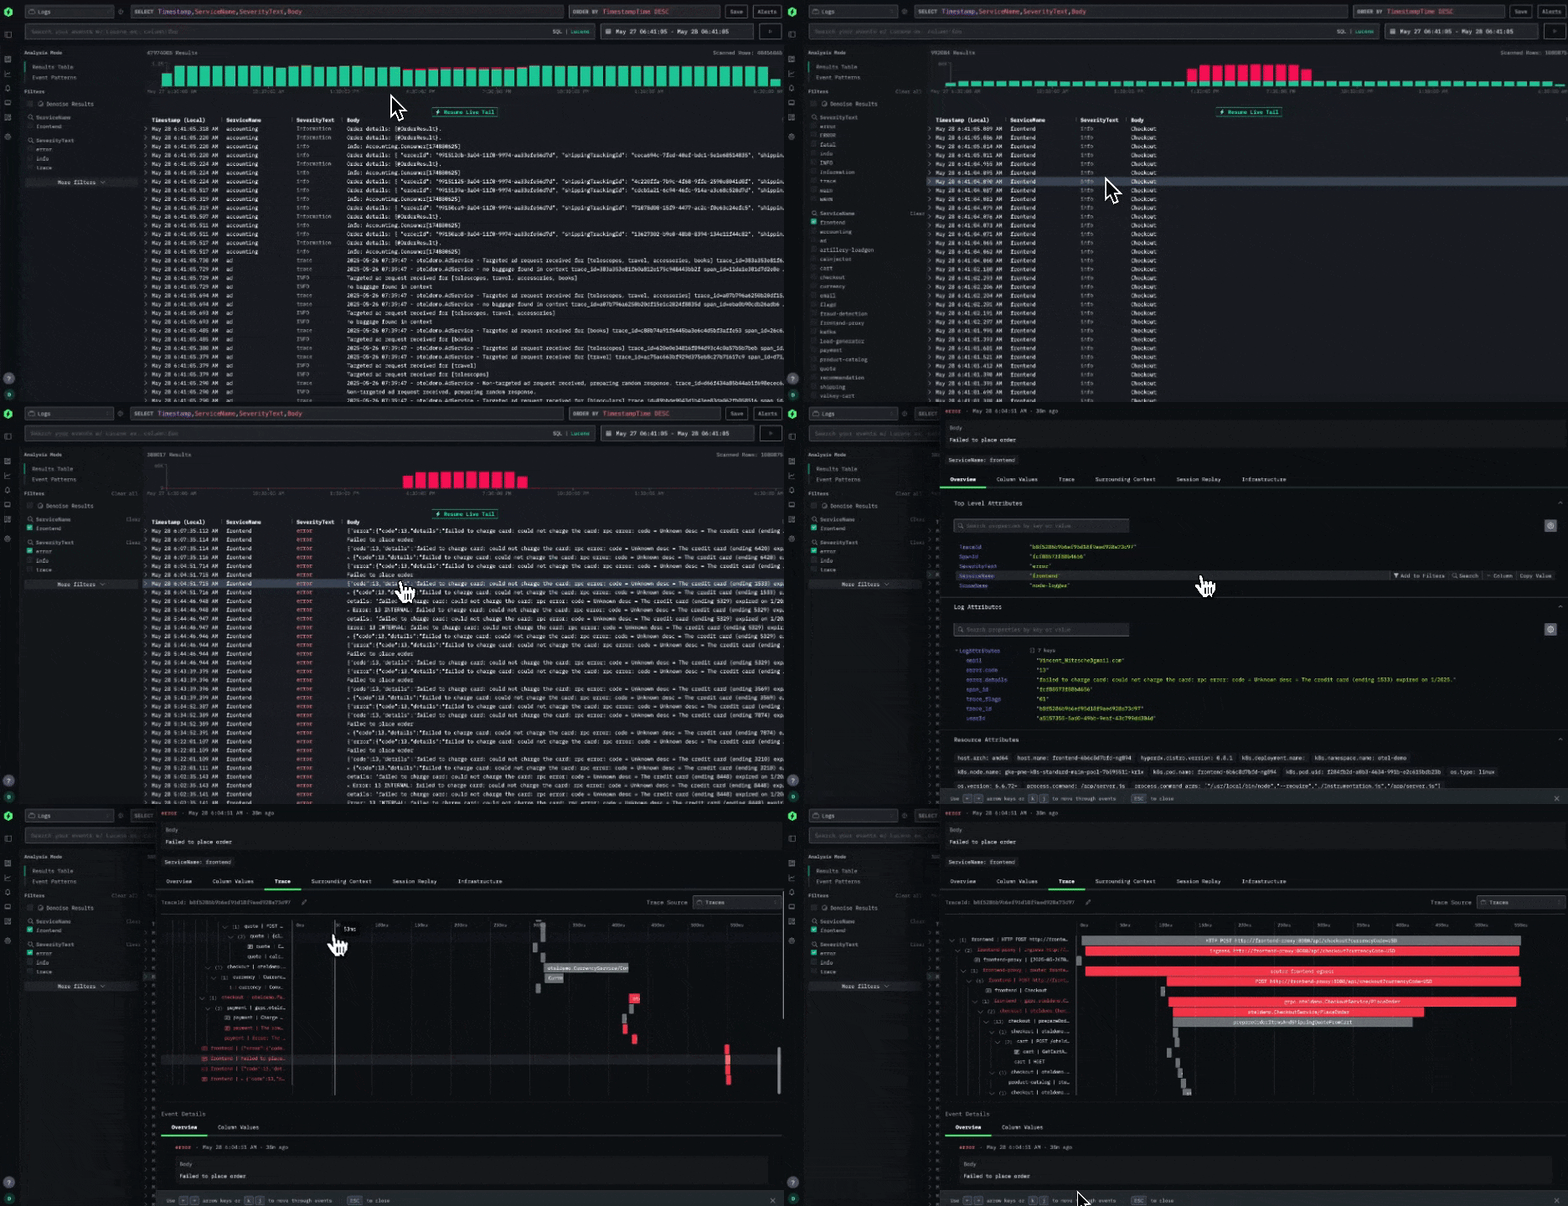
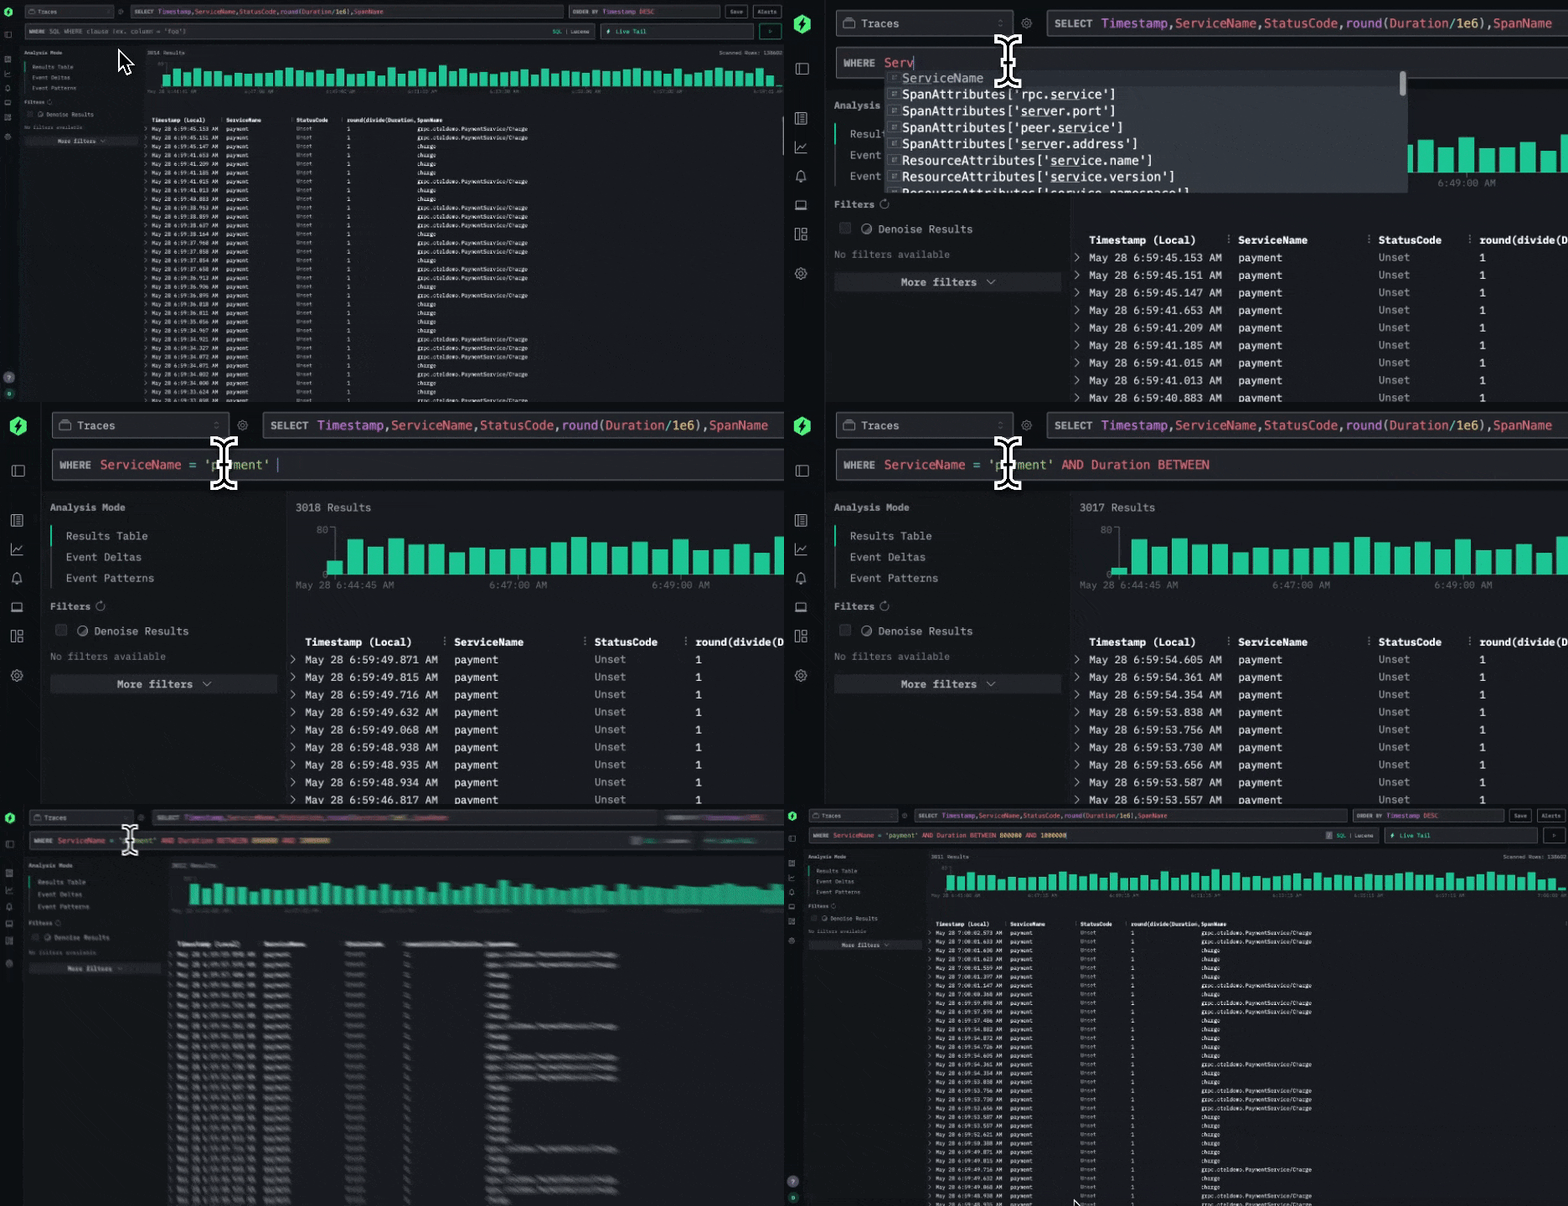
At the same time, we’ve stayed true to our SQL roots. SQL remains the lingua franca of data, and for many ClickHouse power users, it’s still the most expressive and efficient way to explore data. That’s why the HyperDX UI includes support for native SQL queries, giving advanced users direct access to the engine without compromise.
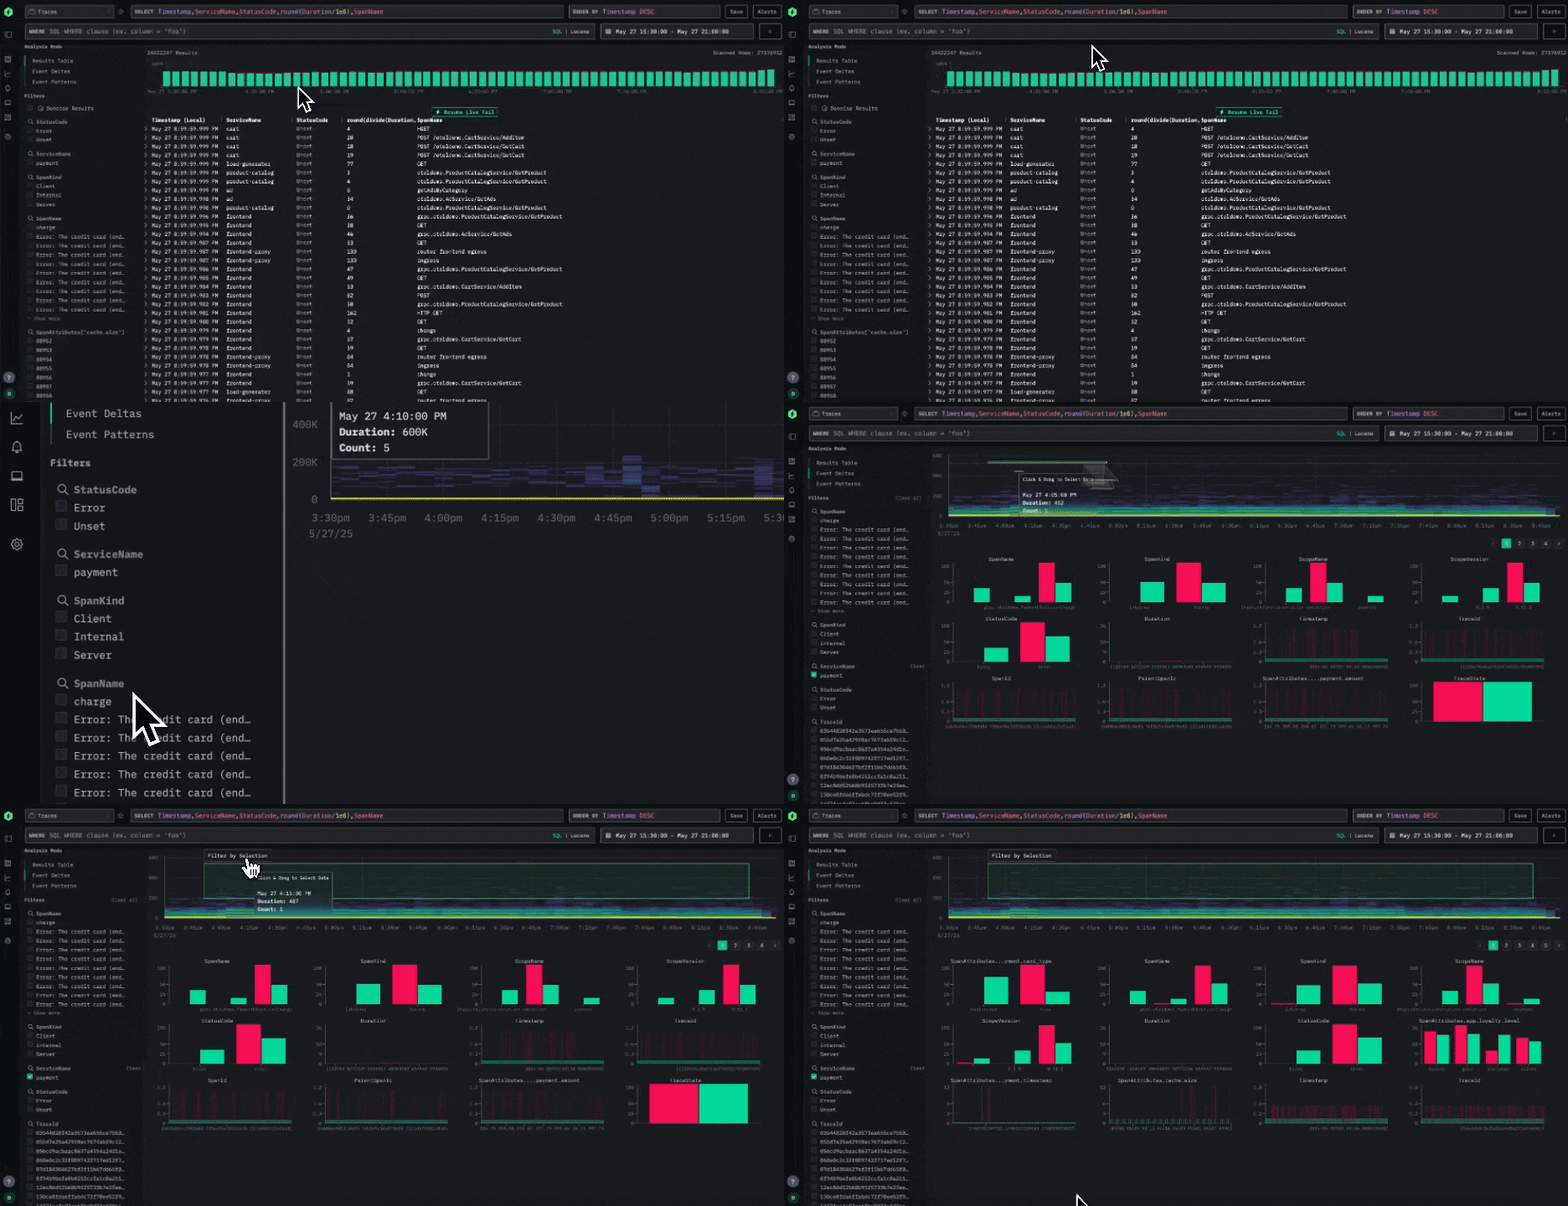
We've also introduced new features to make debugging and exploration easier. One example is event deltas, which help users quickly identify anomalies and performance regressions. By sampling data across unique values of a given attribute, the UI surfaces performance differences and deviations, making it easier to understand what changed and why.
Perhaps most importantly, the stack is now simpler. With OpenTelemetry emerging as the ubiquitous standard, all data is now ingested through an OTel collector. The default setup uses an opinionated schema designed for quick adoption, but users can modify or extend the schema as needed. The stack is OpenTelemetry-native but not OpenTelemetry-exclusive, thanks to the open schema, HyperDX can work with your existing data pipelines and schemas as well.
Conclusion & Looking Forward #
ClickStack represents the next evolution in ClickHouse's increased investment in the observability ecosystem, delivering an intuitive and opinionated full-stack experience powered by open source and open standards. By unifying ClickHouse's high-performance columnar engine, OpenTelemetry's instrumentation standards, and HyperDX's purpose-built UI into a cohesive solution, we're finally making the modern observability approach accessible to everyone.
Our commitment to open source ensures ClickStack remains accessible to everyone—from single-service deployments to multi-petabyte systems. We’ll continue to invest in both the core database for high performance observability while continuing to invest in integrations with established tools like Grafana, ensuring seamless interoperability with existing observability stacks.
With ClickStack, we deliver more than just another tool - we provide a unified foundation where all telemetry signals converge in a high-performance columnar database, complete with natural language querying, session replay, and alerting capabilities right out of the box.
Start your journey with ClickStack by checking out our Getting Started guide in the docs.


