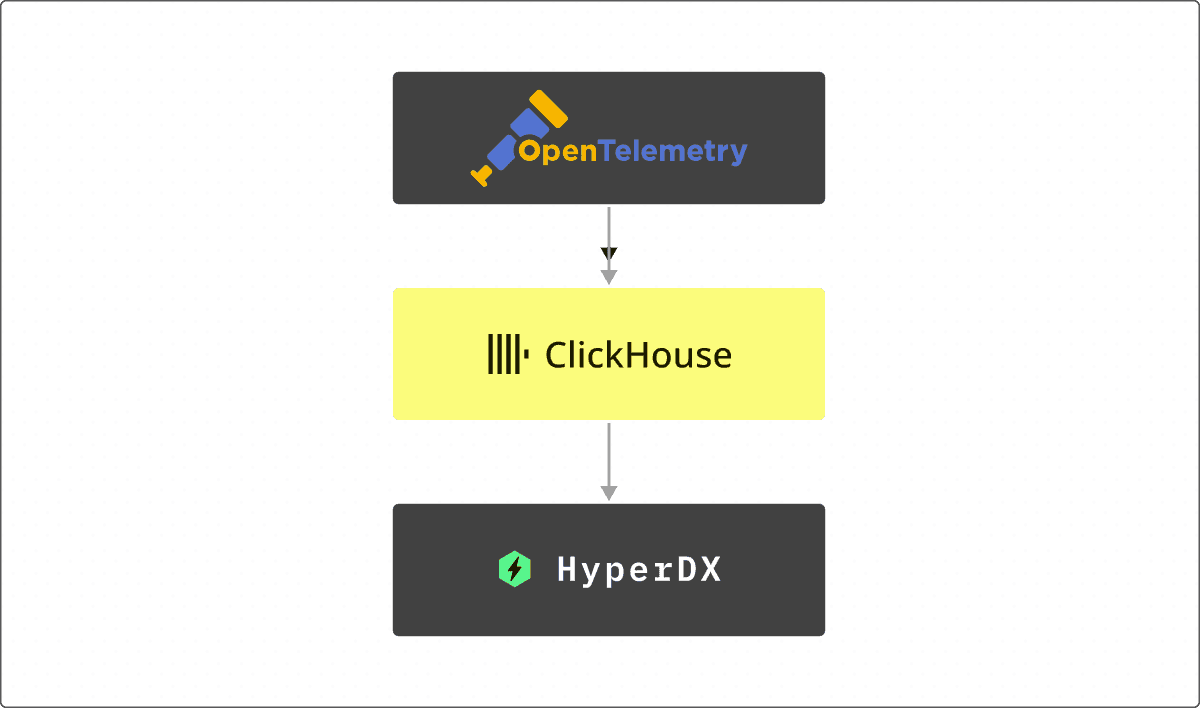
Earlier this month, we announced ClickStack, an open-source observability stack built on ClickHouse that makes it easier than ever to unify logs, metrics, traces, and session replay - all powered by the same high-performance engine trusted by leaders like Netflix and eBay.
One of the biggest benefits of ClickStack is how it brings together fast search and fast aggregations over high-cardinality, wide event data, in a single, open source, cost efficient solution. By embracing OpenTelemetry for data collection and HyperDX as the UI layer, ClickStack delivers a complete out-of-the-box observability experience, from ingest to powerful visual exploration.
A month is a long time in ClickHouse. Since that first release, we’ve been hard at work adding new features and enhancements to make ClickStack even more powerful and easier to use. Starting this month, we’ll be sharing regular updates on what’s new, so you can quickly take advantage of the latest improvements in your own ClickStack deployments.
Contributors #
First, we’d like to recognize our new open source contributors this month. Building an open source stack takes a community, and we want to acknowledge the efforts of the individuals who contributed to ClickStack - whether through the OpenTelemetry collector, the Helm chart, or HyperDX. Your work is greatly appreciated.
Huynguyen-anduin, OhJuhun, mGolestan98
ClickStack supports the JSON type for faster queries #
The biggest update to ClickStack this month is simple - but transformative. We’re adding beta support for the native JSON column type in ClickStack. This unlocks a whole new level of scalability, performance, and compression for observability workloads on ClickHouse - with queries now upto 9x faster over the Map type in our tests.
Try ClickStack today #
Getting started with the world’s fastest and most scalable open source observability stack, just takes one command.
Why is JSON support needed? #
Users building observability solutions need to simply be able to “send events” without worrying about rigid schemas. In practice, observability data comes from many sources - different apps, teams, or even organizations, each with its own evolving structure. While standards like structured logging and OpenTelemetry help, teams still need to capture arbitrary tags and fields that vary widely in number, type, and nesting.
Until now, ClickStack schemas for OpenTelemetry data relied on the Map type to handle the columns like LogAttributes, ResourceAttributes, and SpanAttributes which contain dynamic attributes. While this approach worked, it came with real trade-offs:
-
Loss of type precision: Map keys and values were stored as strings, forcing everything into a single type. This means numeric comparisons needed query-time casts, adding verbosity, increasing latency, and consuming more memory.
-
Linear scans on a single column: All JSON paths live in one column when using the Map type, so reading a single key requires loading and scanning the entire map. This leads to unnecessary I/O, especially with many keys, slowing down queries. To work around this, users would pre-extract values into materialized columns.
-
No native nesting: While the Map type handled primitive values reasonably well (despite loss of precision), it struggled even more with nested maps and arrays, since everything was coerced into a String. Complex data had to be serialized as JSON strings, leading to awkward and inefficient querying. For example, take this
LogAttributesstructure:{ "service.name": "user-service", "service.version": "1.2.3", "http.status_code": "200", "user.preferences": "{\"theme\":\"dark\",\"notifications\":{\"email\":true,\"push\":false}}", "error.stack": "[\"AuthError: Invalid token\",\" at validateToken (auth.js:45)\",\" at middleware (app.js:23)\"]" }
Notice how the primitive values like service.name and http.status_code are stored naturally (although lose their type, preventing numeric or date operations), but complex nested data like user.preferences and error.stack are stringified JSON, making them difficult to query and analyze. If we wanted to get a Bool out of the user.preferences key, we would need to use JSONExtractBool on the Map's String value.
SELECT JSONExtractBool(LogAttributes['user.preferences'], 'notifications', 'email')
With the new JSON type, GA in ClickHouse 25.3, ClickStack can now ingest and store truly semi-structured data natively. Each unique JSON path is stored in its own sub-column, preserving types, reducing I/O, and dramatically improving query performance. Even deeply nested or evolving schemas are handled efficiently.
For a high-level look at how the JSON type works for observability, check out this post from last year. If you’re interested in the deeper implementation details, we also covered them extensively in our original release blog.
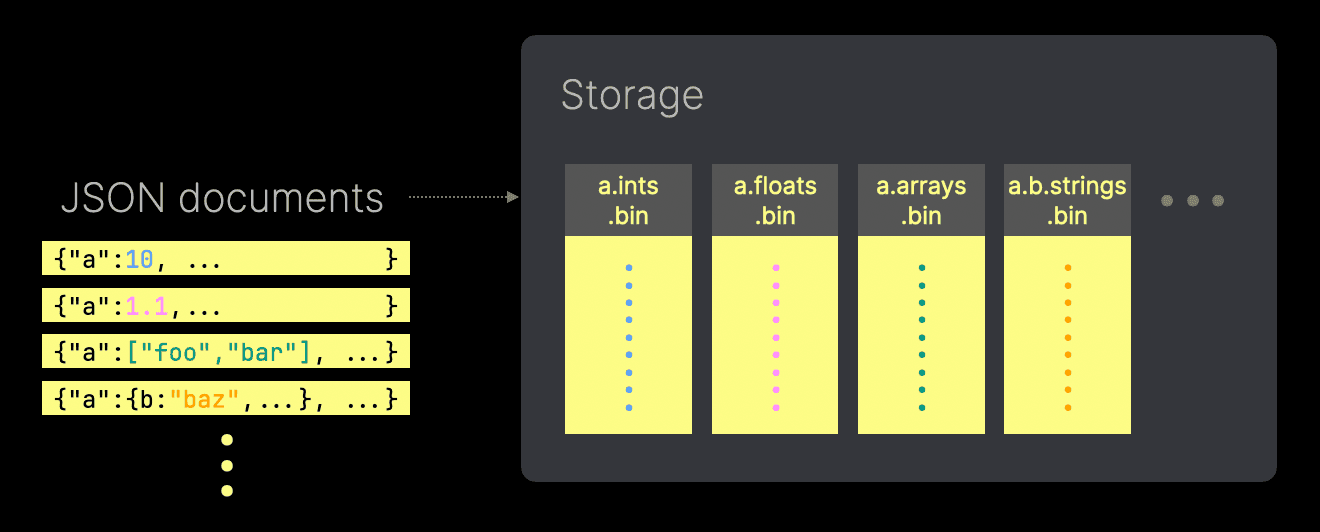
This means you can send enriched logs, traces, and metrics from OpenTelemetry collectors into ClickStack without worrying about rigid schemas or manual flattening. HyperDX, ClickStack’s UI layer, takes full advantage of this by offering smarter filtering, auto-complete for JSON paths, and more responsive searches and visualizations.
Consider the previous example - we can now store all of this data in its original form, preserving the natural structure and data types:
{
  "service": {
    "name": "user-service",
    "version": "1.2.3"
  },
  "http": {
    "status_code": 200
  },
  "user": {
    "preferences": {
      "theme": "dark",
      "notifications": {
        "email": true,
        "push": false
      }
    }
  },
  "error": {
    "stack": [
      "AuthError: Invalid token",
      "  at validateToken (auth.js:45)",
      "  at middleware (app.js:23)"
    ]
  }
}
Querying becomes intuitive as well:
SELECT LogAttributes.user.preferences.notifications.email
This returns the same Bool as before, and we didn't have to think about the nesting or data type!
Adding support to OpenTelemetry #
Before we could add support to HyperDX, we first had to ensure each layer of the stack could handle JSON properly. Adding support to the ClickHouse OpenTelemetry exporter first required support for the JSON type in the clickhouse-go client - used by the exporter for data insertion. This inserts JSON columns as a serialized JSON string. ClickHouse parses this and handles the identification of new columns and their types.
Additionally, there were also some optimizations made to the insertion logic itself. The Go driver was updated to use ClickHouse’s native API for both TCP and HTTP connections. This improved performance when transforming the data from OpenTelemetry's structures to ClickHouse's native columnar format. We also used pprof to identify optimizations for the main insertion loops. Most of these were redundant calls to getters on OpenTelemetry structures.
Support for JSON in the ClickHouse exporter was recently merged behind a feature flag. With this change, all columns that previously used the Map type now use the JSON type.
Adding support to HyperDX #
With support for the JSON type in the OpenTelemetry Collector, we could turn our focus to adding support in the UI layer - HyperDX.
To fully integrate support in HyperDX, we needed to update the UI to handle nested objects, which wasn’t feasible with the old Map type. This meant refactoring various components of the frontend to correctly render and interact with deeply structured JSON data. Furthermore, a few queries had to be rewritten to use the new JSON path notation, allowing us to access nested fields efficiently. At this stage, some operations still rely on casting JSON values to strings or floats, but over time we plan to implement smarter metadata caching. This would let us skip casting entirely when a field is consistently a single type.
Looking ahead, we expect to continue evolving the schema by introducing additional indexes and optimizations tailored for JSON workloads, improving performance even further within the ClickStack architecture.
How to enable JSON support? #
For now, JSON support remains beta and can be enabled with a feature flag when deploying any of the stack deployment modes.
docker run -e BETA_CH_OTEL_JSON_SCHEMA_ENABLED=true -e OTEL_AGENT_FEATURE_GATE_ARG='--feature-gates=clickhouse.json' -p 8080:8080 -p 4317:4317 -p 4318:4318 docker.hyperdx.io/hyperdx/hyperdx-all-in-one:2-nightly
Two environment variables are required to enable JSON type support:
BETA_CH_OTEL_JSON_SCHEMA_ENABLED=trueenables JSON support in ClickHouse, whileOTEL_AGENT_FEATURE_GATE_ARG='--feature-gates=clickhouse.json'enables JSON ingestion in the OTel collector.
If you want to explore the JSON type with sample data, take a look at the getting started guides which provide public datasets. We’d love to hear your feedback, so feel free to open issues or share suggestions in our public repository.
With JSON support now added throughout the stack, users can immediately start benefiting - often without even noticing.
The introduction of the JSON type brings a new schema that isn’t compatible with the old map-based schema. Users who want to use JSON will need to either configure a separate data source in HyperDX for the new JSON-based schemas or migrate their existing data with a simple
INSERT INTO ... SELECToperation.
The user experience remains almost identical, with some subtle visualization differences when inspecting attribute columns such as LogAttributes. Previously, the hierarchical structure was flattened, with sub-levels represented using dot notation (e.g., k8s.pod.name). Now, it’s preserved as a full hierarchy.
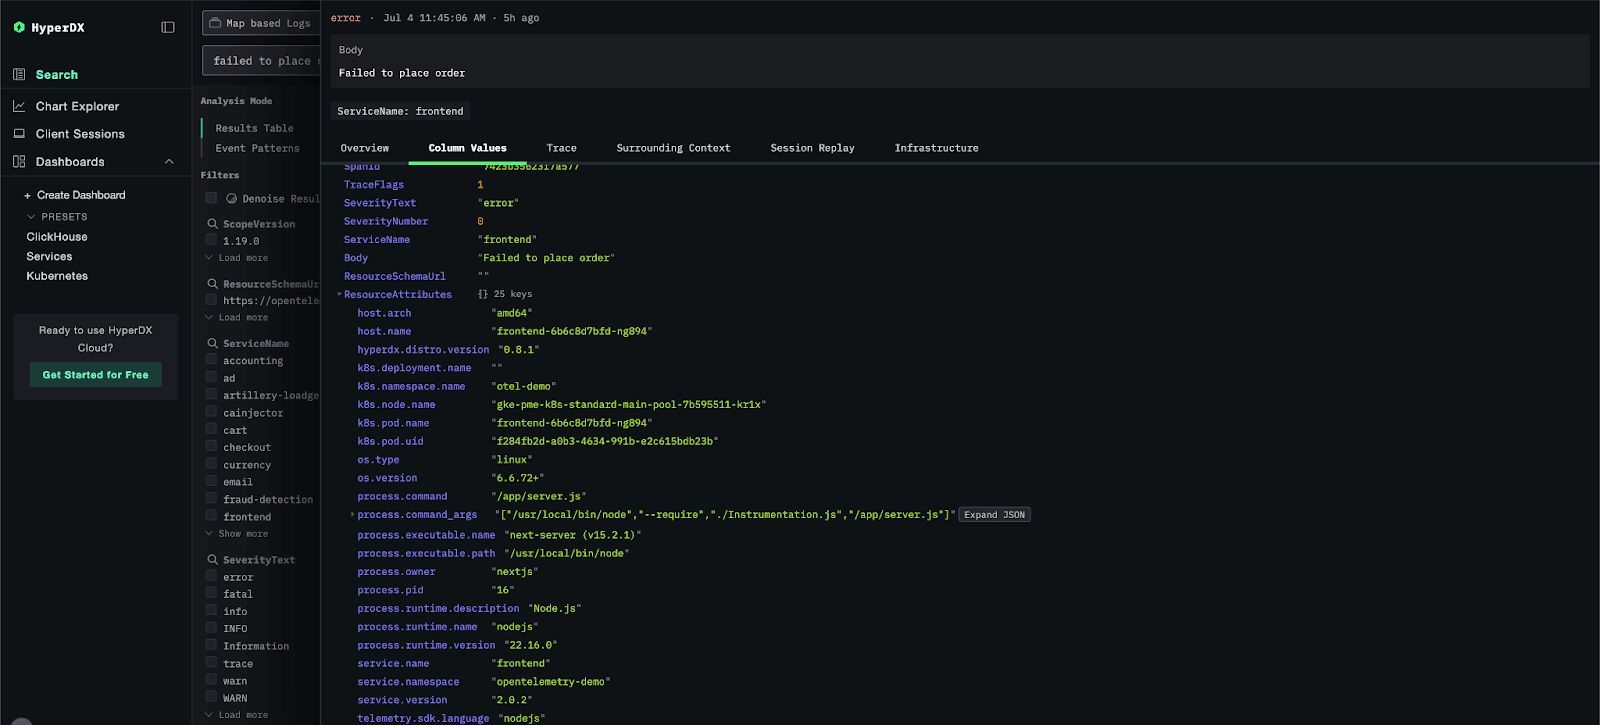 Classic Map-based rendering of attributes
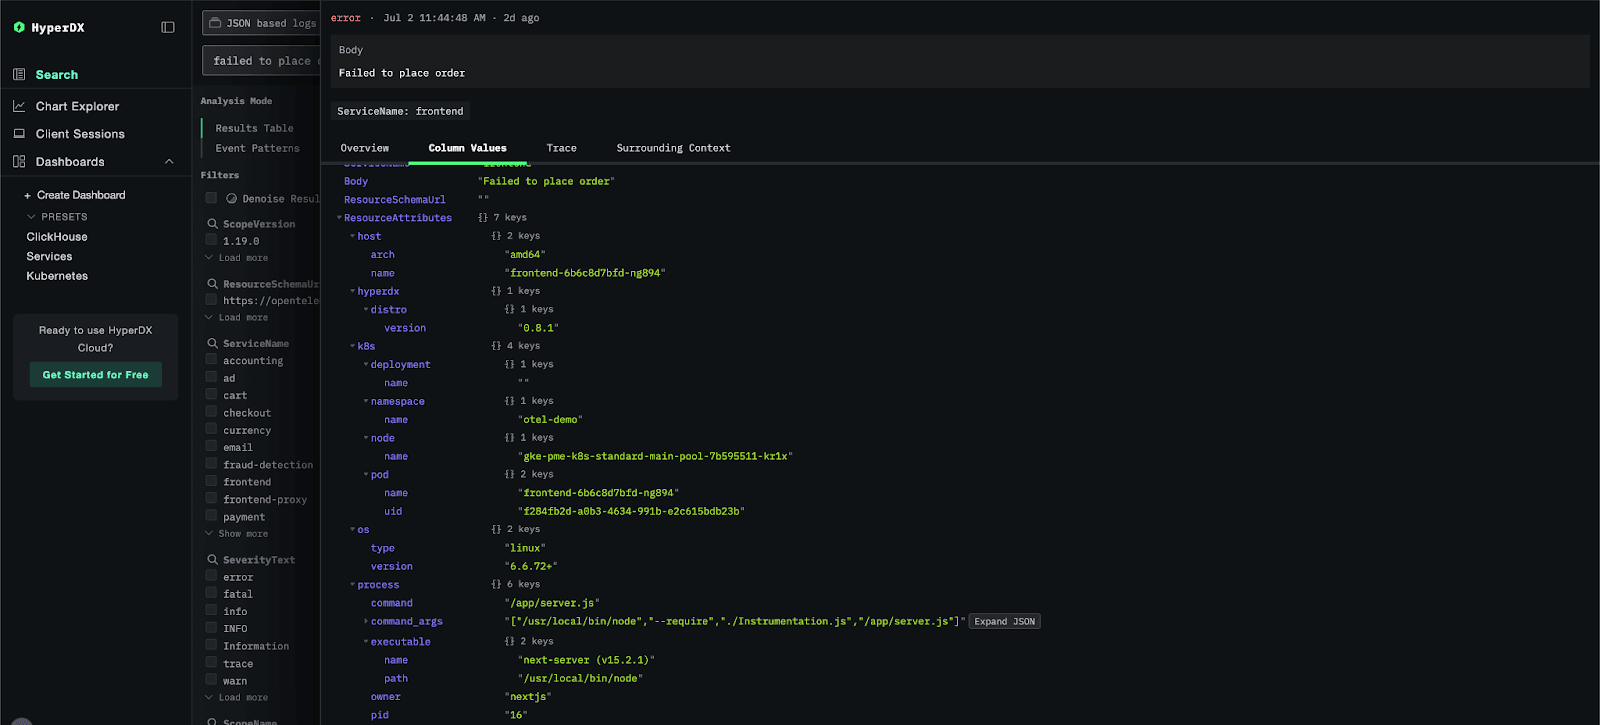 Hierarchical rendering of attributes with JSON type
So how much better is the JSON type? #
With HyperDX handling the heavy lifting of column auto-completion and Lucene-like query construction, the main benefit users will see is faster queries on the OTel columns which hold attributes such as LogAttributes due to reduced I/O. Additionally, unlike before when all values were converted to strings, the actual types of attributes are now preserved. This means if you send numeric or date attributes, their types remain intact, enabling direct and efficient comparisons.
To appreciate the benefit of this, let's consider the sample logging OTel dataset used by our ClickStack playground play-clickstack.clickhouse.com (which itself uses the clickhouse instance for sql.clickhouse.com) with approximately 90m rows. The Map-powered schema for this data:
CREATE TABLE otel_v2.otel_logs
(
    `Timestamp` DateTime64(9) CODEC(Delta(8), ZSTD(1)),
    `TimestampTime` DateTime DEFAULT toDateTime(Timestamp),
    `TraceId` String CODEC(ZSTD(1)),
    `SpanId` String CODEC(ZSTD(1)),
    `TraceFlags` UInt8,
    `SeverityText` LowCardinality(String) CODEC(ZSTD(1)),
    `SeverityNumber` UInt8,
    `ServiceName` LowCardinality(String) CODEC(ZSTD(1)),
    `Body` String CODEC(ZSTD(1)),
    `ResourceSchemaUrl` LowCardinality(String) CODEC(ZSTD(1)),
    `ResourceAttributes` Map(LowCardinality(String), String) CODEC(ZSTD(1)),
    `ScopeSchemaUrl` LowCardinality(String) CODEC(ZSTD(1)),
    `ScopeName` String CODEC(ZSTD(1)),
    `ScopeVersion` LowCardinality(String) CODEC(ZSTD(1)),
    `ScopeAttributes` Map(LowCardinality(String), String) CODEC(ZSTD(1)),
    `LogAttributes` Map(LowCardinality(String), String) CODEC(ZSTD(1)),
    INDEX idx_trace_id TraceId TYPE bloom_filter(0.001) GRANULARITY 1,
    INDEX idx_res_attr_key mapKeys(ResourceAttributes) TYPE bloom_filter(0.01) GRANULARITY 1,
    INDEX idx_res_attr_value mapValues(ResourceAttributes) TYPE bloom_filter(0.01) GRANULARITY 1,
    INDEX idx_scope_attr_key mapKeys(ScopeAttributes) TYPE bloom_filter(0.01) GRANULARITY 1,
    INDEX idx_scope_attr_value mapValues(ScopeAttributes) TYPE bloom_filter(0.01) GRANULARITY 1,
    INDEX idx_log_attr_key mapKeys(LogAttributes) TYPE bloom_filter(0.01) GRANULARITY 1,
    INDEX idx_log_attr_value mapValues(LogAttributes) TYPE bloom_filter(0.01) GRANULARITY 1,
    INDEX idx_body Body TYPE tokenbf_v1(32768, 3, 0) GRANULARITY 8
)
ENGINE = MergeTree
PARTITION BY toDate(TimestampTime)
PRIMARY KEY (ServiceName, TimestampTime)
ORDER BY (ServiceName, TimestampTime, Timestamp)
The equivalent new JSON-powered schema:
CREATE TABLE otel_json.otel_logs
(
    `Timestamp` DateTime64(9) CODEC(Delta(8), ZSTD(1)),
    `TimestampTime` DateTime DEFAULT toDateTime(Timestamp),
    `TraceId` String CODEC(ZSTD(1)),
    `SpanId` String CODEC(ZSTD(1)),
    `TraceFlags` UInt8,
    `SeverityText` LowCardinality(String) CODEC(ZSTD(1)),
    `SeverityNumber` UInt8,
    `ServiceName` LowCardinality(String) CODEC(ZSTD(1)),
    `Body` String CODEC(ZSTD(1)),
    `ResourceSchemaUrl` LowCardinality(String) CODEC(ZSTD(1)),
    `ResourceAttributes` JSON CODEC(ZSTD(1)),
    `ScopeSchemaUrl` LowCardinality(String) CODEC(ZSTD(1)),
    `ScopeName` String CODEC(ZSTD(1)),
    `ScopeVersion` LowCardinality(String) CODEC(ZSTD(1)),
    `ScopeAttributes` JSON CODEC(ZSTD(1)),
    `LogAttributes` JSON CODEC(ZSTD(1)),
    INDEX idx_body Body TYPE tokenbf_v1(32768, 3, 0) GRANULARITY 8
)
ENGINE = MergeTree
PARTITION BY toDate(TimestampTime)
PRIMARY KEY (ServiceName, TimestampTime)
ORDER BY (ServiceName, TimestampTime, Timestamp)
You may notice this schema is significantly less verbose, mainly because bloom filters for the
Maptype keys and values are no longer needed. The fields withinResourceAttributes,ScopeAttributes, andLogAttributesare now stored as sub-columns, making the bloom filters redundant.
Suppose we wished to see the volume of log traffic coming from each pod. HyperDX will abstract writing this query, but the underlying SQL (simplified) would be an aggregation. Using the previous Map type:
A few things to note here: the performance at 2.7s, the number of rows scanned (the whole dataset), the memory overhead at 1.6GB and finally the amount of data read - 30GB!
The volume of data read here highlights the challenge of the Map type i.e. the sub fields are represented as one single column, requiring the entire LogAttributes column to be read just to access the JSON field 'k8s.pod.name'.
Contrast this with querying the same field with the JSON - note its now its own column, not a field!
The difference in performance here is dramatic - a 9x speedup. While we process the same number of rows the amount of data read has been reduced by over 10x, with just the values for our column read.
Other improvements #
The JSON type is clearly the star of this month’s ClickStack update, but we didn’t stop there. We’ve been adding small touches throughout ClickStack that, while subtle on their own, come together to make the overall experience smoother and more enjoyable. Here are a few highlights.
Helm chart improvements #
This month, we’ve shipped several enhancements to the HyperDX Helm chart to give users more flexibility and control over their deployments. Highlights include the ability to bring your own MongoDB service, support for custom ClickHouse user credentials, and improved PVC configuration. We also added options for nodeSelector and tolerations, configurable service types and annotations, expanded ingress capabilities for both HyperDX and the app, and support for setting custom environment variables on the OpenTelemetry collector. These updates make it even easier to tailor HyperDX to your infrastructure and workload needs.
CSV download for search tables #
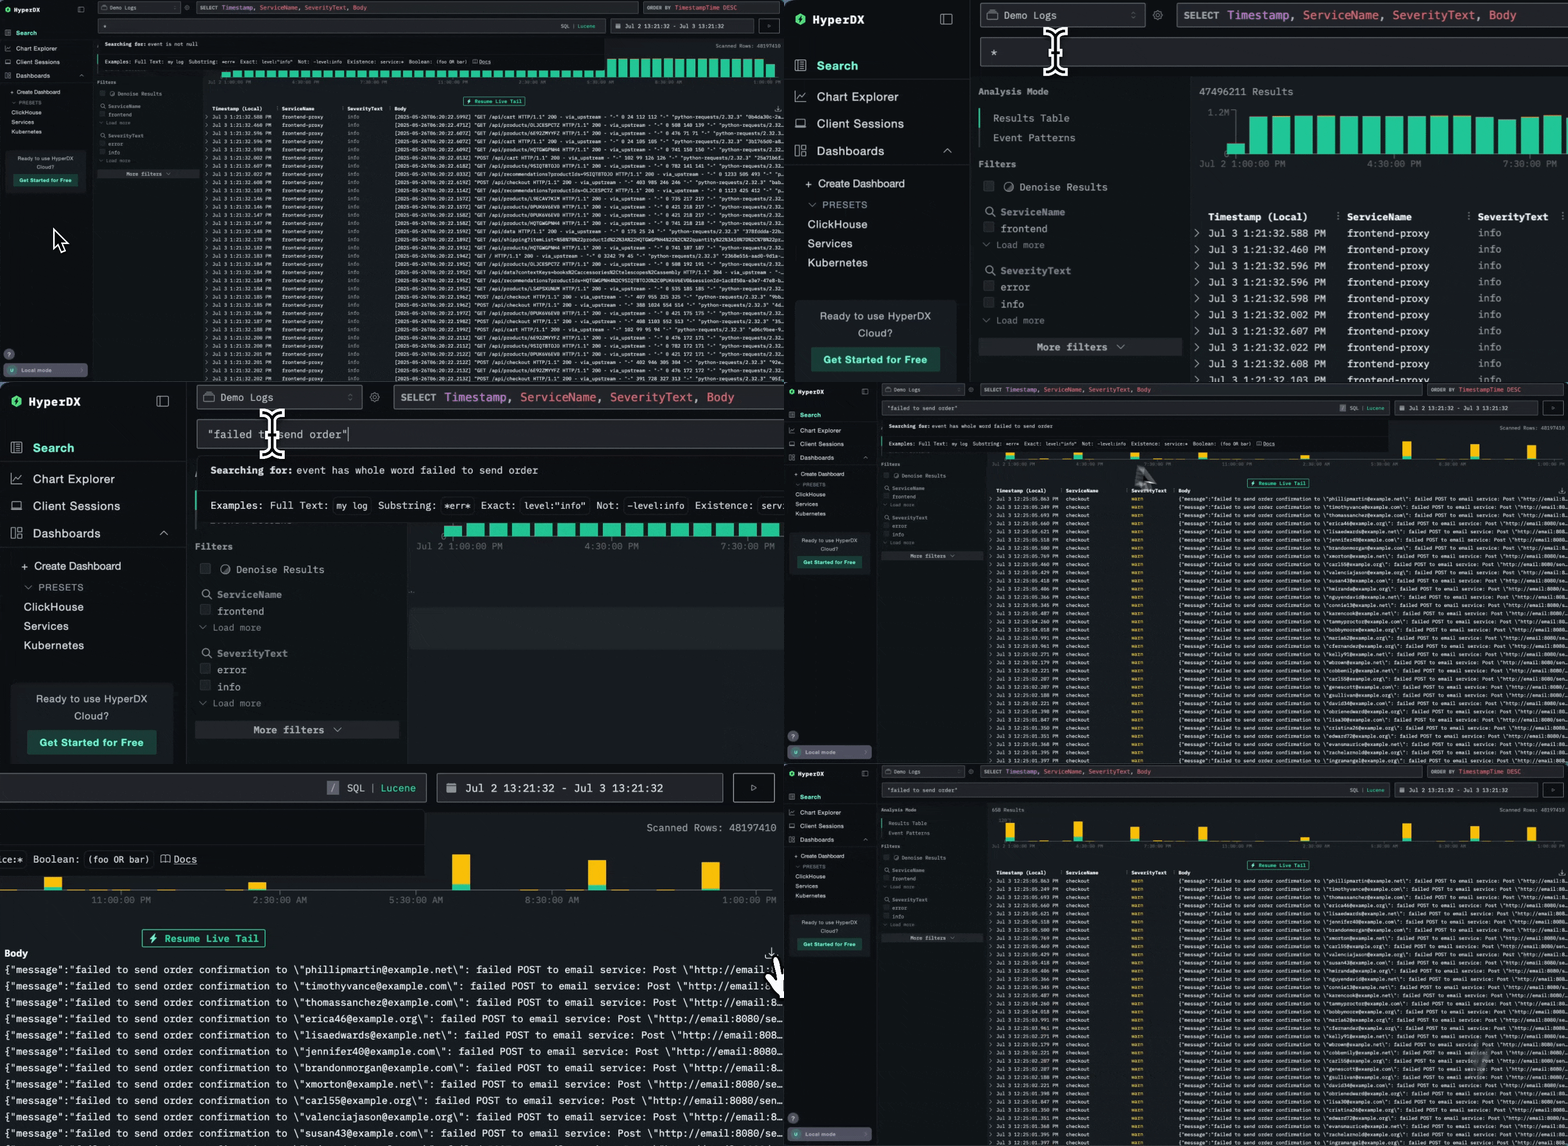
Another highly requested feature we’ve added is the ability for users to download their search results. For performance reasons, this is currently limited to 4,000 rows, but it’s still incredibly useful for anyone needing to export data for further analysis or sharing. Exports are provided as CSV files, making it easy to work with your data in spreadsheets or other tools.
Elastic migration guide #
In response to community requests, we’ve published a new Elastic Stack Migration Guide to help the many users looking to move from Elastic (formerly the Elastic Stack or ELK Stack). The benefits are clear: better compression, higher resource efficiency, and ultimately a lower total cost of ownership. While migrations can involve some complexities, we’ve worked to make the process as smooth as possible. This guide maps out equivalent concepts between the two technologies and provides a clear path for migrating your language SDKs and agents, helping you get up and running quickly. Stay tuned for more migration guides over the coming months from other legacy observability solutions.
Docker image size optimization #
We want our getting started experience to be as smooth as possible, so we’ve focused on reducing the size of our container images. One of the first pieces of feedback we received was that downloading our all-in-one image meant pulling quite a large Docker file. We’ve since cut the size of the all-in-one image from 3GB to 2.2GB, and the application itself is now nearly 50% smaller - dropping from around 2GB to 1.2GB. We’re continuously working to make these images even lighter and faster to download, so you can get up and running with minimal friction.


