Why benchmarks keep showing up in my work #
As the year winds down, I like to zoom out and look at the work I’m proudest of.
I wrote (and helped ship) a lot of ClickHouse content this year, but a bunch of the posts I care about most share the same backbone: each one has a benchmark behind it.

Benchmarks show up again and again in my work because they force clarity. They correct intuition, surface trade-offs, and sometimes overturn narratives that have stuck around for too long.
Here are a few of my favorites from this year, the ones that surprised me, changed how people think about ClickHouse, or directly impacted how real systems were built. Taken together, they form a loose narrative, from data layout and ingestion, through storage and execution, and finally to cost.
And reading back through them, I kept noticing the same thing: performance comes down to how efficiently an engine moves data end-to-end.
The billion-docs JSON benchmark #
This benchmark started with a foundational question: what does JSON look like when you treat it as columnar data instead of a document blob?
ClickHouse completely reimagined JSON storage on top of column-oriented storage, resulting in unmatched speed, compression, and user experience, far beyond any existing JSON data store.
To prove the speed, we created JSONBench: a reproducible benchmark that loads the same real-world dataset (up to 1B Bluesky events) into multiple systems, then measures storage size, cold/hot query runtimes, and data quality (how many documents were successfully ingested).
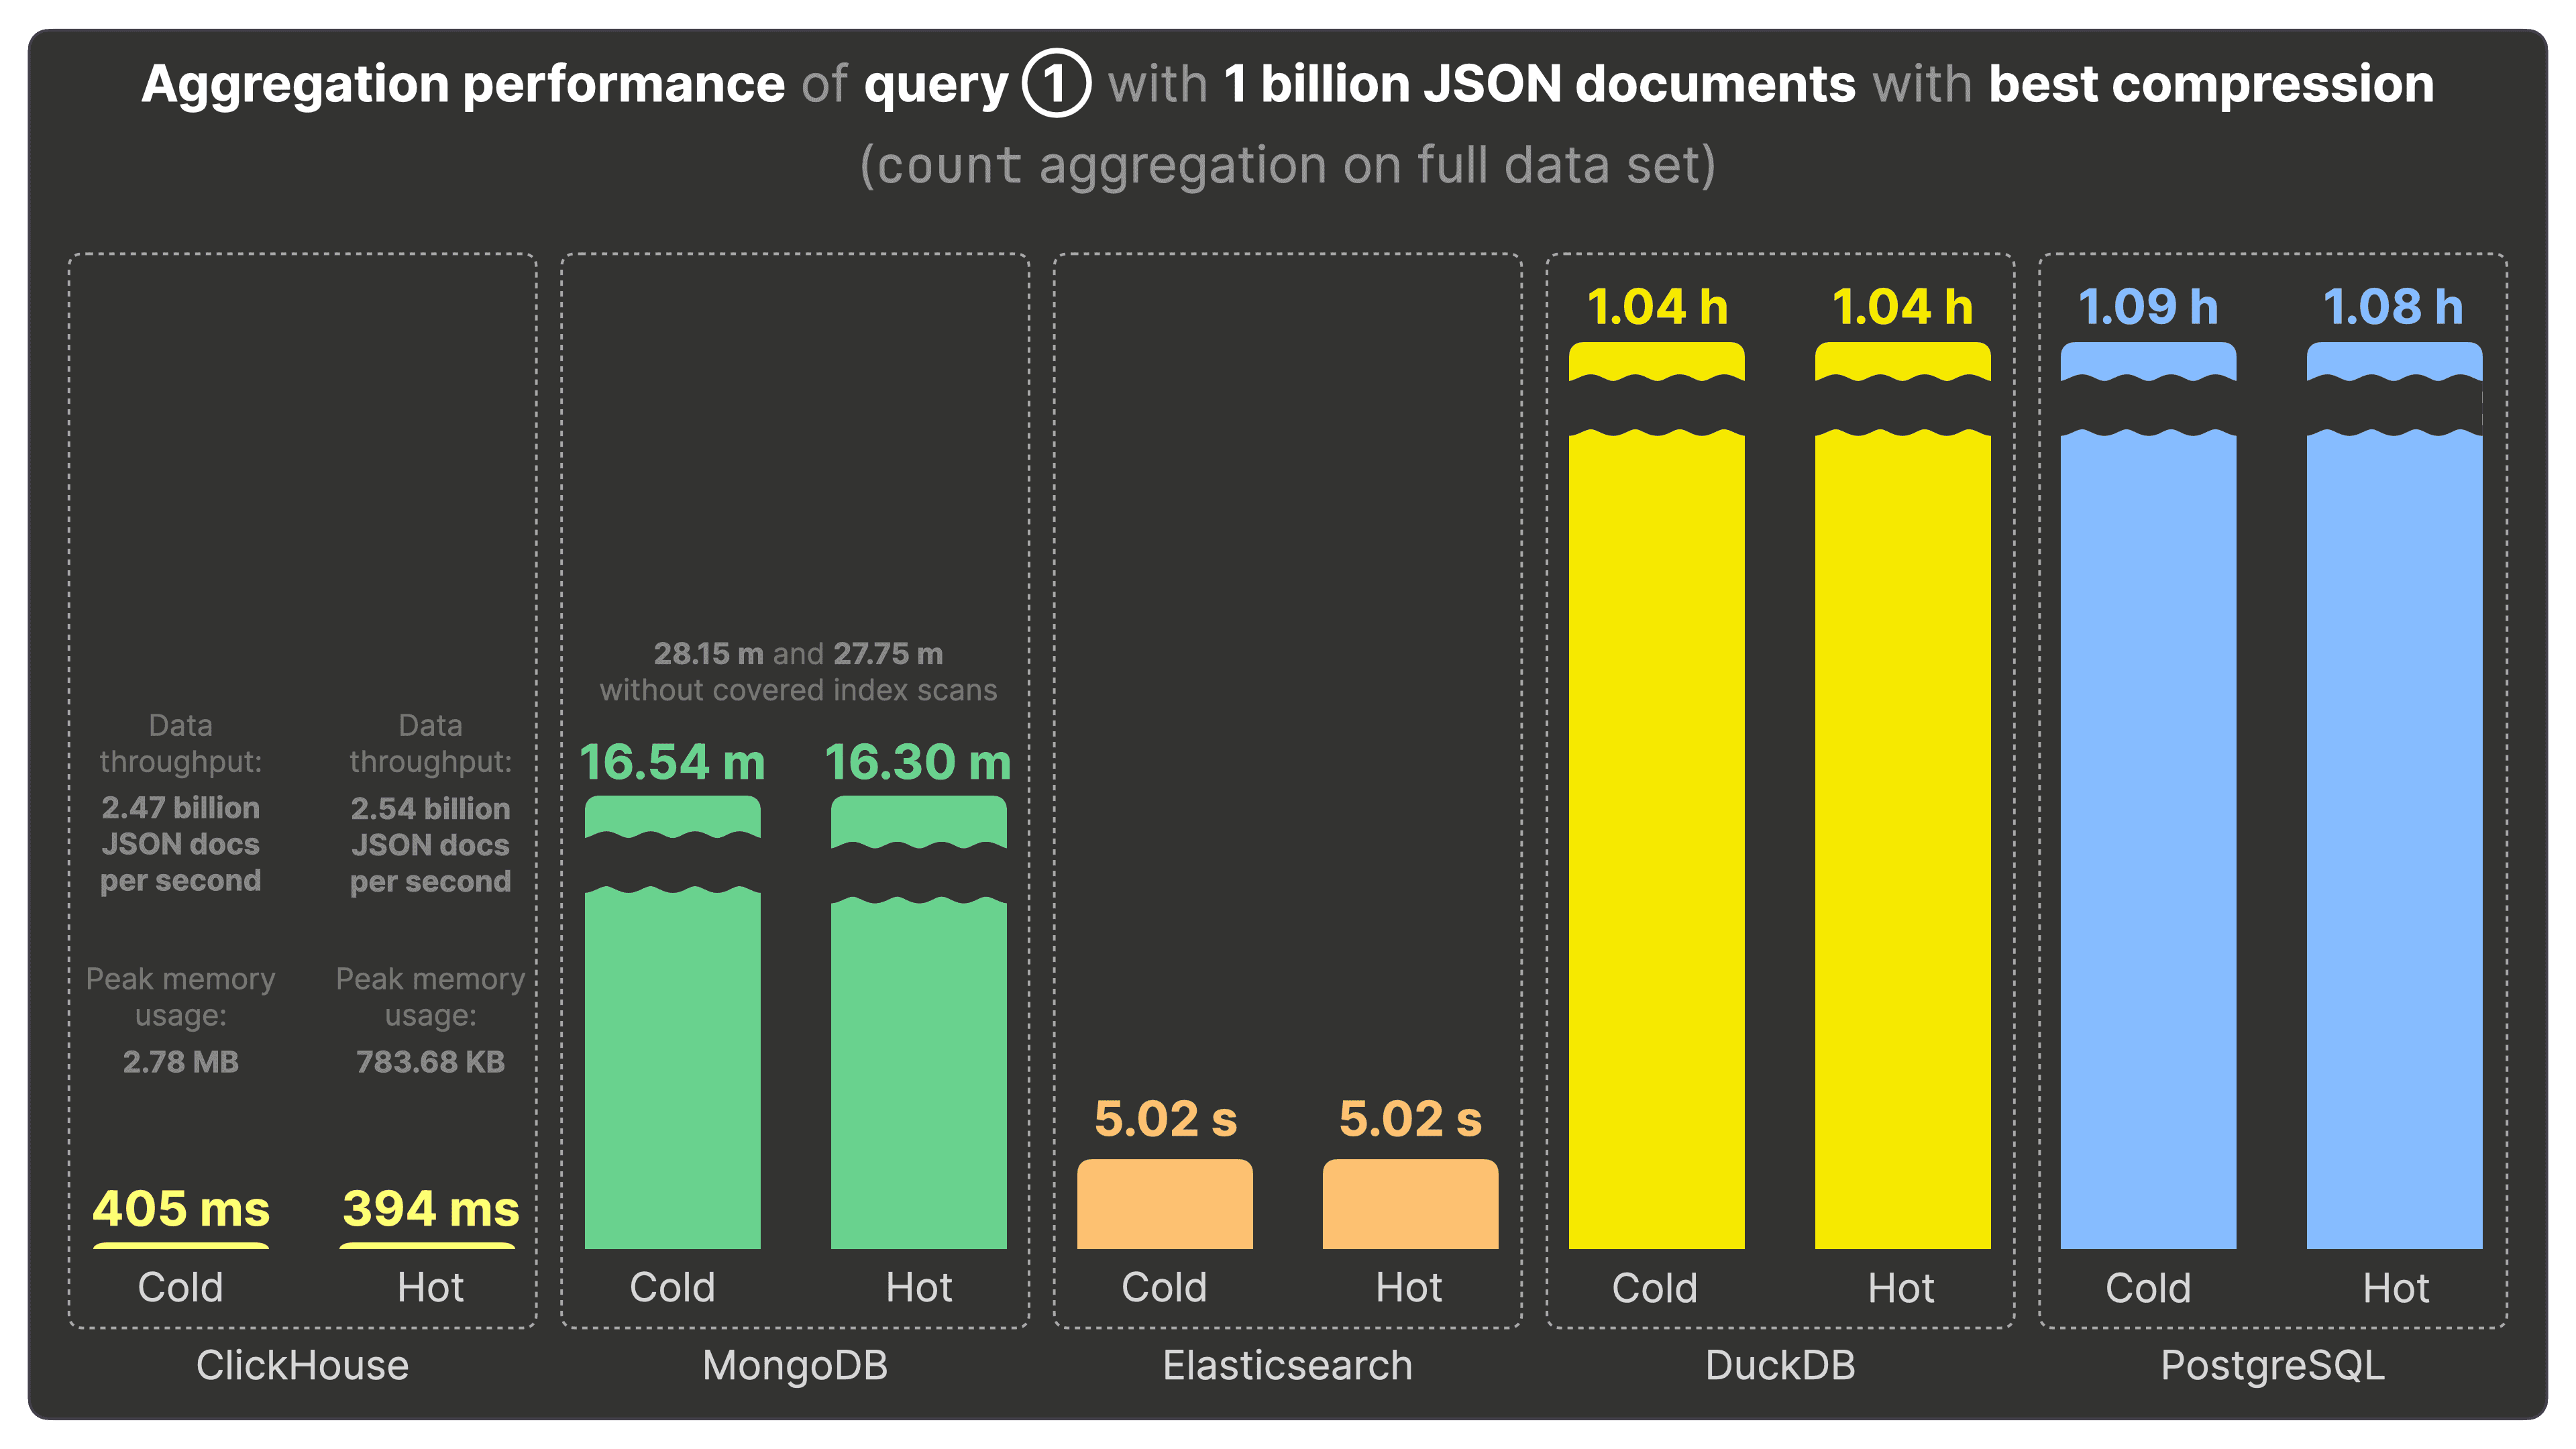
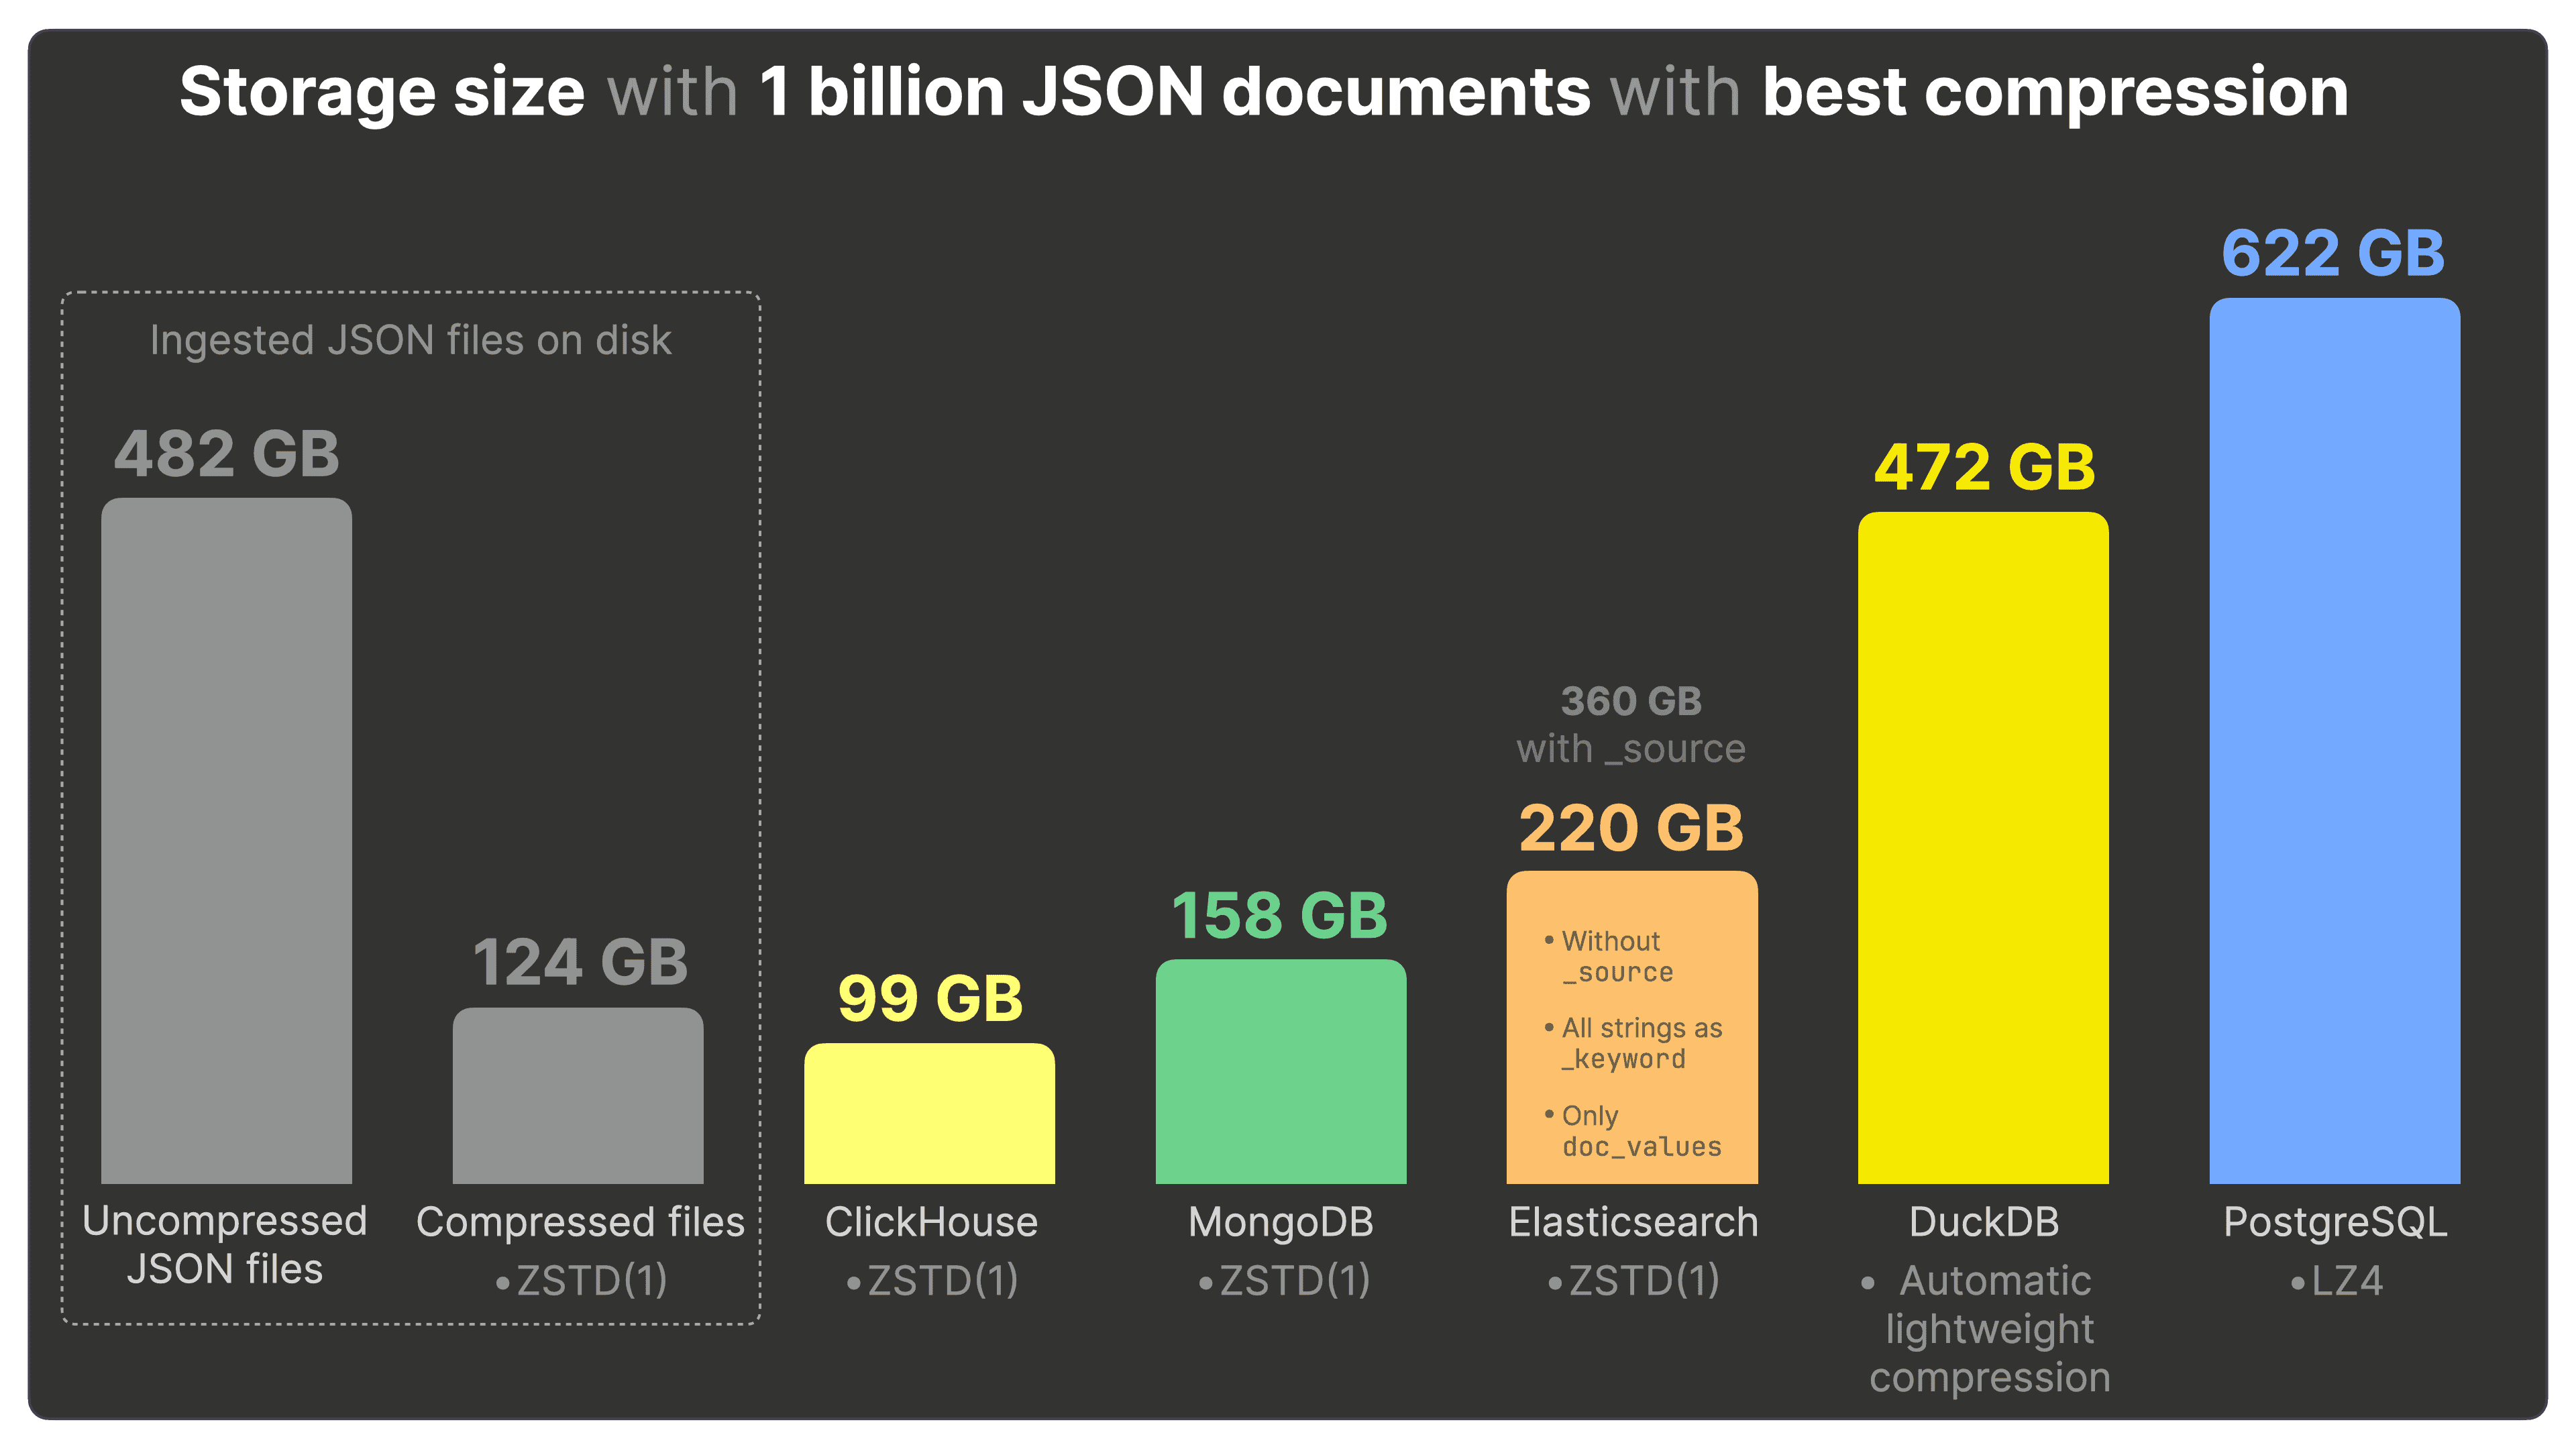
In the original billion-docs run, ClickHouse was orders of magnitude faster while also being smaller on disk (including 20% more compact than storing the same JSON as compressed files on disk).
We also built a live online dashboard where you can slice results by dataset size, cold vs. hot, storage, and data quality, plus a toggle for systems that flatten JSON.
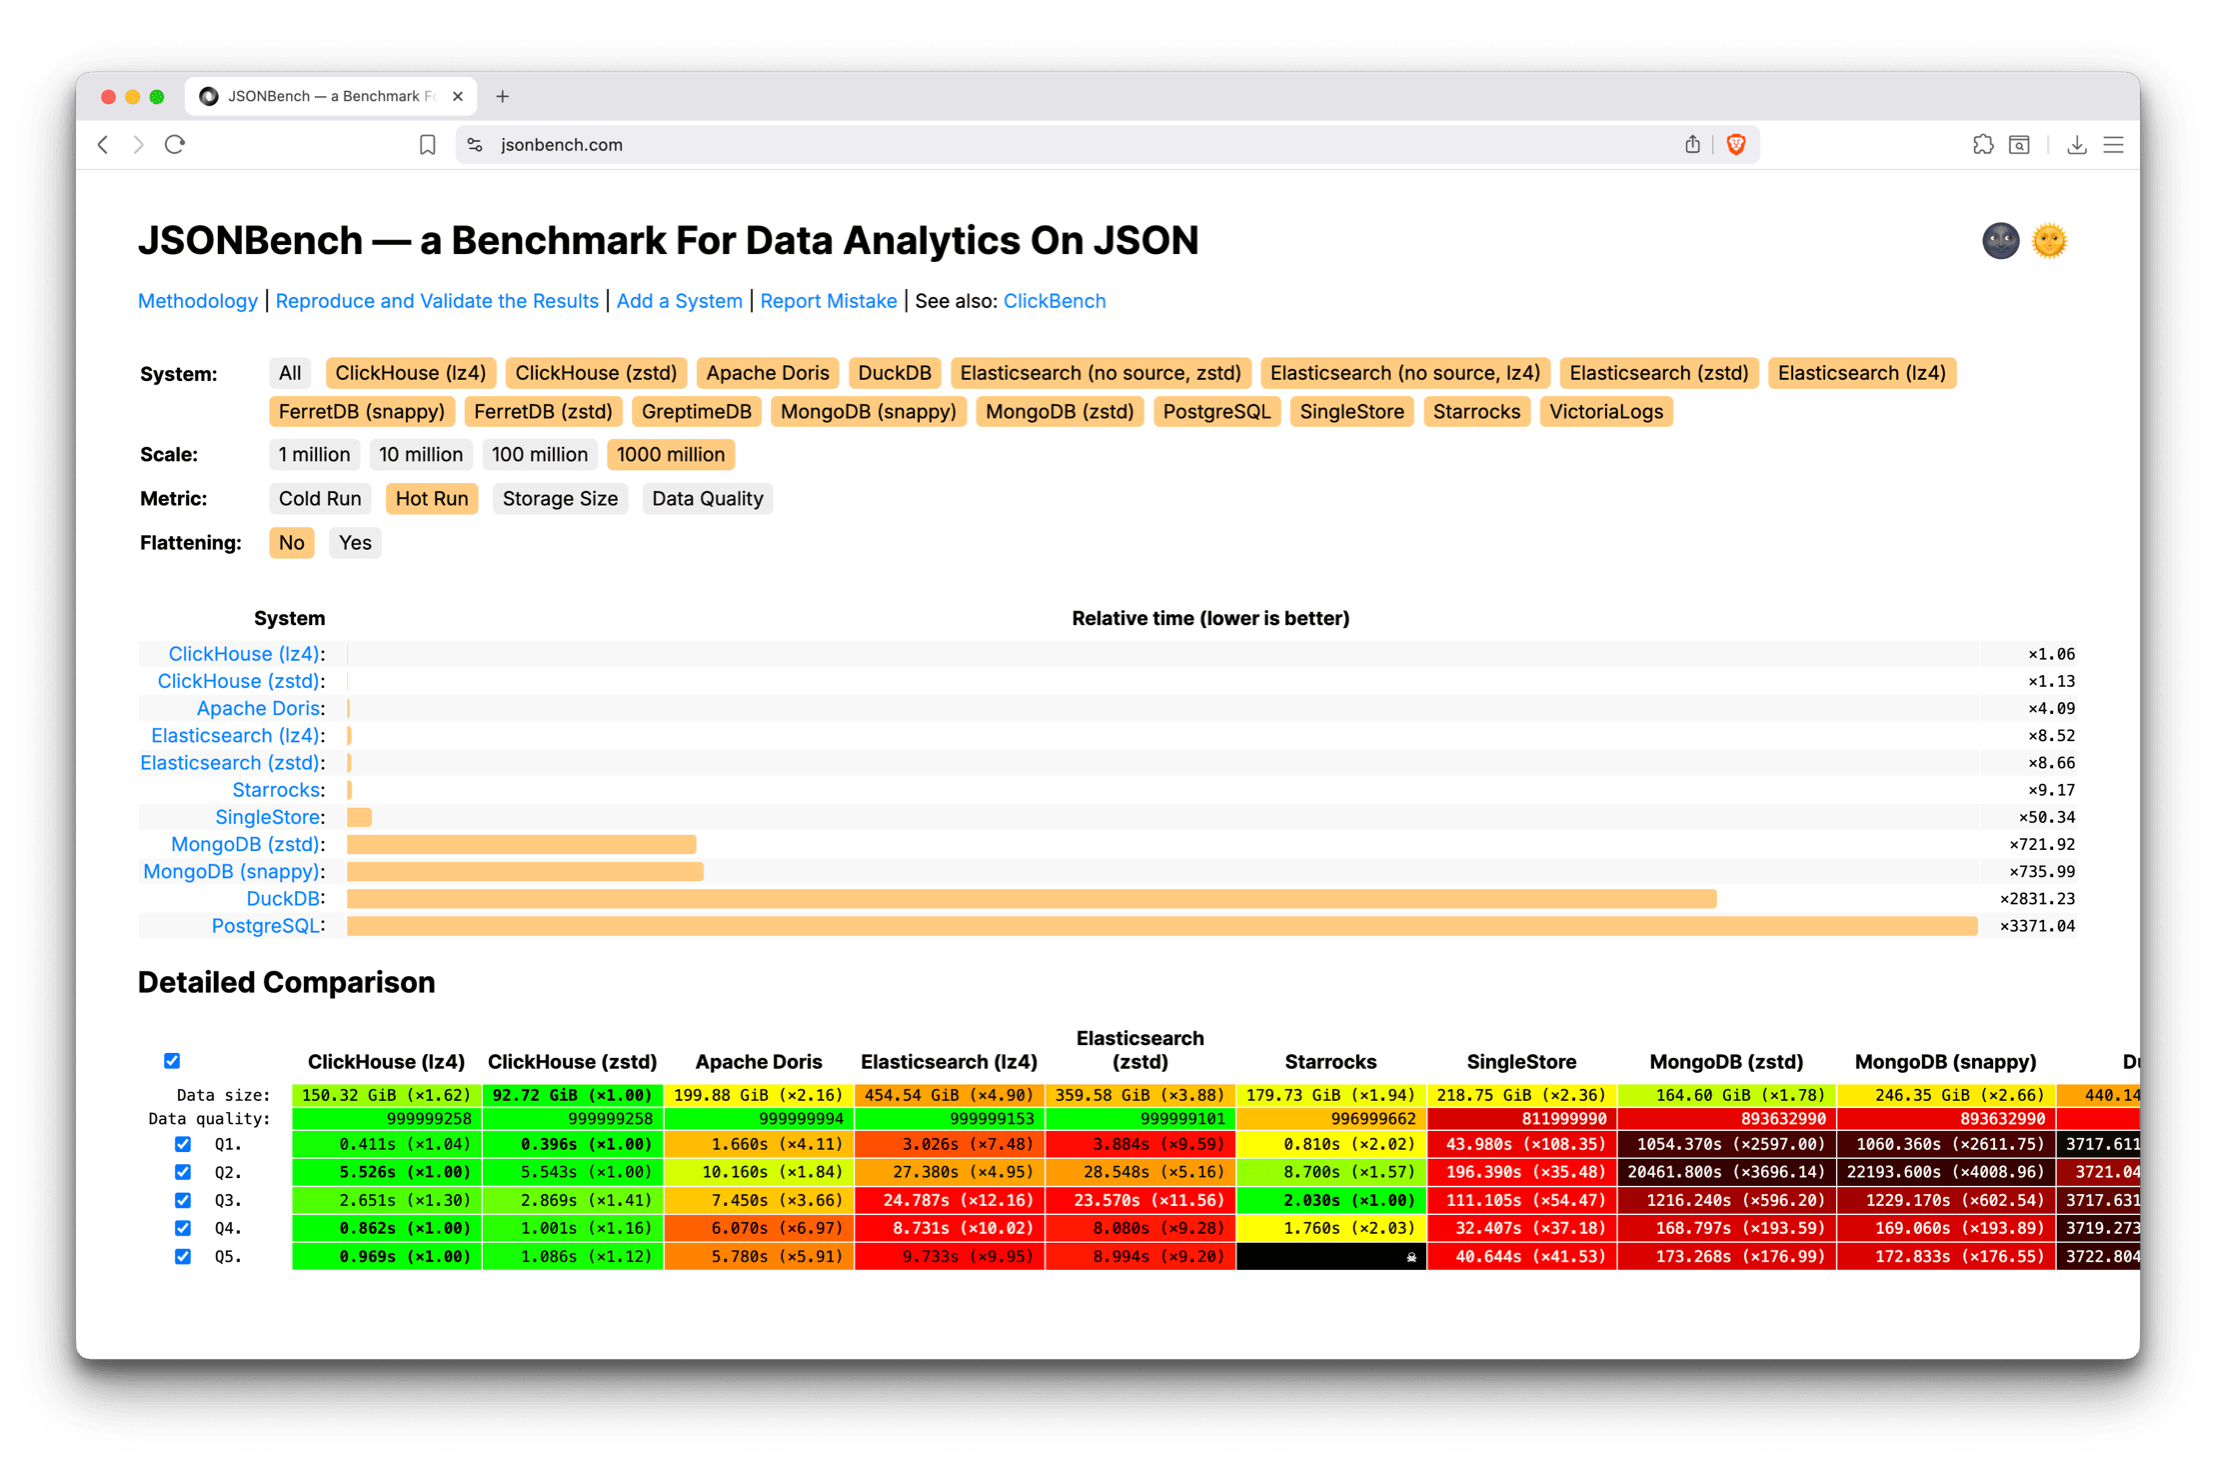
JSONBench didn’t stop at a blog post. It’s now actively used in the community and regularly receives external pull requests, adding new or updating results for exiting systems.
This is one of my favorite benchmarks this year because the results genuinely surprised me.
ClickHouse was thousands of times faster than traditional JSON data stores like MongoDB, while also using significantly less storage. It completely changed my intuition for what’s possible with analytical queries on JSON.
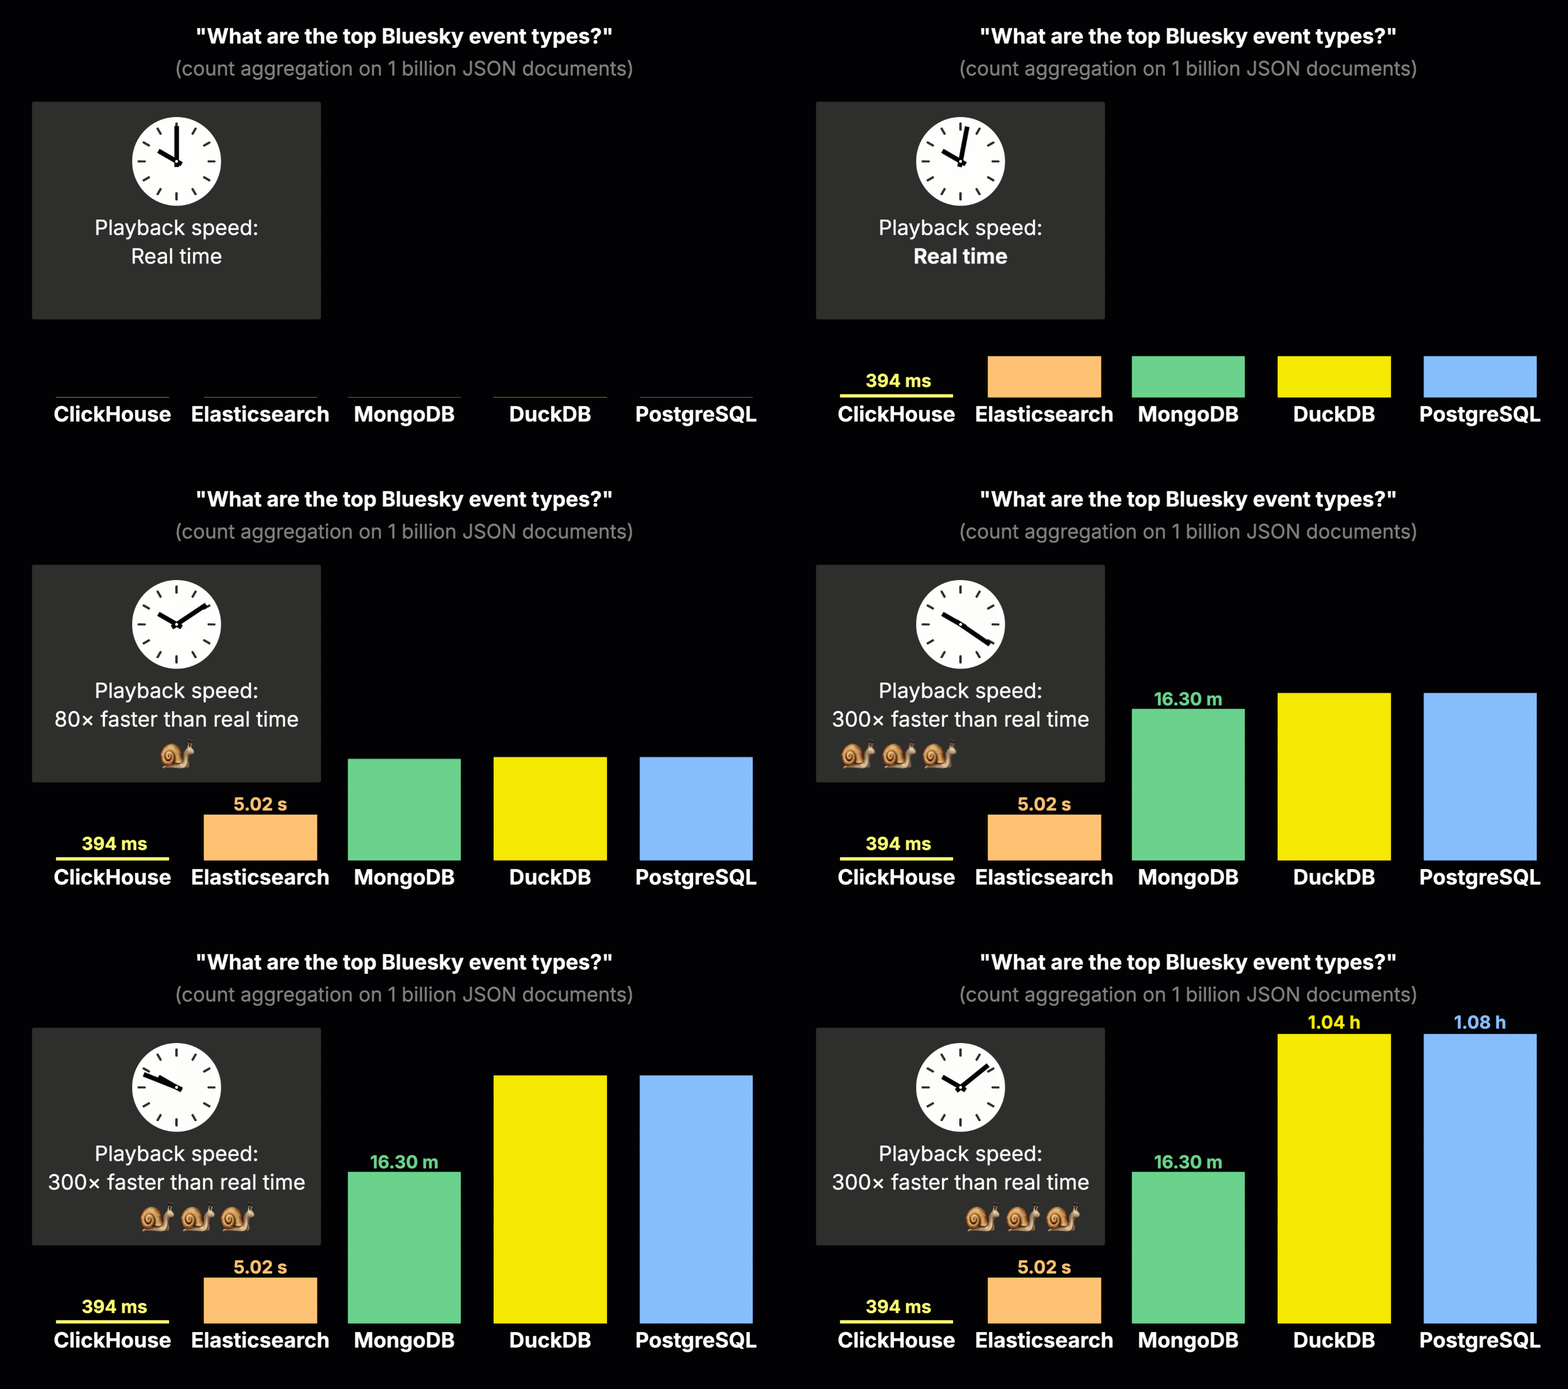
Side story: ClickHouse already started from a strong lead in the original JSONBench results. We continued improving the JSON implementation independently, and later shipped new shared-data serializations that dramatically improved performance and memory usage for complex JSON workloads. As a result, ClickHouse now leads even further across both cold and hot runs at all dataset sizes, with a significantly larger margin than before.
The input formats benchmark #
This benchmark came from a deceptively simple question: if ClickHouse supports 70+ input formats, which ones actually matter for high-throughput ingestion?
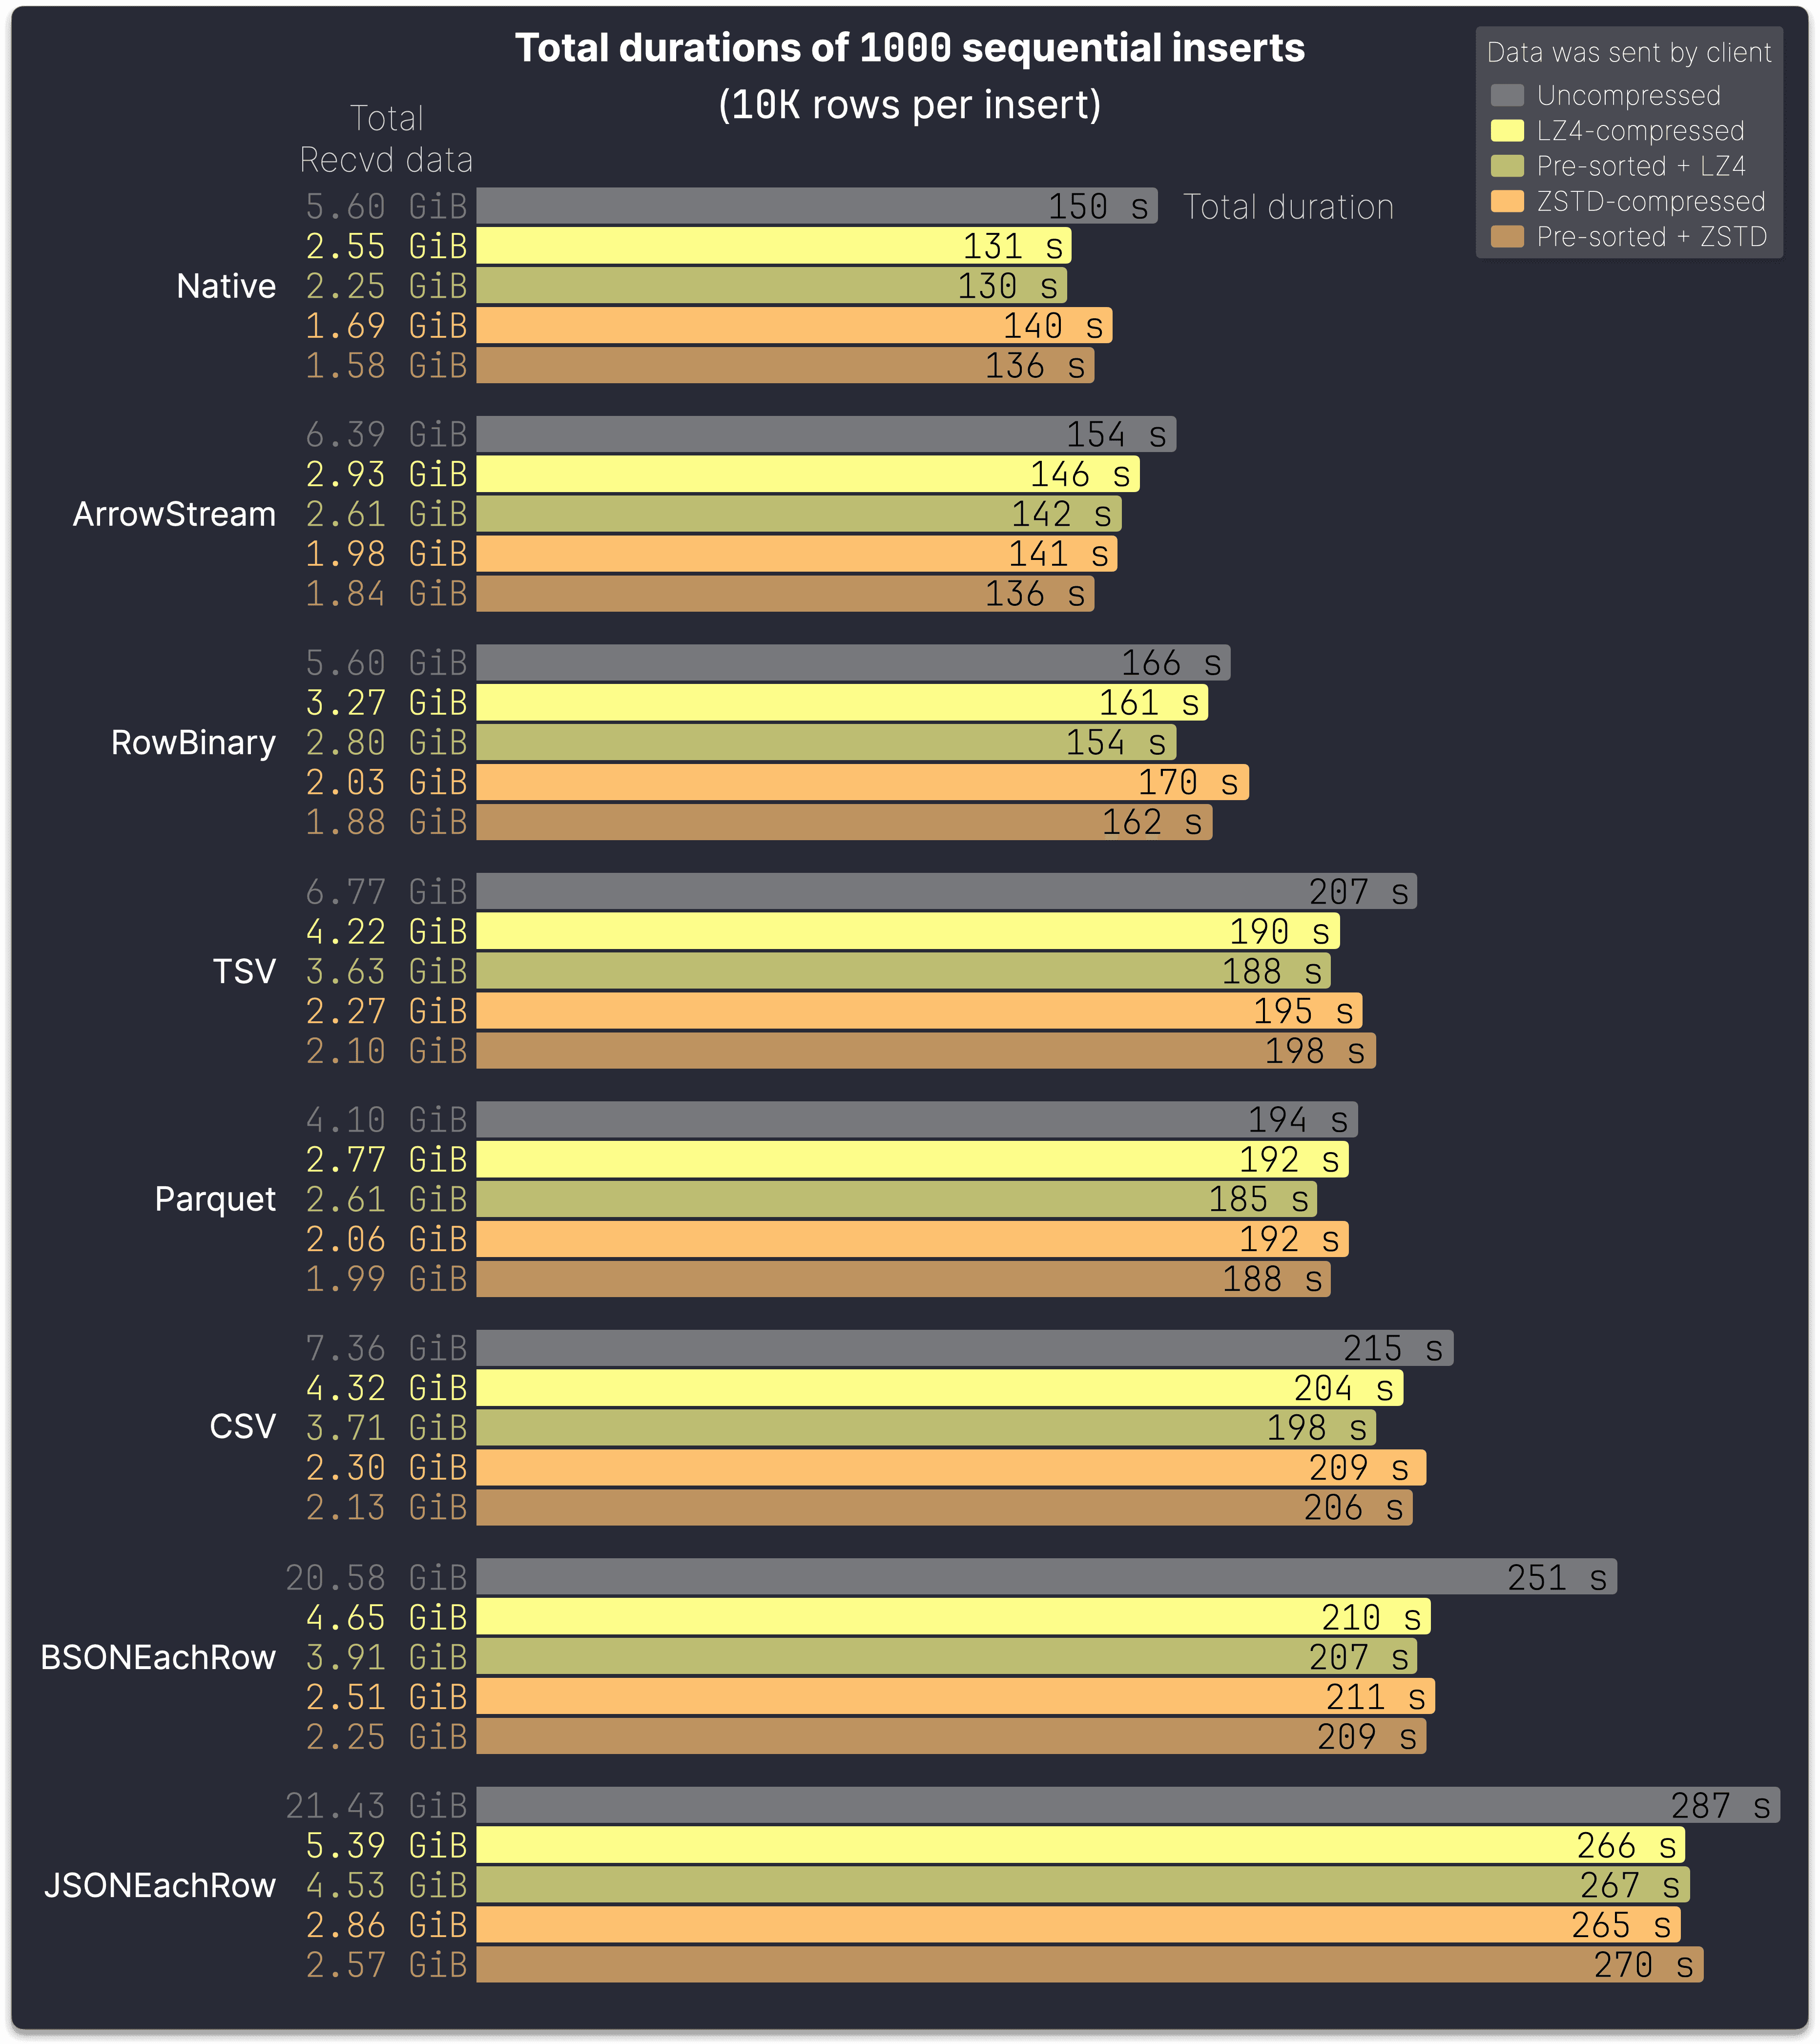
To answer that properly, we built FastFormats, a systematic benchmark that isolates server-side ingestion cost and measures time, CPU usage, memory usage, and file size across dozens of formats, batch sizes, compression schemes, and pre-sorting variants.
The headline result was clear and surprisingly consistent:
-
Native format wins across essentially all scenarios
-
Compression (LZ4 first, ZSTD when bandwidth matters) is a no-brainer
-
Pre-sorting helps, but much less than people expect
-
Batch size matters more than almost anything else
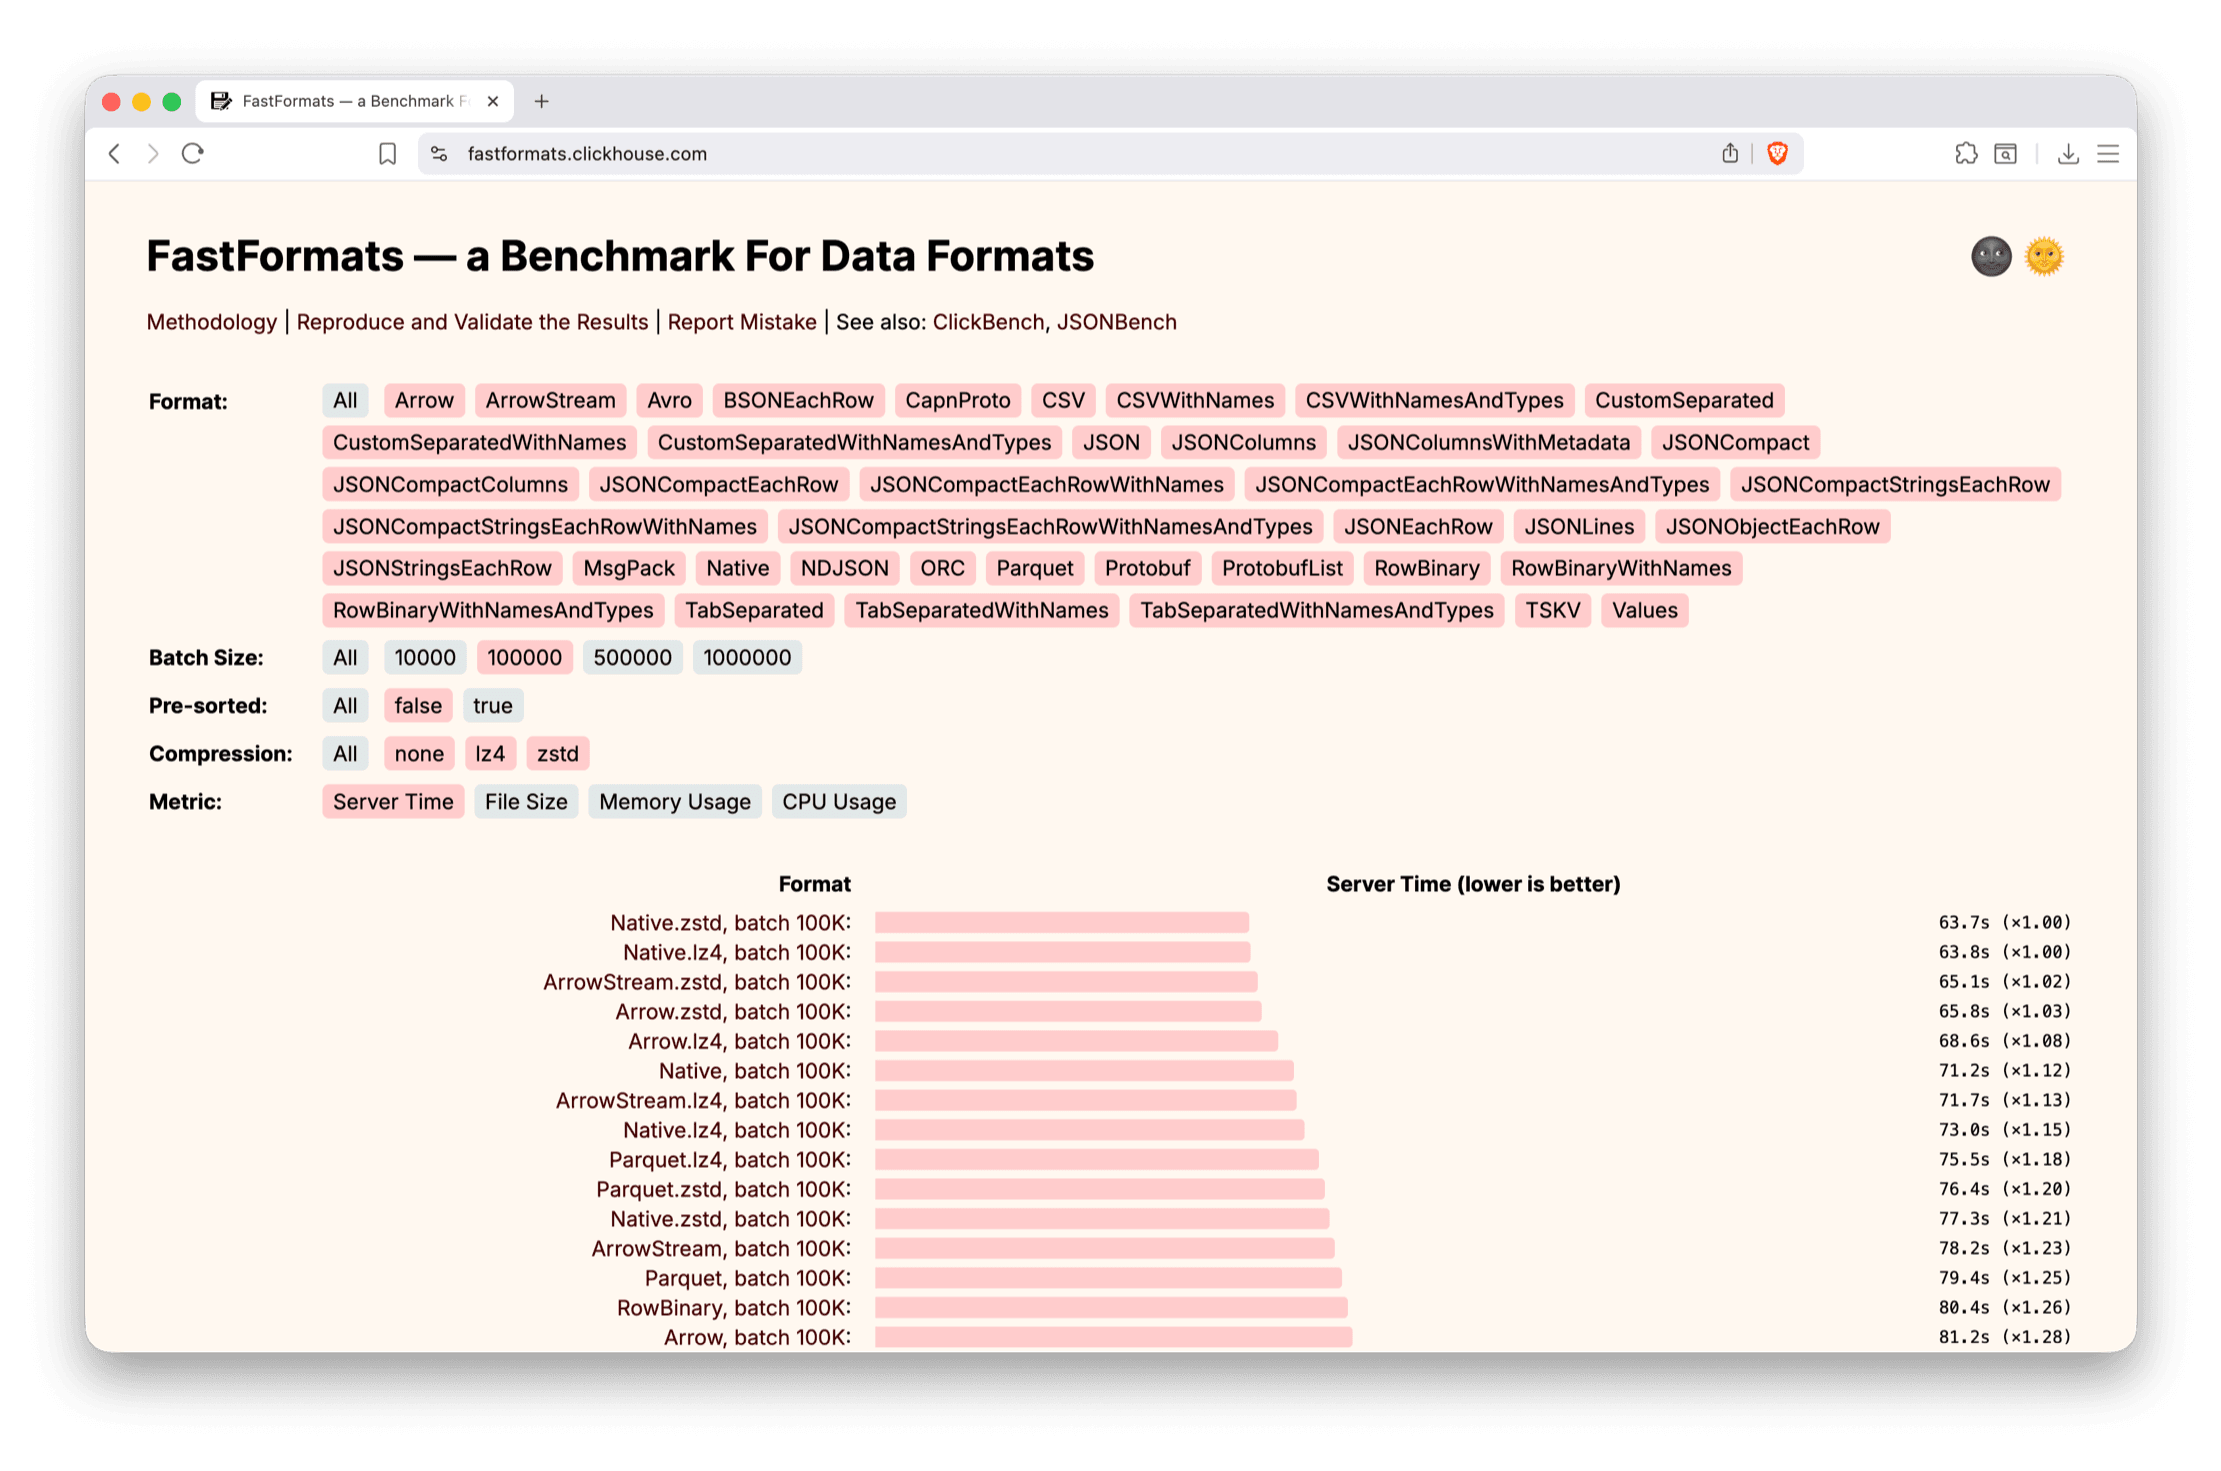
And, like with JSONBench, we also built a live FastFormats dashboard where you can slice results by format, batch size, compression, pre-sorting, and metric.
This is one of my favorite benchmarks this year because it had direct production impact beyond ClickHouse itself.
Netflix describes how one of their biggest ingestion wins came directly from reading this post and looking at the FastFormats results. After seeing that the native ClickHouse protocol consistently outperformed RowBinary, they reverse-engineered the Go client and implemented native-protocol encoding with LZ4 in their Java pipeline. The result: lower CPU usage, better memory efficiency, and a system that now ingests ~5 PB of logs per day into ClickHouse.
The object storage cache benchmark #
This benchmark started from a practical cloud question: why do analytics systems still feel slow even when throughput looks great on paper?
The answer turned out not to be bandwidth, but latency. Object storage can deliver decent throughput, but every read still costs hundreds of milliseconds, and for many analytical queries (small, selective, scattered reads), that latency dominates everything else.
To tackle this, we built and benchmarked a distributed cache for ClickHouse Cloud: a shared, low-latency caching layer that sits between stateless compute nodes and object storage. Instead of each node warming its own isolated cache, hot table data is cached once and reused instantly by all nodes.
The benchmarks compare three setups using the same dataset and queries:
-
a self-managed server with local SSDs,
-
ClickHouse Cloud with a traditional per-node filesystem cache,
-
ClickHouse Cloud with the new distributed cache.
The results:
-
For throughput-bound scans, cold queries ran up to 4× faster than a local-SSD setup, thanks to shared caching and parallel fetch across cache nodes.
-
For latency-sensitive scattered reads, cold queries matched SSD performance, and hot queries consistently hit sub-60 ms memory-speed latency—without any local disks at all.
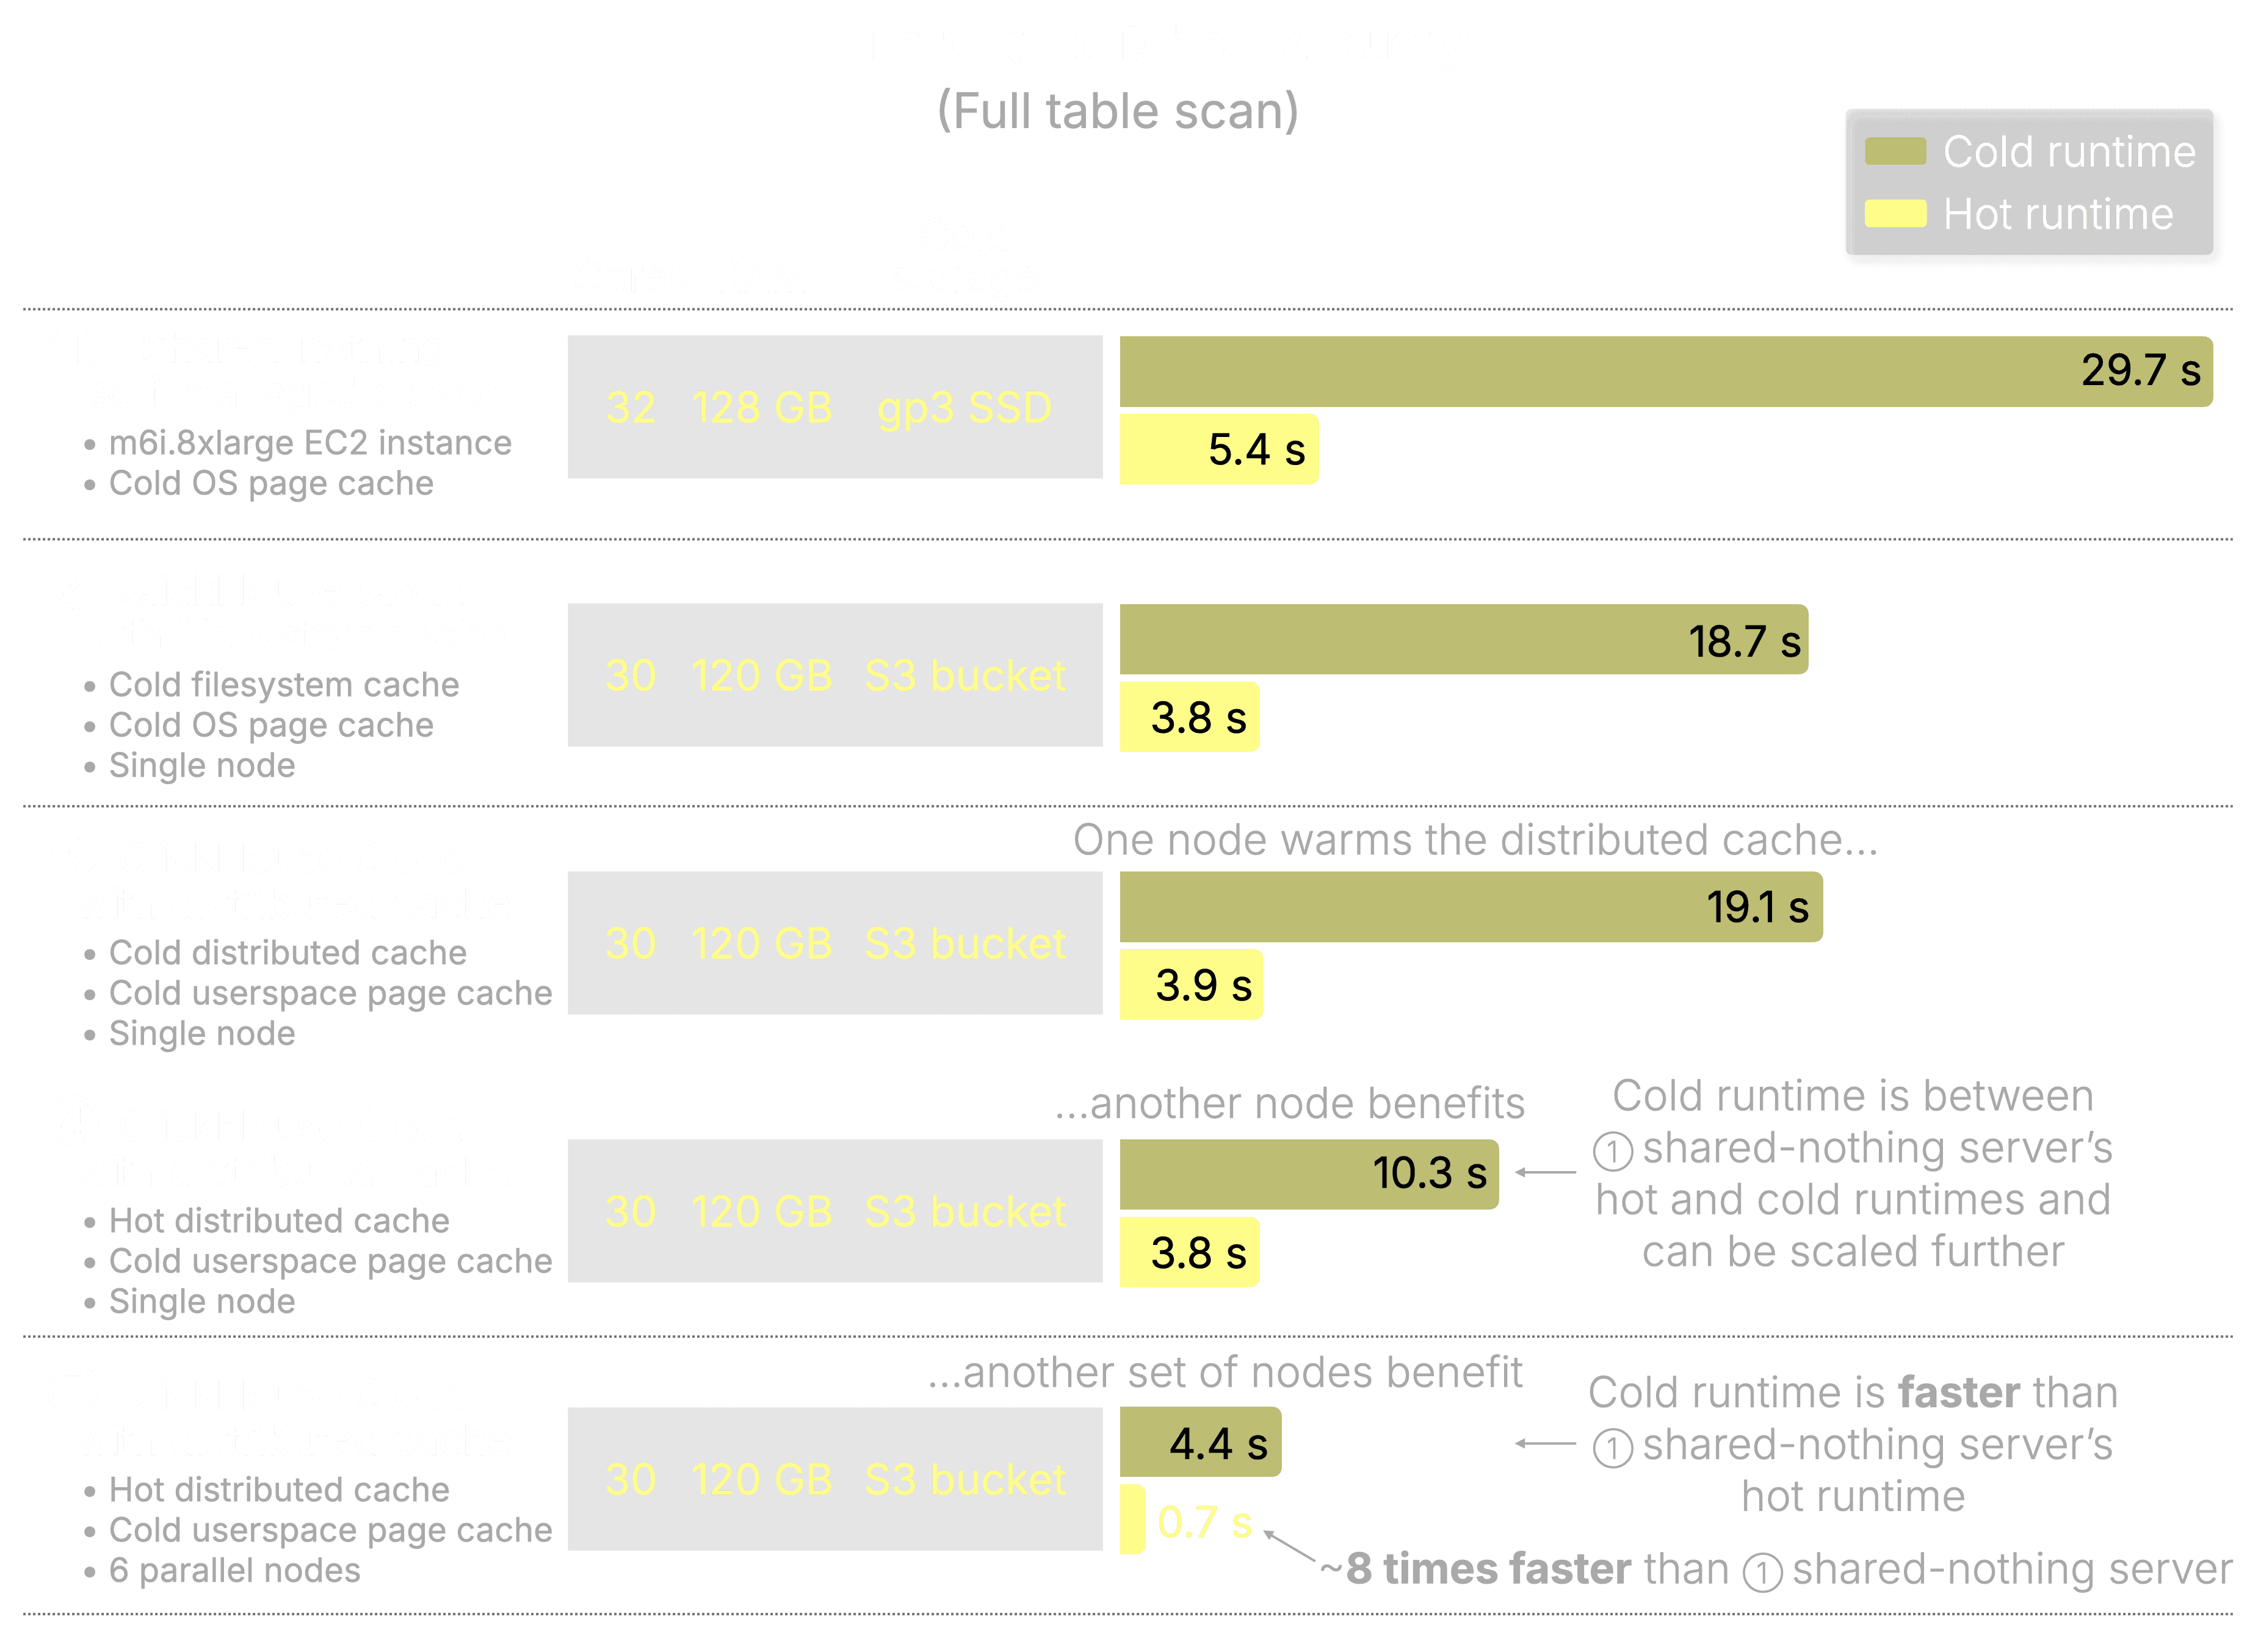
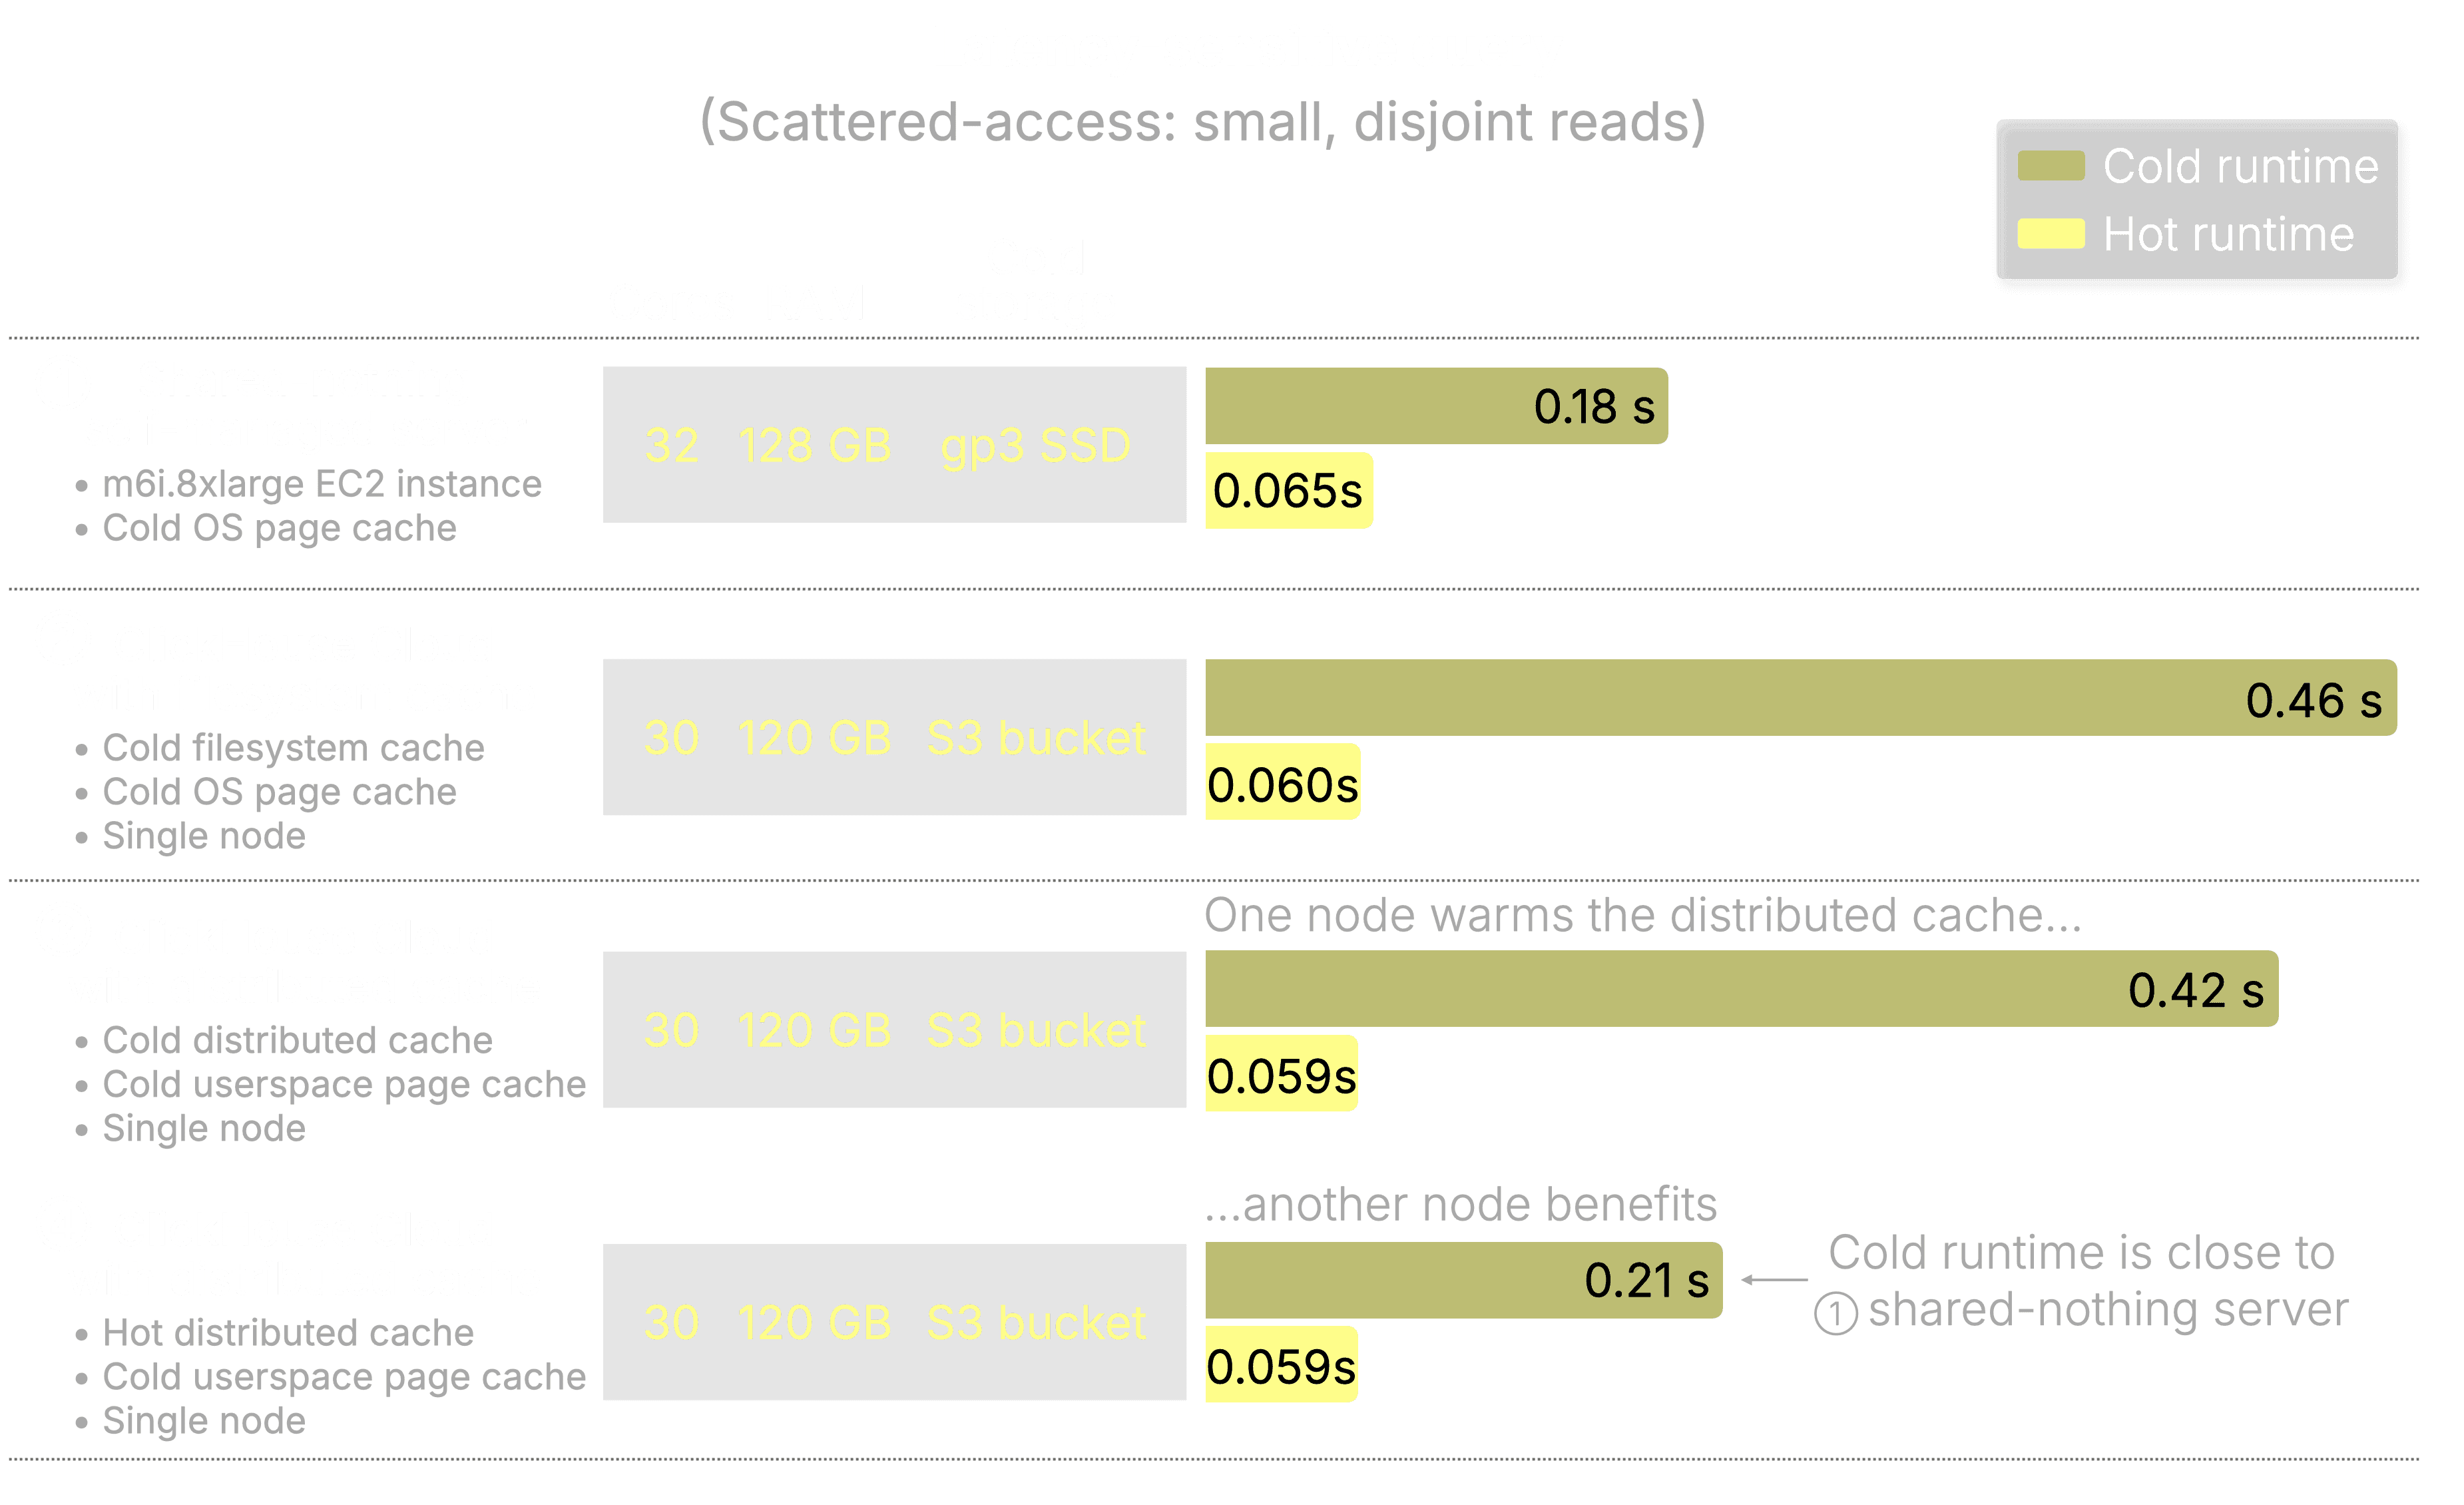
The key insight is that shared caching + elastic, stateless compute beats “fast disks”, even on cold starts. You get faster warm-ups, no repeated downloads from object storage, and the ability to scale compute up or down without throwing away hot data.
This is one of my favorite benchmarks this year because it shows a real architectural shift.
Cloud-native analytics doesn’t have to trade elasticity for performance anymore. You can have both.
The UPDATEs benchmark #
For a long time, one sentence followed ClickHouse around: “Great for analytics, but you can’t really do frequent fast updates.”
This benchmark is where that narrative finally broke.
Accompanied by a post, we benchmarked every UPDATE mechanism ClickHouse supports - classic mutations, on-the-fly mutations, ReplacingMergeTree inserts, and the new standard SQL UPDATEs, implemented as lightweight updates with patch parts - side by side, on the same dataset, hardware, and queries.
The headline result surprised a lot of people:
-
Standard SQL UPDATEs in ClickHouse are now up to 1,000× faster than classic mutations.
-
Bulk updates that used to take minutes now finish in milliseconds.
-
Single-row updates land in tens of milliseconds, comparable to inserts.
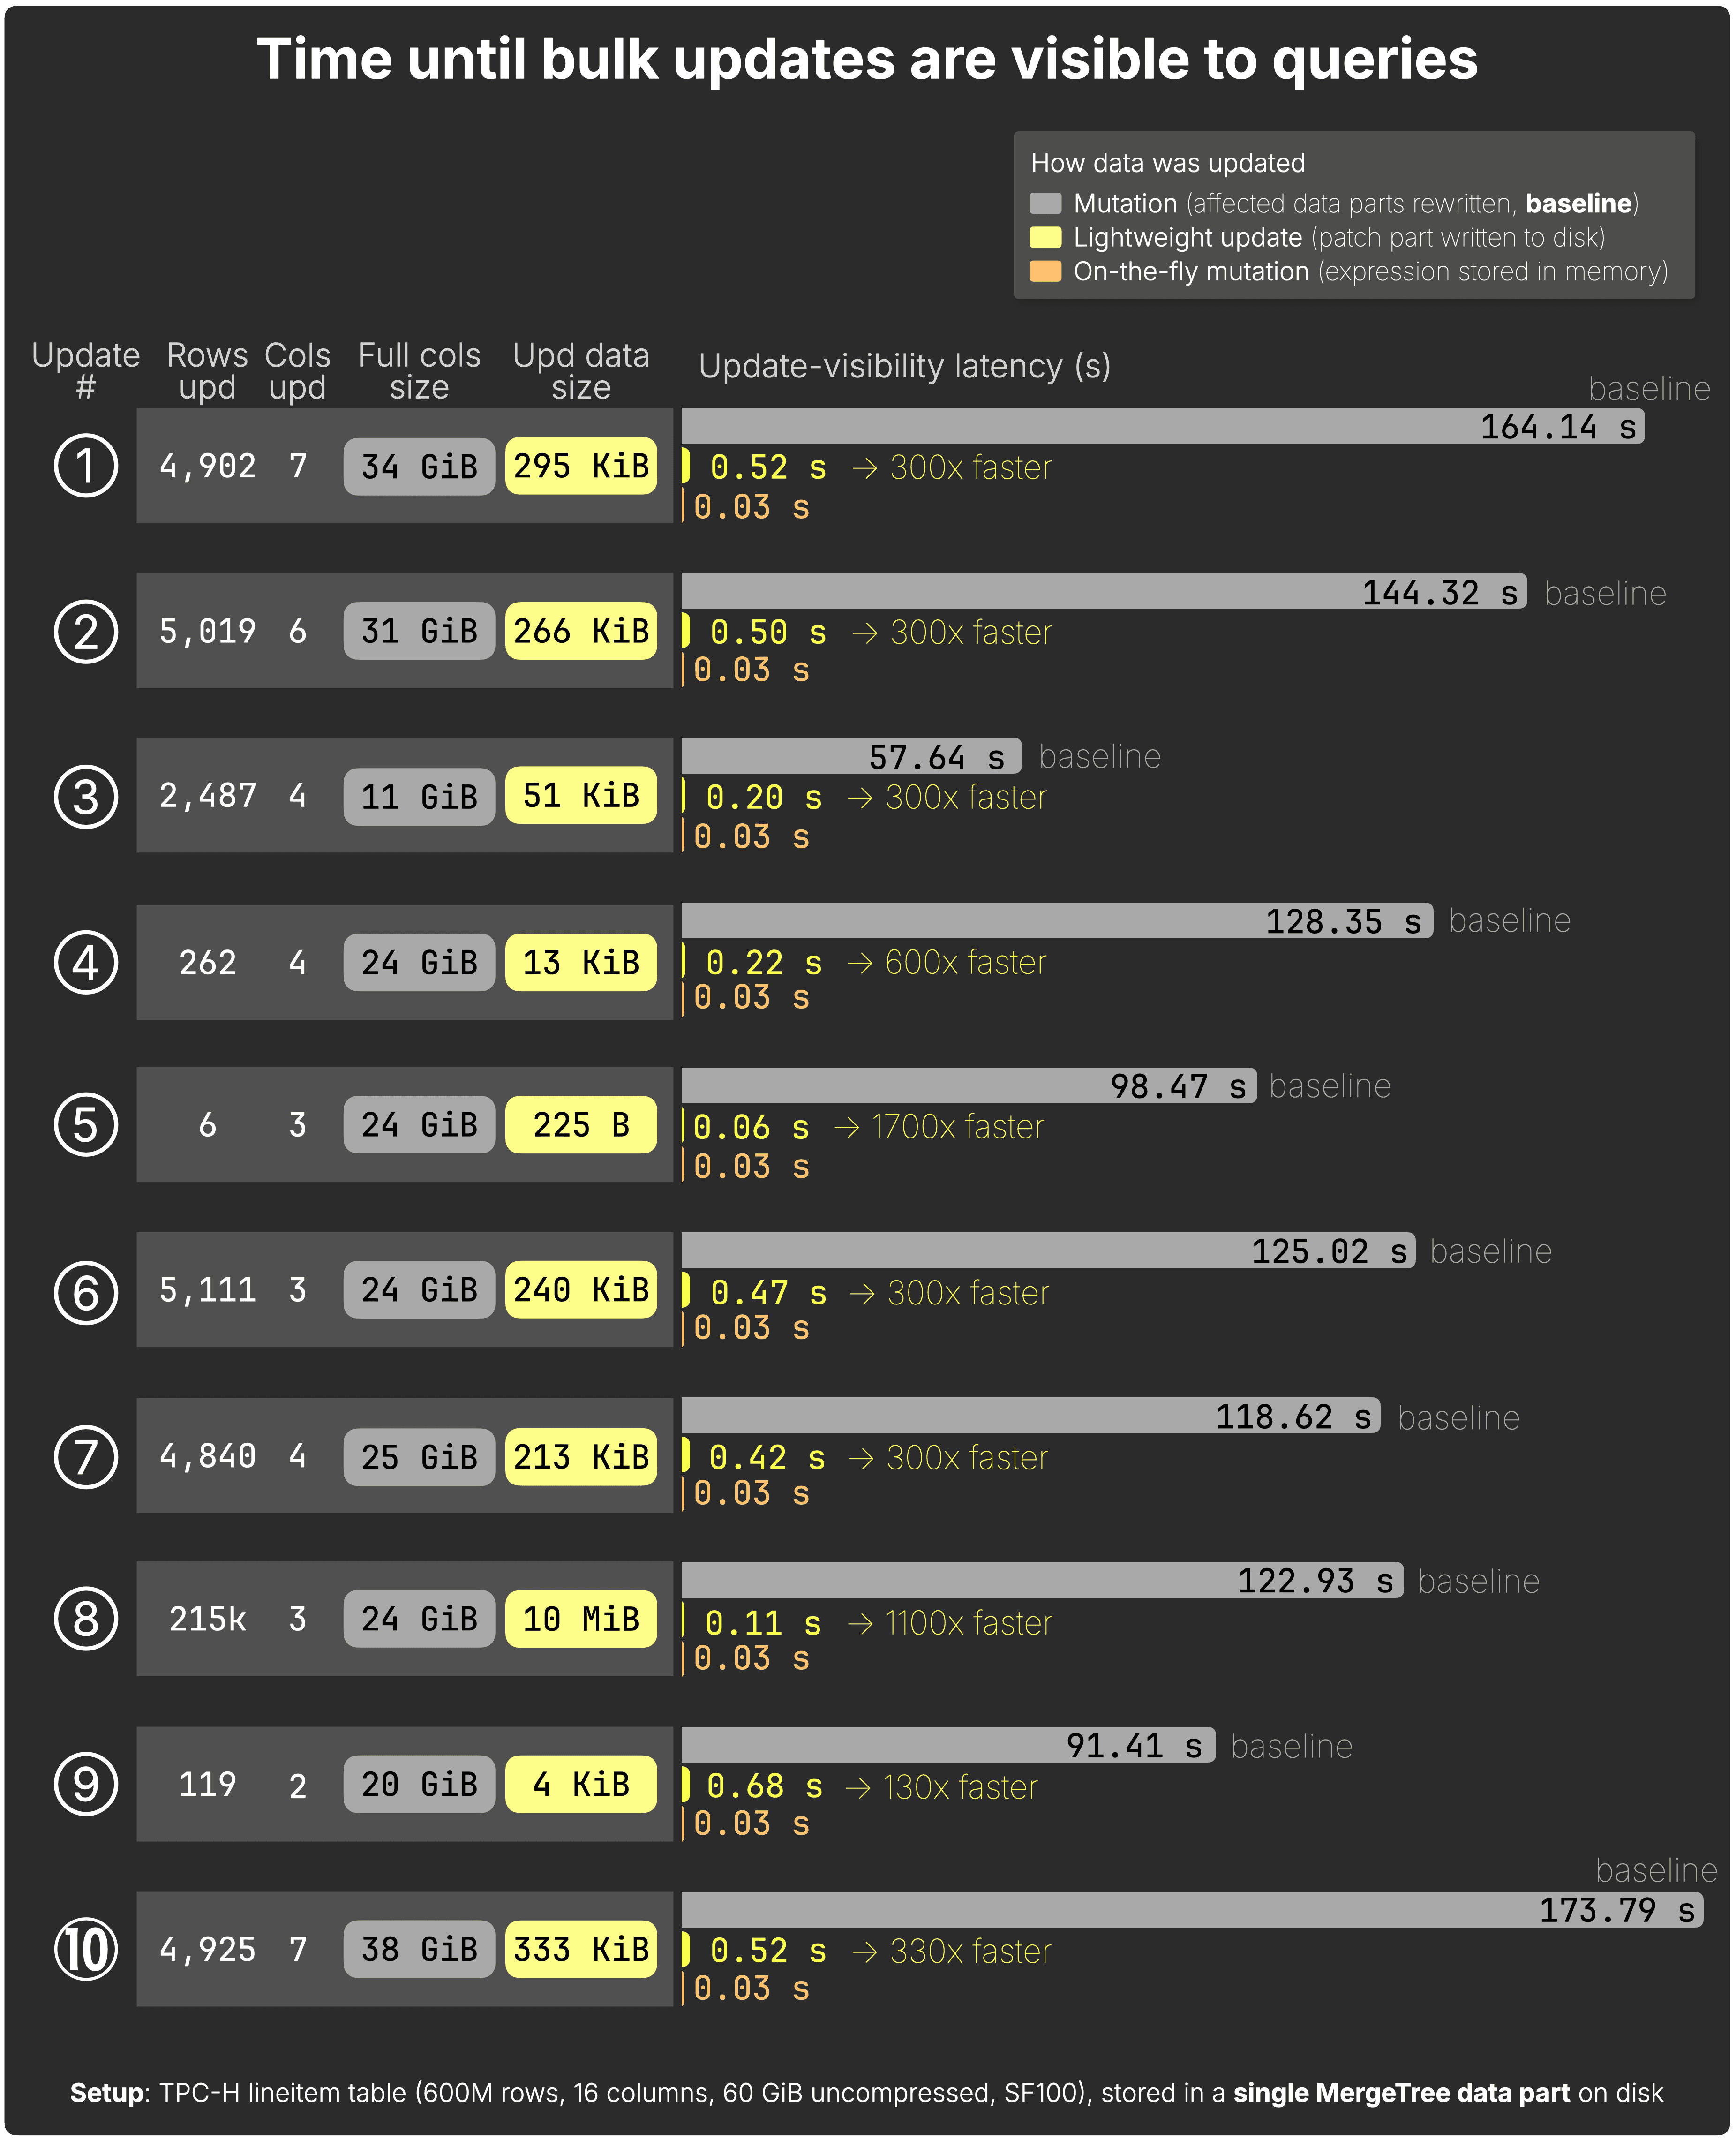
This is one of my favorite benchmarks this year because it changes how people think about ClickHouse.
You can now do frequent, fast updates using standard SQL, without giving up analytical performance, and without resorting to engine-specific workarounds.
The distributed GROUP BY benchmark #
This benchmark answers the question: how far can you scale the same GROUP BY execution model?
GROUP BY sits at the core of nearly every analytical query: powering observability dashboards, fueling conversation-speed AI, agent-facing analytics, and everything in between.
ClickHouse Cloud’s parallel replicas can scale a single GROUP BY query across all CPU cores of all available compute nodes.
To evaluate the performance impact, we benchmarked raw GROUP BY queries over datasets ranging from tens of millions to 100 billion and even 1 trillion rows, running the same query while progressively scaling from one node to hundreds of nodes in ClickHouse Cloud.
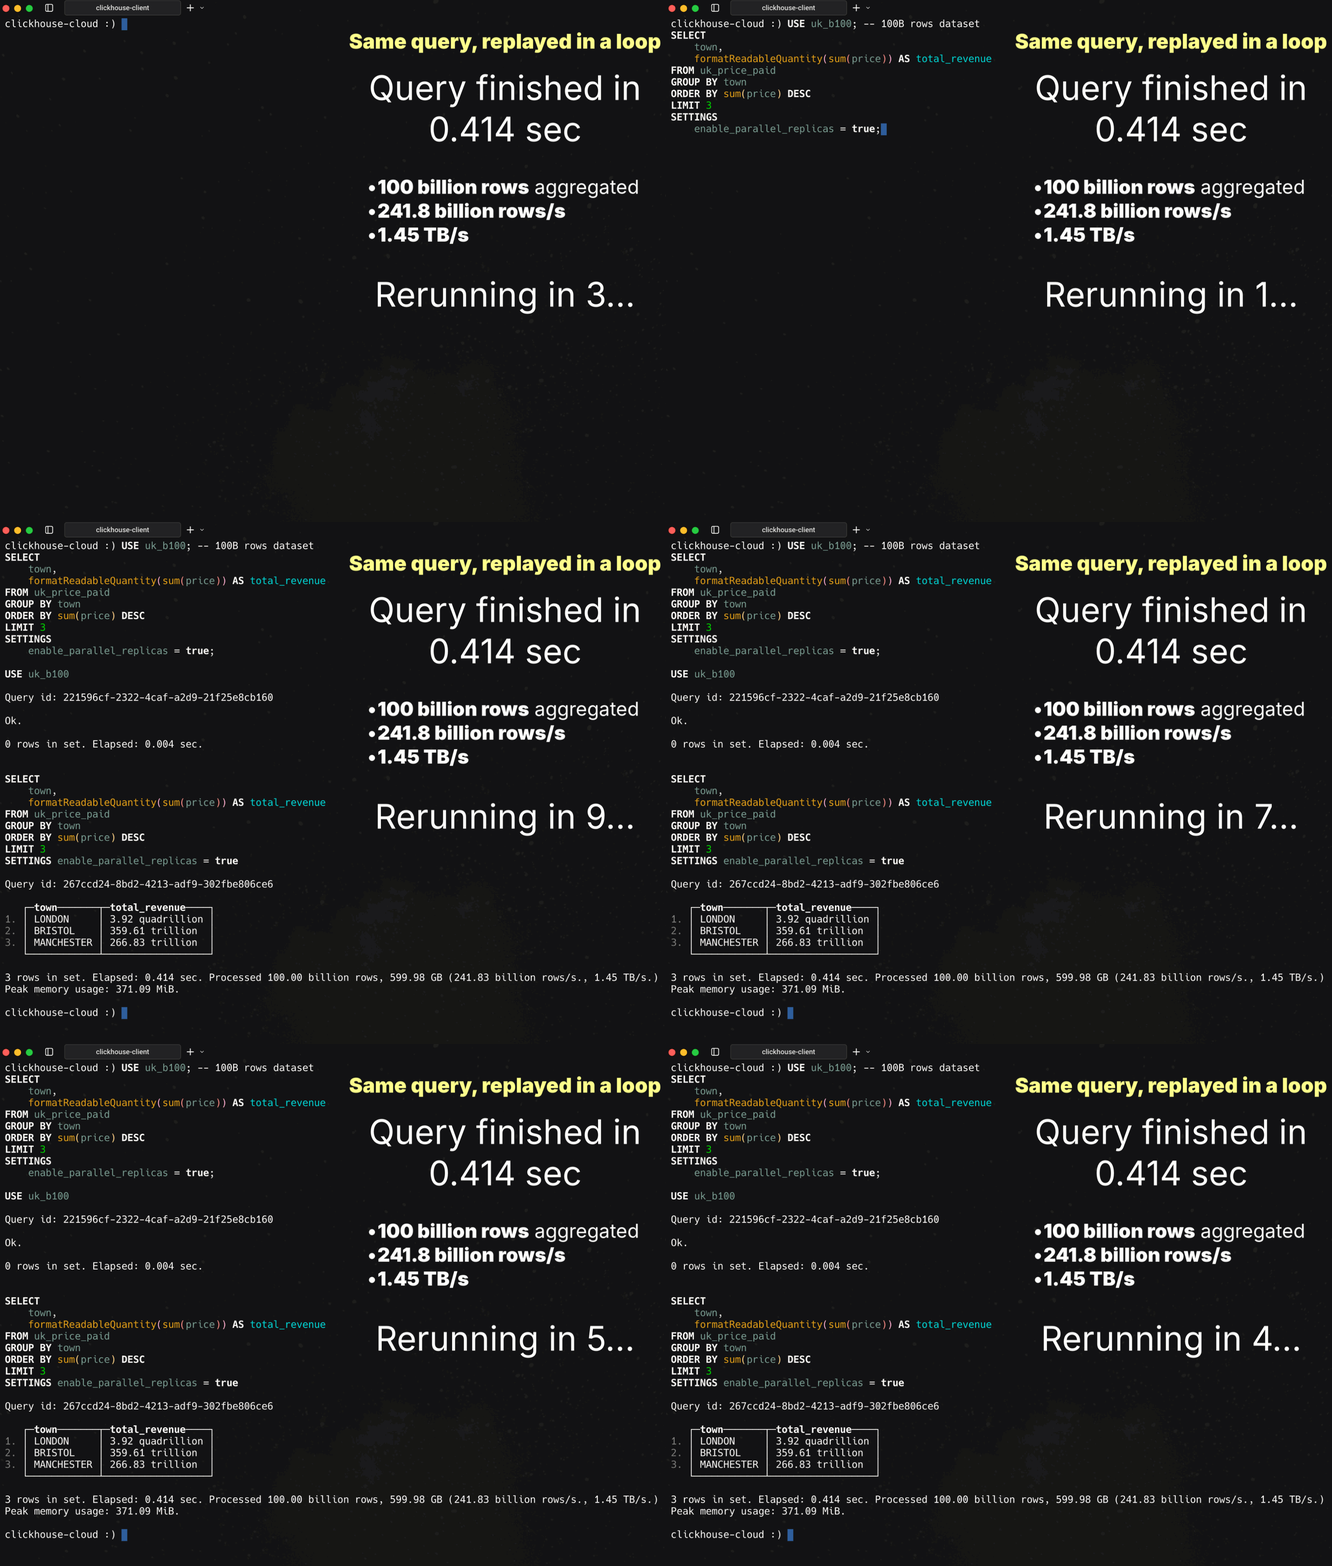
The result feels almost fake the first time you see it:
-
100 billion rows aggregated in ~0.4 seconds
-
~240 billion rows per second, over 1.4 TB/s of throughput
-
No pre-aggregation or data reshuffling
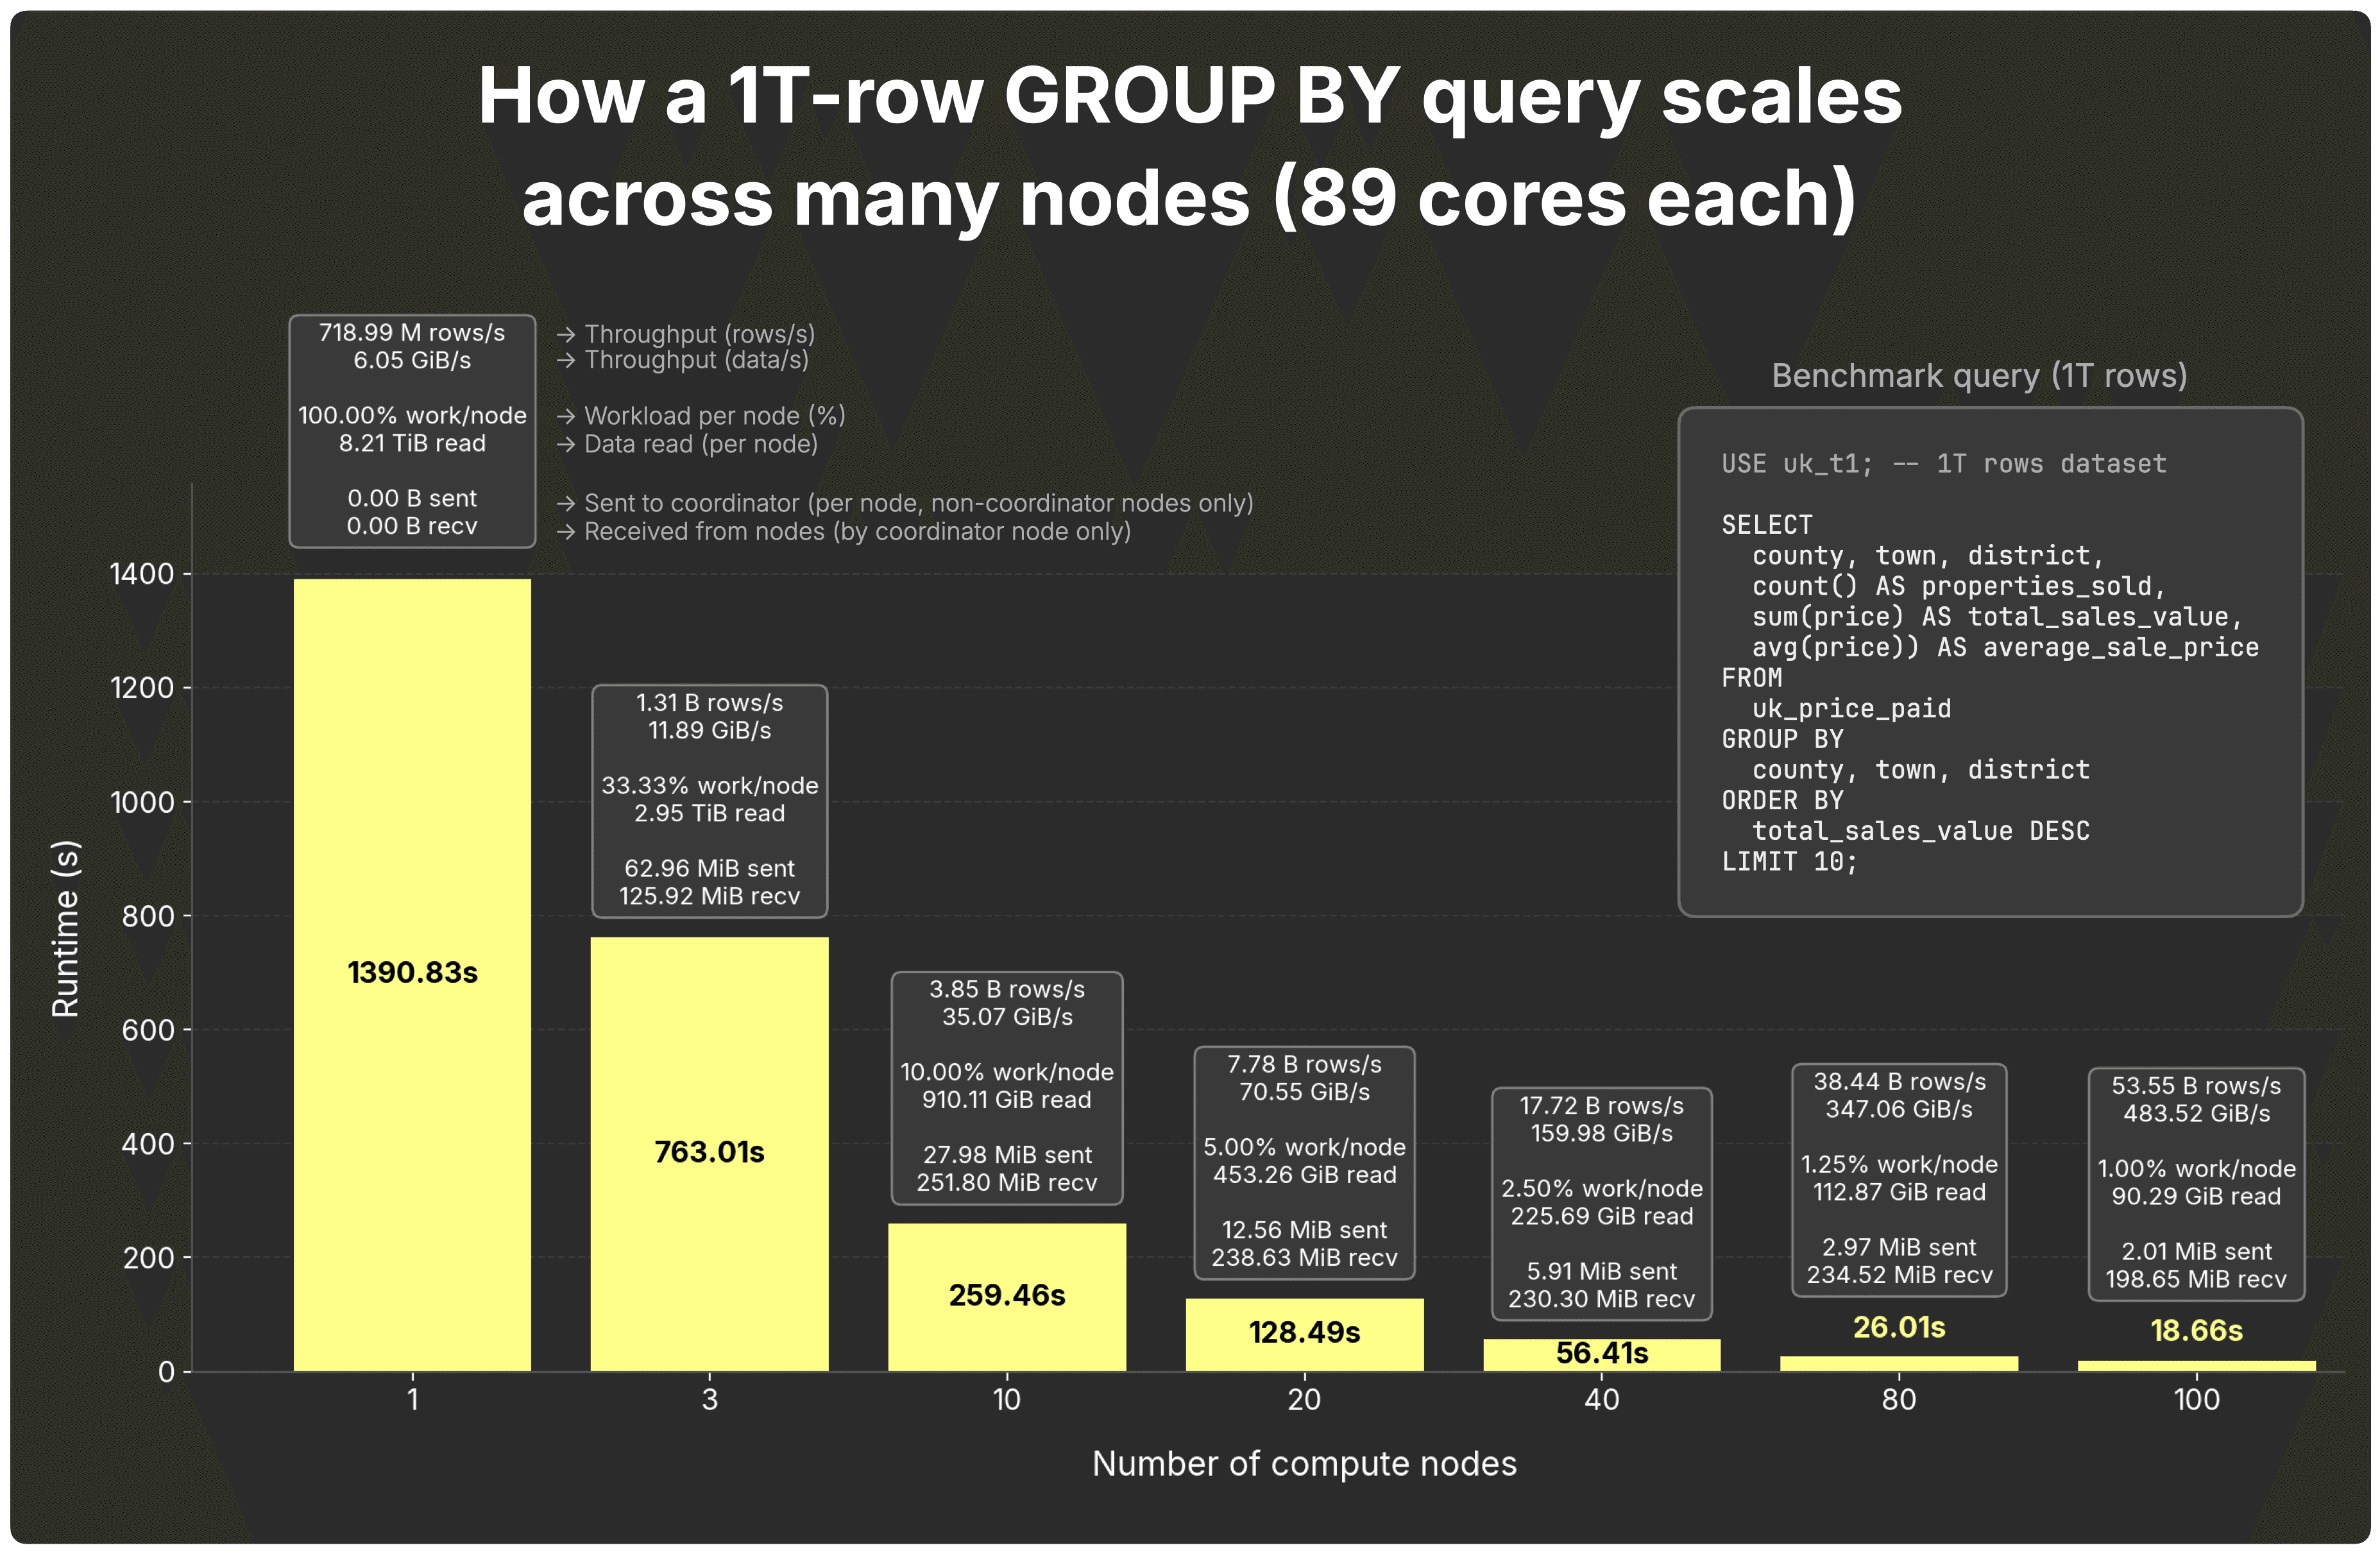
This is one of my favorite benchmarks this year because it shows how far technical elegance can scale.
Like a fountain pen or a well-designed Unix tool, ClickHouse does one thing exceptionally well: GROUP BY. The same execution model runs unchanged from a laptop to the cloud, and this benchmark shows the impact. You can take the operation that defines analytical speed and scale it across a fleet of machines without changing the query or the data model.
Honourable mention: The cloud warehouse cost–performance benchmark #
This benchmark zooms out from features entirely and asks a harder question: how does performance actually turn into cost in the cloud?
It gets an honourable mention because its scope is much broader than the others.
The benchmark started from a simple observation: headline prices are a terrible proxy for real-world cost. Different systems bill in different units, mapped to very different compute models, which makes price lists hard to compare, and easy to misinterpret.
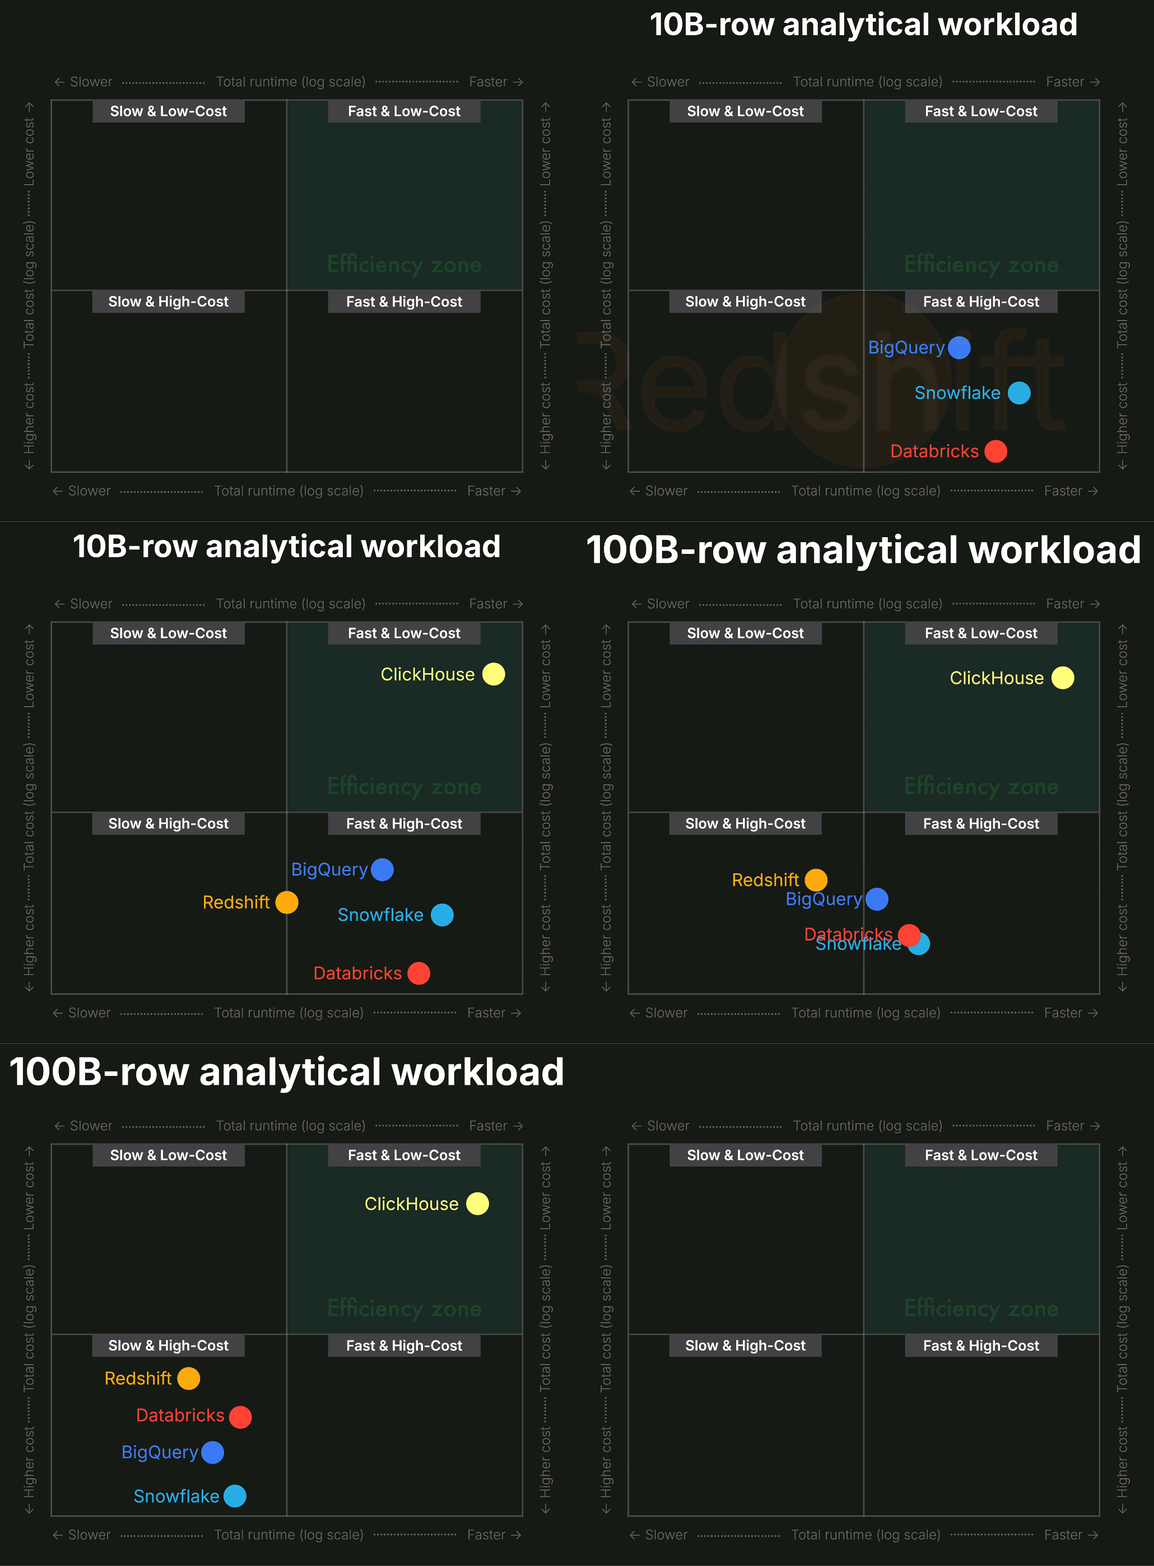
To make this concrete, we compared five major cloud warehouses using the same analytical workload at multiple scales, then translated raw runtimes into real costs based on each system’s billing model.
This benchmark is one of my favorites this year because it reframes the conversation.
Instead of arguing about list prices or pricing tiers, it shows that efficiency is the real currency. When you measure cost the same way systems actually bill for it, ClickHouse Cloud consistently delivers the most performance per dollar.
What a year of benchmarks taught me #
Looking back, the common thread across all this work is the role benchmarks play in cutting through assumptions.
They corrected narratives (“ClickHouse can’t do updates”), exposed trade-offs (latency vs. throughput, speed vs. cost), and validated architectural bets (columnar JSON, stateless cloud compute). In a few cases, they even escaped the blog and changed how real systems were built.
Over the past year, these benchmarks all pointed to the same conclusion: performance is about how efficiently an engine moves and processes data end-to-end. In practice, that showed up repeatedly:
- Fancy formats don’t matter without batching.
- Raw bandwidth doesn’t matter without latency control.
- Isolated caches don’t matter on elastic compute.
- The storage model doesn’t matter if updates avoid rewriting large amounts of data.
- More compute nodes don’t matter without a scalable execution model.
- Low list prices don’t matter without execution efficiency.
That’s why benchmarks keep showing up in my work: they’re how these end-to-end trade-offs become visible.
Next year, we’ll ship new features, new architectures, and new claims. And we’ll keep doing the same thing we did here: measure first, publish the results, and use the numbers to guide the conversation.


