TL;DR
ClickHouse used to fully scan secondary indexes before query execution.
Streaming secondary indices make index evaluation incremental and demand-driven, eliminating unnecessary upfront work and improving latency and memory usage.
Before: Sequential index scans #
Before ClickHouse 25.9, secondary indices (e.g., minmax, set, bloom filter, vector, text) were evaluated before reading the underlying table data.
The index entries are scanned upfront to decide which granules (the smallest processing units in ClickHouse, typically covering 8,192 rows each) may contain matching rows for a query’s WHERE filter.
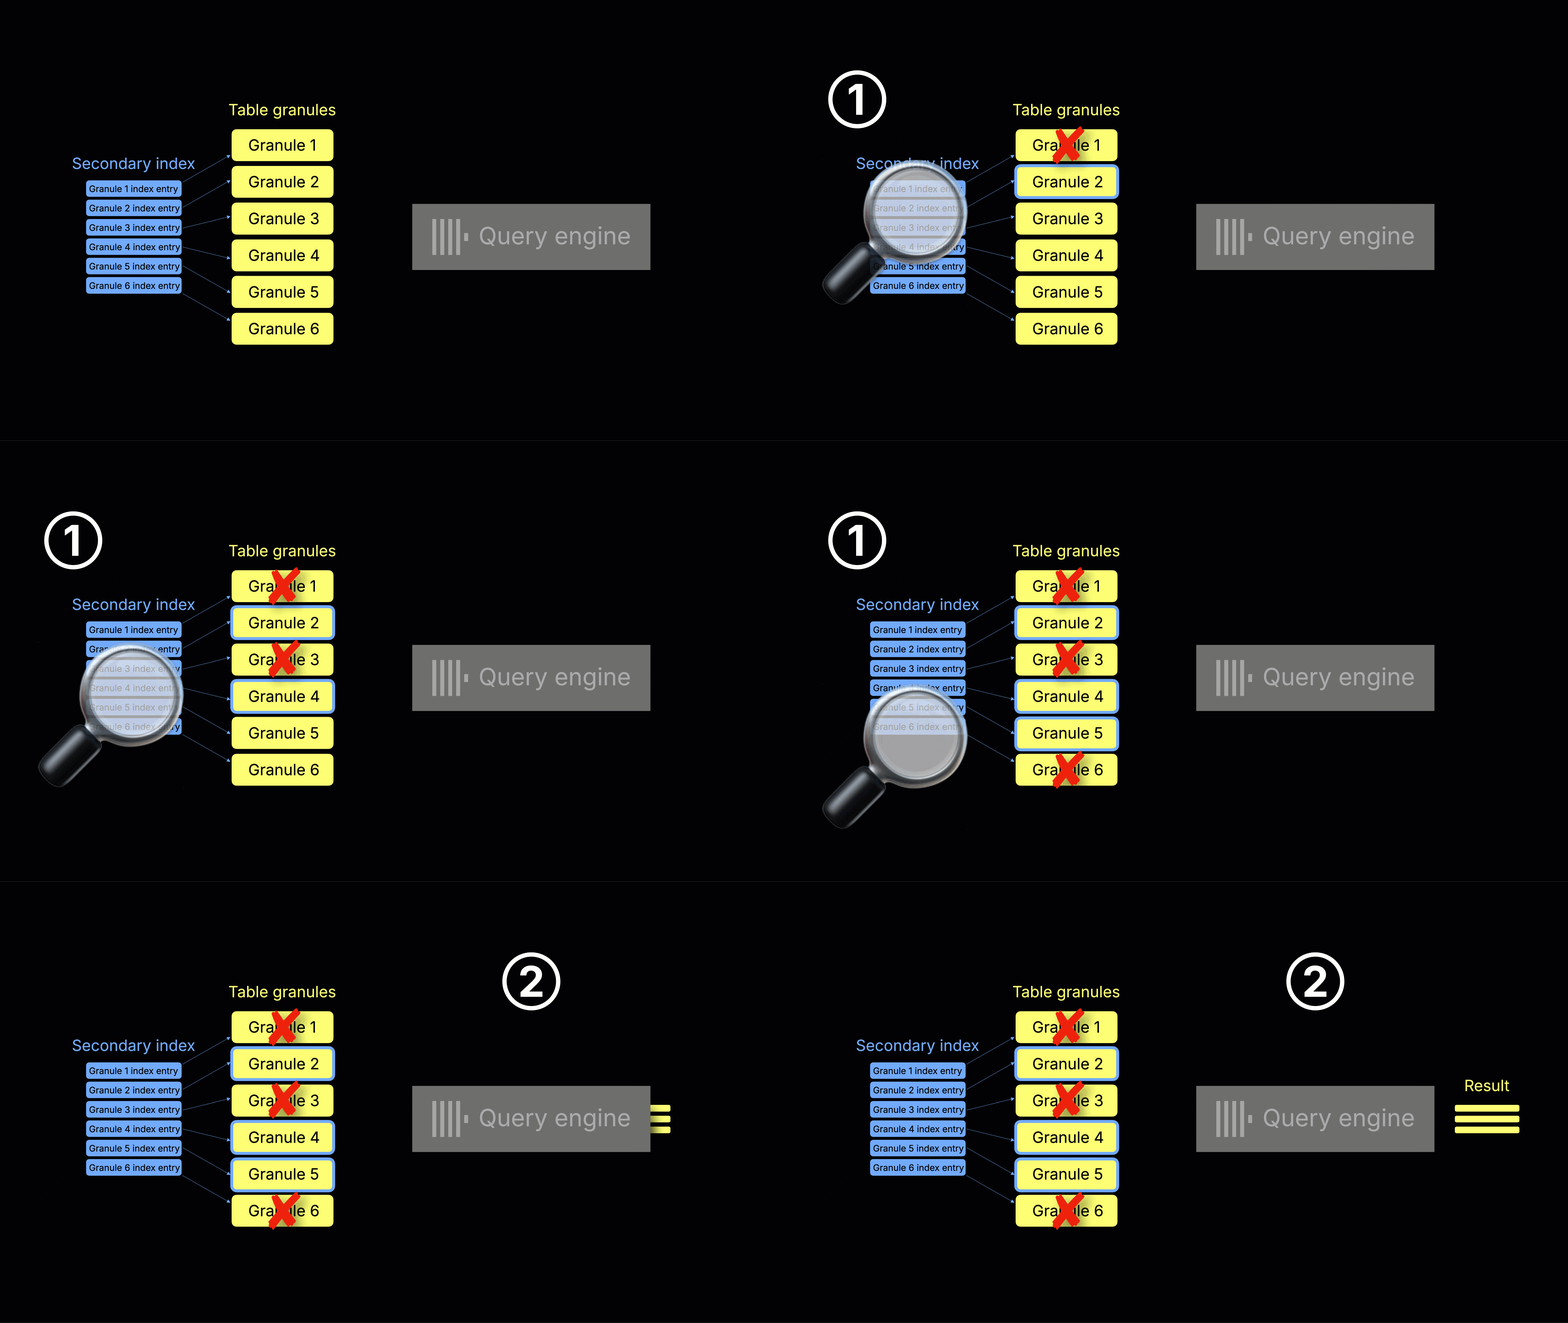
The following animation illustrates this process:

① Index scan and granule selection - ClickHouse checks each index entry to determine which granules to read. Only matching granules are chosen; the others are skipped.
② Query execution - The selected granules are streamed into the query engine and processed into the final result.
This upfront index evaluation has several drawbacks:
-
Startup delay: Index analysis happens before the actual query execution begins.
-
Heavy index scans: In some cases (e.g., queries with highly selective WHERE filters over huge tables), scanning the index can cost more than scanning and processing the selected data itself.
-
Inefficient with LIMIT: Even if a query stops early due to a LIMIT, ClickHouse still has to scan the entire index upfront (and may select more data than necessary).
How streaming secondary indices work #
ClickHouse 25.9 eliminates these drawbacks by interleaving data reads with index checks, as shown in the animation below:

① Index scan, granule selection, and ② query execution (concurrent) – When ClickHouse is about to read a table data granule (e.g. because it was selected by the primary index analysis), it first checks the corresponding secondary index entry (if one exists). If the secondary index indicates the table granule can be skipped, it’s never read. Otherwise, the granule is read and processed by the query engine, while scanning continues on subsequent granules.
This incremental, two-stream process—reading table granules alongside checking their secondary index entries—is why we call the feature streaming secondary indices (controlled by the setting use_skip_indexes_on_data_read) .
(Note: For simplicity, the animation shows a single-threaded query engine, but in reality multiple threads process many granules concurrently.)
This concurrent execution eliminates the startup delay and avoids wasted work. For example, with queries that stop early due to a LIMIT, ClickHouse halts index checks and granule reads as soon as the result is complete.
Demo: Faster results with streaming secondary indices #
In the release webinar, Alexey demonstrated streaming secondary indices on massive ClickHouse tables containing trillions of log records from test runs applied to pull requests and commits. On these datasets, some individual secondary indices alone exceed 6 TB compressed.
Since reproducing that scale isn’t practical, we’ll use a simplified artificial example that you can run yourself.
We ran the experiment on an AWS EC2 m6i.8xlarge instance (32 vCPUs, 128 GiB RAM).
First, we created a table with a String column and added a Bloom filter index on that column:
1CREATE TABLE test (
2  s String,
3  index s_idx s type bloom_filter(0.0001) granularity 1
4)
5ENGINE = MergeTree
6ORDER BY ()
7SETTINGS index_granularity = 1024;
Next, we inserted one billion rows:
1INSERT INTO test
2SELECT if(number % 1024 == 0, 'needle', randomPrintableASCII(64))
3FROM numbers_mt(1_000_000_000);
We can check that the bloom filter index has a size of over 2 GiB now:
1SELECT
2  name,
3  type_full,
4  formatReadableSize(data_uncompressed_bytes) AS size
5FROM system.data_skipping_indices
6WHERE database = 'default' AND table = 'test';
   ┌─name──┬─type_full────────────┬─size─────┐
1. │ s_idx │ bloom_filter(0.0001) │ 2.21 GiB │
   └───────┴──────────────────────┴──────────┘
To make the comparison fair, we cleared the OS page cache before each of the two test query runs below.
1echo 3 | sudo tee /proc/sys/vm/drop_caches >/dev/null
Without streaming indices (use_skip_indexes_on_data_read = 0), finding a single row with LIMIT 1 took ~10 seconds.
Note that we set max_threads = 1 and disabled the query condition cache to isolate and highlight the effect of secondary index processing.
1SELECT * FROM test WHERE s = 'needle' LIMIT 1
2SETTINGS
3  max_threads = 1,
4  use_query_condition_cache = 0,  use_skip_indexes_on_data_read = 0;
   ┌─s──────┐
1. │ needle │
   └────────┘

1 row in set. Elapsed: 10.173 sec. Processed 29.70 thousand rows, 2.14 MB (2.92 thousand rows/s., 210.00 KB/s.)
Peak memory usage: 8.90 MiB.
With streaming indices (use_skip_indexes_on_data_read = 1), the same query returned in ~2.4 seconds — over 4× faster with less memory used.
1SELECT * FROM test WHERE s = 'needle' LIMIT 1
2SETTINGS
3  max_threads = 1,
4  use_query_condition_cache = 0,  use_skip_indexes_on_data_read = 1;
   ┌─s──────┐
1. │ needle │
   └────────┘

1 row in set. Elapsed: 2.471 sec. Processed 29.70 thousand rows, 2.14 MB (12.02 thousand rows/s., 864.57 KB/s.)
Peak memory usage: 4.48 MiB.
Why this is faster in practice #
As a reminder, the observed speedup comes from two (① and ②) mechanisms:
-
Without streaming indices: Before query processing even begins, ClickHouse must fully scan and process the index to identify all matching granules.
-
With streaming indices:
① ClickHouse concurrently scans the index and processes matching granules in the query engine.
② And as soon as the first matching row (LIMIT 1) is found, it immediately stops scanning further index entries and granules, eliminating wasted work.
Key takeaway #
By checking indexes and reading data concurrently instead of sequentially, ClickHouse eliminates startup delays and stops immediately when LIMIT conditions are met, reducing both query time and memory usage. This is especially useful for early-exit queries on large tables.


