Real-world workloads, like dashboards, alerts, or interactive analytics, often run the same filters (WHERE conditions) over and over against the same data or against continuously growing data, as in observability scenarios. While ClickHouse is fast, these repeated scans can add up, especially when the filter is selective but doesn’t align well with the table’s primary index.
To address this, ClickHouse 25.3 introduces the query condition cache: a lightweight, memory-efficient way to cache which ranges of data matched (or didn’t match) a given filter. The cache operates at the granule level, allowing ClickHouse to skip large portions of data during repeated query execution, even if the overall query shape changes.
To celebrate the GA of our new JSON type, we’ll demonstrate how the query condition cache works using a real-world JSON dataset: a stream of JSON events scraped from Bluesky, a popular social media platform. Along the way, we’ll take a look under the hood at how ClickHouse processes data and how the query condition cache fits into that flow. Spoiler: it’s fast, compact, and surprisingly effective, even for something as niche as spotting pretzel emojis in posts.
Let’s dive in.
Setting the stage: Loading 100 million JSON events #
We start by creating a simplified table on a test machine with 32 CPU cores:
1CREATE TABLE bluesky
2(
3    data JSON(
4        kind LowCardinality(String),
5        time_us UInt64)
6)
7ORDER BY (
8    data.kind,
9    fromUnixTimestamp64Micro(data.time_us))
10SETTINGS index_granularity_bytes = 0;
Note: Setting index_granularity_bytes = 0 disables the adaptive granularity threshold.
Not recommended in production, used here only to get a fixed granule size for clarity.
Next, we load 100 million Bluesky events from 100 S3-hosted files into the table:
1INSERT INTO bluesky
2SELECT *
3FROM s3('https://clickhouse-public-datasets.s3.amazonaws.com/bluesky/file_{0001..0100}.json.gz', 'JSONAsObject')
4SETTINGS
5    input_format_allow_errors_num = 100,
6	input_format_allow_errors_ratio = 1,
7	min_insert_block_size_bytes = 0,
8    min_insert_block_size_rows = 20_000_000;
Note:
- The
input_format_allow_errors_*settings prevent ClickHouse from aborting on occasional malformed JSON docs. - The
min_insert_block_size_*settings help speed up ingest and reduce part merge load, but they increase memory usage. On lower-RAM systems, consider reducing the row threshold.
Before explaining the query condition cache, we’ll briefly detour into how ClickHouse organizes data for processing.
How ClickHouse organizes data for processing #
The table now has 5 data parts, totaling 100 million rows and 36 GiB of uncompressed data:
1SELECT
2    count() AS parts,
3    formatReadableQuantity(sum(rows)) AS rows,
4    formatReadableSize(sum(data_uncompressed_bytes)) AS data_size
5FROM system.parts
6WHERE active AND (database = 'default') AND (`table` = 'bluesky');
┌─parts─┬─rows───────────┬─data_size─┐
│     5 │ 100.00 million │ 35.87 GiB │
└───────┴────────────────┴───────────┘
For processing, the 100 million rows are divided into granules, the smallest units ClickHouse’s data processing mechanics work with. We can check how many granules each of the 5 data parts contains:
1SELECT
2    part_name,
3    max(mark_number) AS granules
4FROM mergeTreeIndex('default', 'bluesky')
5GROUP BY part_name;
┌─part_name───┬─granules─┐
│ all_9_9_0   │     1227 │
│ all_10_10_0 │     1194 │
│ all_8_8_0   │     1223 │
│ all_1_6_1   │     7339 │
│ all_7_7_0   │     1221 │
└─────────────┴──────────┘
Note: The components of these part names have specific meanings, which are documented here for those interested in exploring further.
By default, a granule has a size of 8192 rows. We can verify that for our table:
1SELECT avg(rows_in_granule)
2FROM mergeTreeIndex('default', 'bluesky');
┌─avg(rows_in_granule)─┐
│                 8192 │
└──────────────────────┘
Now that we’ve reviewed how ClickHouse organizes data for processing, we can look at a first example that benefits from the query condition cache.
A query that doesn’t benefit from the primary index #
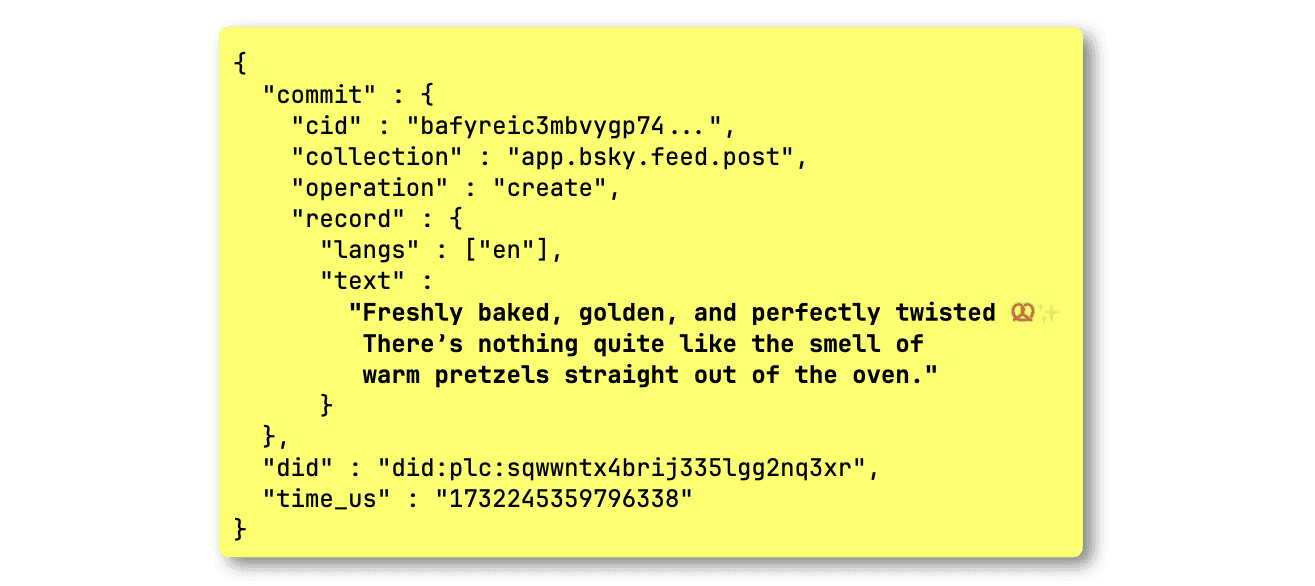
As a German living in Spain, I miss pretzels 🥨, so the next best thing is tracking social media posts about them. In our dataset, such a post event looks like this:

The following query counts all posts that include the pretzel emoji:
1SELECT count()
2FROM bluesky
3WHERE
4    data.kind = 'commit'
5    AND data.commit.operation = 'create'
6    AND data.commit.collection = 'app.bsky.feed.post'
7    AND data.commit.record.text LIKE '%🥨%';
┌─count()─┐
│      69 │
└─────────┘

1 row in set. Elapsed: 0.529 sec. Processed 99.46 million rows, 7.96 GB (187.85 million rows/s., 15.03 GB/s.)
Peak memory usage: 240.27 MiB.
Note that this query sees little benefit from the primary index—based on the kind and data.time_us JSON paths—and ends up scanning nearly the entire table.
Initial trace log analysis #
We instruct the ClickHouse server to return all trace-level log entries generated during the query’s execution:
1SELECT count()
2FROM bluesky
3WHERE
4    data.kind = 'commit'
5    AND data.commit.operation = 'create'
6    AND data.commit.collection = 'app.bsky.feed.post'
7    AND data.commit.record.text LIKE '%🥨%'
8SETTINGS send_logs_level='trace';
① <Trace> ...: Filtering marks by primary keys
① <Debug> ...: Selected ... 12141/12211 marks by primary key,
② <Debug> ...: 12141 marks to read from 10 ranges
③ <Trace> ...: Spreading mark ranges among streams
③ <Debug> ...: Reading approx. 99459072 rows with 32 streams
We can see that
- ① The primary index prunes almost no granules (visible as
marksin the trace logs) - ② ClickHouse needs to examine 12,141 granules across 10 data ranges (in the table's 5 data parts)
- ③ With 32 CPU cores, ClickHouse distributes these 10 ranges across 32 parallel processing streams
Re-running the query with the query condition cache #
Note: The query condition cache is not yet enabled by default. We’re still hardening its behavior, especially for edge cases like FINAL queries on ReplacingMergeTree and AggregatingMergeTree, before turning it on globally.
We run the same query with the query condition cache enabled:
1SELECT count()
2FROM bluesky
3WHERE
4    data.kind = 'commit'
5    AND data.commit.operation = 'create'
6    AND data.commit.collection = 'app.bsky.feed.post'
7    AND data.commit.record.text LIKE '%🥨%'
8SETTINGS use_query_condition_cache = true;
┌─count()─┐
│      69 │
└─────────┘

1 row in set. Elapsed: 0.481 sec. Processed 99.43 million rows, 7.96 GB (206.78 million rows/s., 16.54 GB/s.)
Peak memory usage: 258.10 MiB.
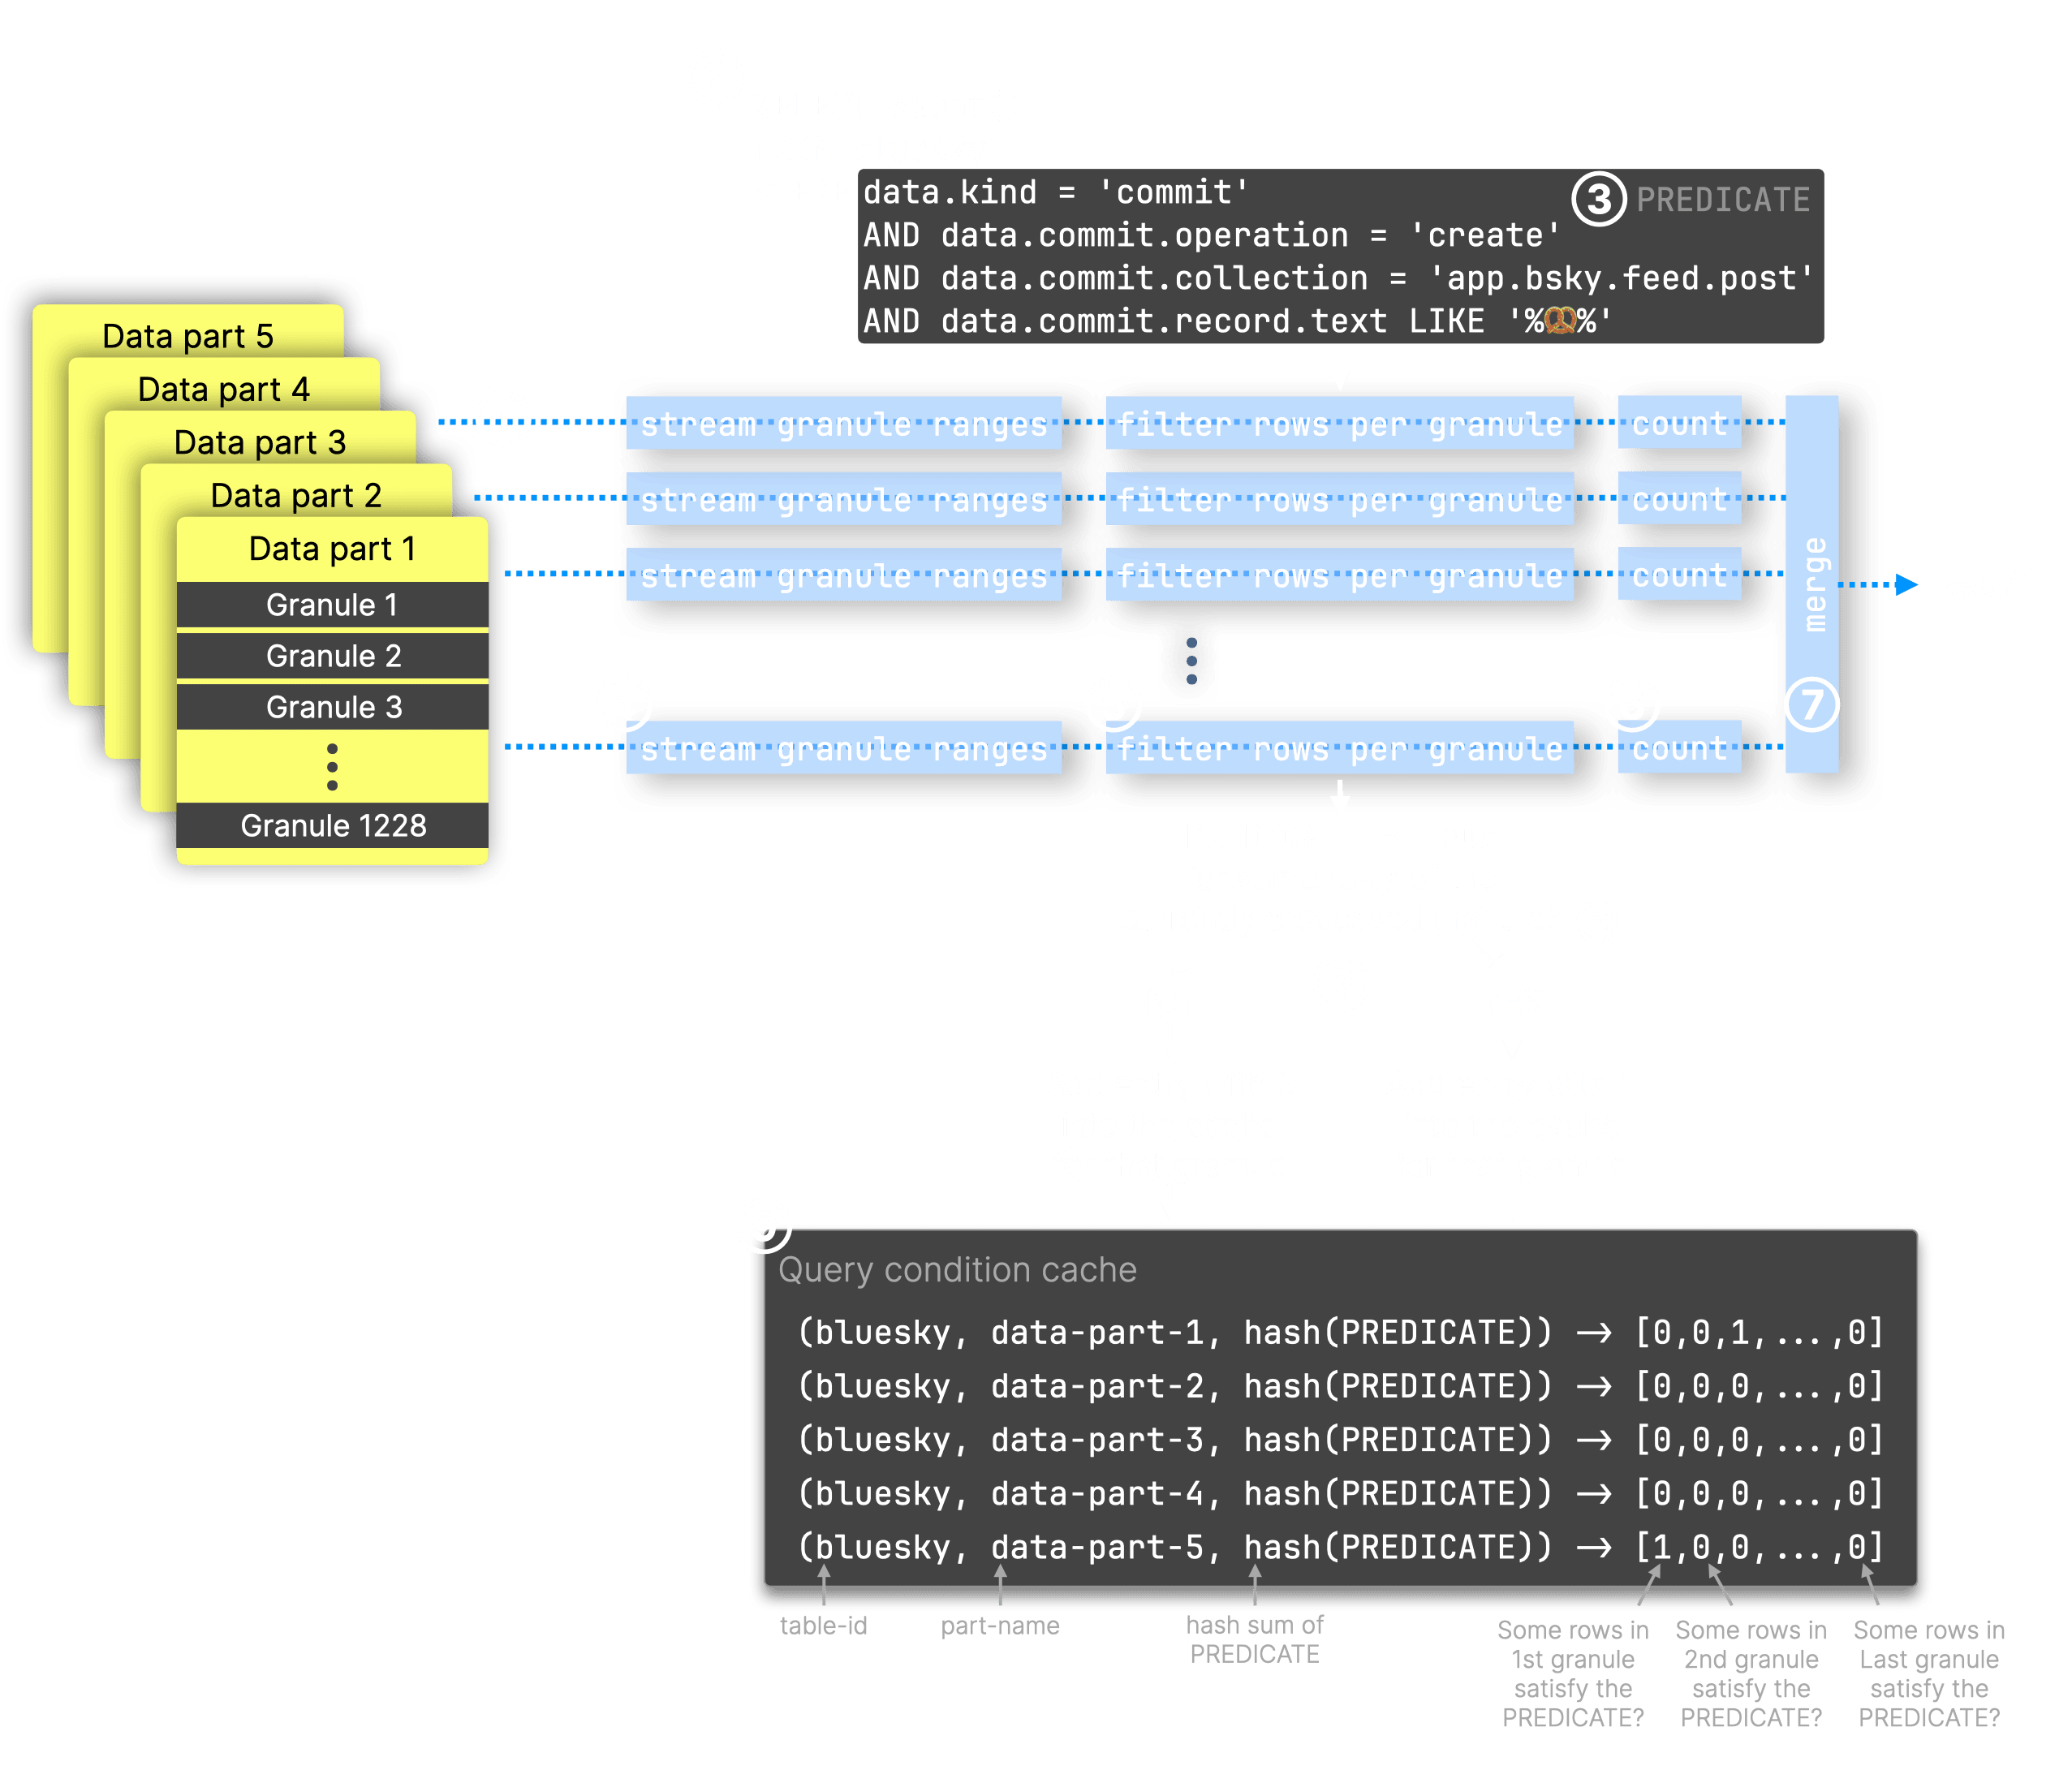
The query behaves the same, nearly a full table scan with similar runtime and memory usage. However, with the query condition cache enabled, ClickHouse now stores information about each examined granule in the cache. We illustrate this with a diagram:

As shown in the trace log entries above, the selected granules are ① streamed by 32 parallel processing streams (blue dashed lines in the diagram) into the query engine to run ② a query counting Bluesky events using ③ a predicate that filters for posts with a pretzel emoji. Each stream ④ handles specific granule ranges, ⑤ filters all rows in each granule using the query predicate, ⑥ counts matching rows, and all partial results are ⑦ merged into the final output.
During step ⑤, for every processed granule, ⑧ an entry is written to the ⑨ query condition cache: the cache key is formed from the table ID, the data part name the granule belongs to, and a hash of the query predicate. This maps to an array where each position corresponds to a granule’s index within the data part, and the value indicates whether none (0) or at least one (1) row matched the predicate. For selective filters (filters that let only a few rows pass), the array will contain lots of zeros.
⊛ We note that writing to and reading from the cache can become a performance issue itself if not done carefully. To avoid that the cache turns into a bottleneck, ClickHouse batches multiple granules and writes their matches into the cache at once.
Inspecting the query condition cache #
We can query that cache via the query_condition_cache system table:
1SELECT table_uuid, part_name, key_hash, matching_marks
2FROM system.query_condition_cache LIMIT 1 FORMAT Vertical;
table_uuid:     6f0f1c9d-3e98-4982-8874-27a18e8b0c2b
part_name:      all_9_9_0
key_hash:       10479296885953282043
matching_marks: [1,1,1,0,0,0, ...]
Comparing with and without the cache #
Now that the query condition cache is filled for the predicate of our first example query, we can run the query a second time with the query condition cache enabled:
1SELECT count()
2FROM bluesky
3WHERE
4    data.kind = 'commit'
5    AND data.commit.operation = 'create'
6    AND data.commit.collection = 'app.bsky.feed.post'
7    AND data.commit.record.text LIKE '%🥨%'
8SETTINGS use_query_condition_cache = true;
┌─count()─┐
│      69 │
└─────────┘

1 row in set. Elapsed: 0.037 sec. Processed 2.16 million rows, 173.82 MB (59.21 million rows/s., 4.76 GB/s.)
Peak memory usage: 163.38 MiB.
This time, the query runs significantly faster, ClickHouse scans only ~2 million rows instead of ~100 million. Thanks to the query condition cache, it skips all granules that contain no rows matching the query predicate.
Confirming cache hits in the trace log #
We can observe this with trace logging:
1SELECT count()
2FROM bluesky
3WHERE
4    data.kind = 'commit'
5    AND data.commit.operation = 'create'
6    AND data.commit.collection = 'app.bsky.feed.post'
7    AND data.commit.record.text LIKE '%🥨%'
8SETTINGS use_query_condition_cache = true, send_logs_level='trace';
① <Trace> ...: Filtering marks by primary keys
...
② <Debug> QueryConditionCache: Read entry for table_uuid:
        6f0f1c9d-3e98-4982-8874-27a18e8b0c2b, part: all_1_6_1,
        condition_hash: 10479296885953282043, ranges: [0,0,...]
...
② <Debug> ...: Query condition cache has dropped 11970/12138 granules for WHERE condition and(equals(data.kind, 'commit'_String), equals(data.commit.operation, 'create'_String), equals(data.commit.collection, 'app.bsky.feed.post'_String), like(data.commit.record.text, '%🥨%'_String)).
...
③ <Debug> ...: 168 marks to read from 73 ranges
④ <Trace> ...: Spreading mark ranges among streams
④ <Debug> ...: Reading approx. 1376256 rows with 18 streams
After ① the primary index prunes a few granules, ClickHouse checks the query condition cache, ② finds matching entries, and skips most granules. Instead of having to scan ~12,000 granules across 10 large ranges, it ③ needs to read just 168 granules across 73 smaller ones. Since only ~1.3 million rows need processing, ClickHouse ④ uses 18 instead of 32 streams on our machine with 32 CPU cores, each stream must justify its existence with enough work.
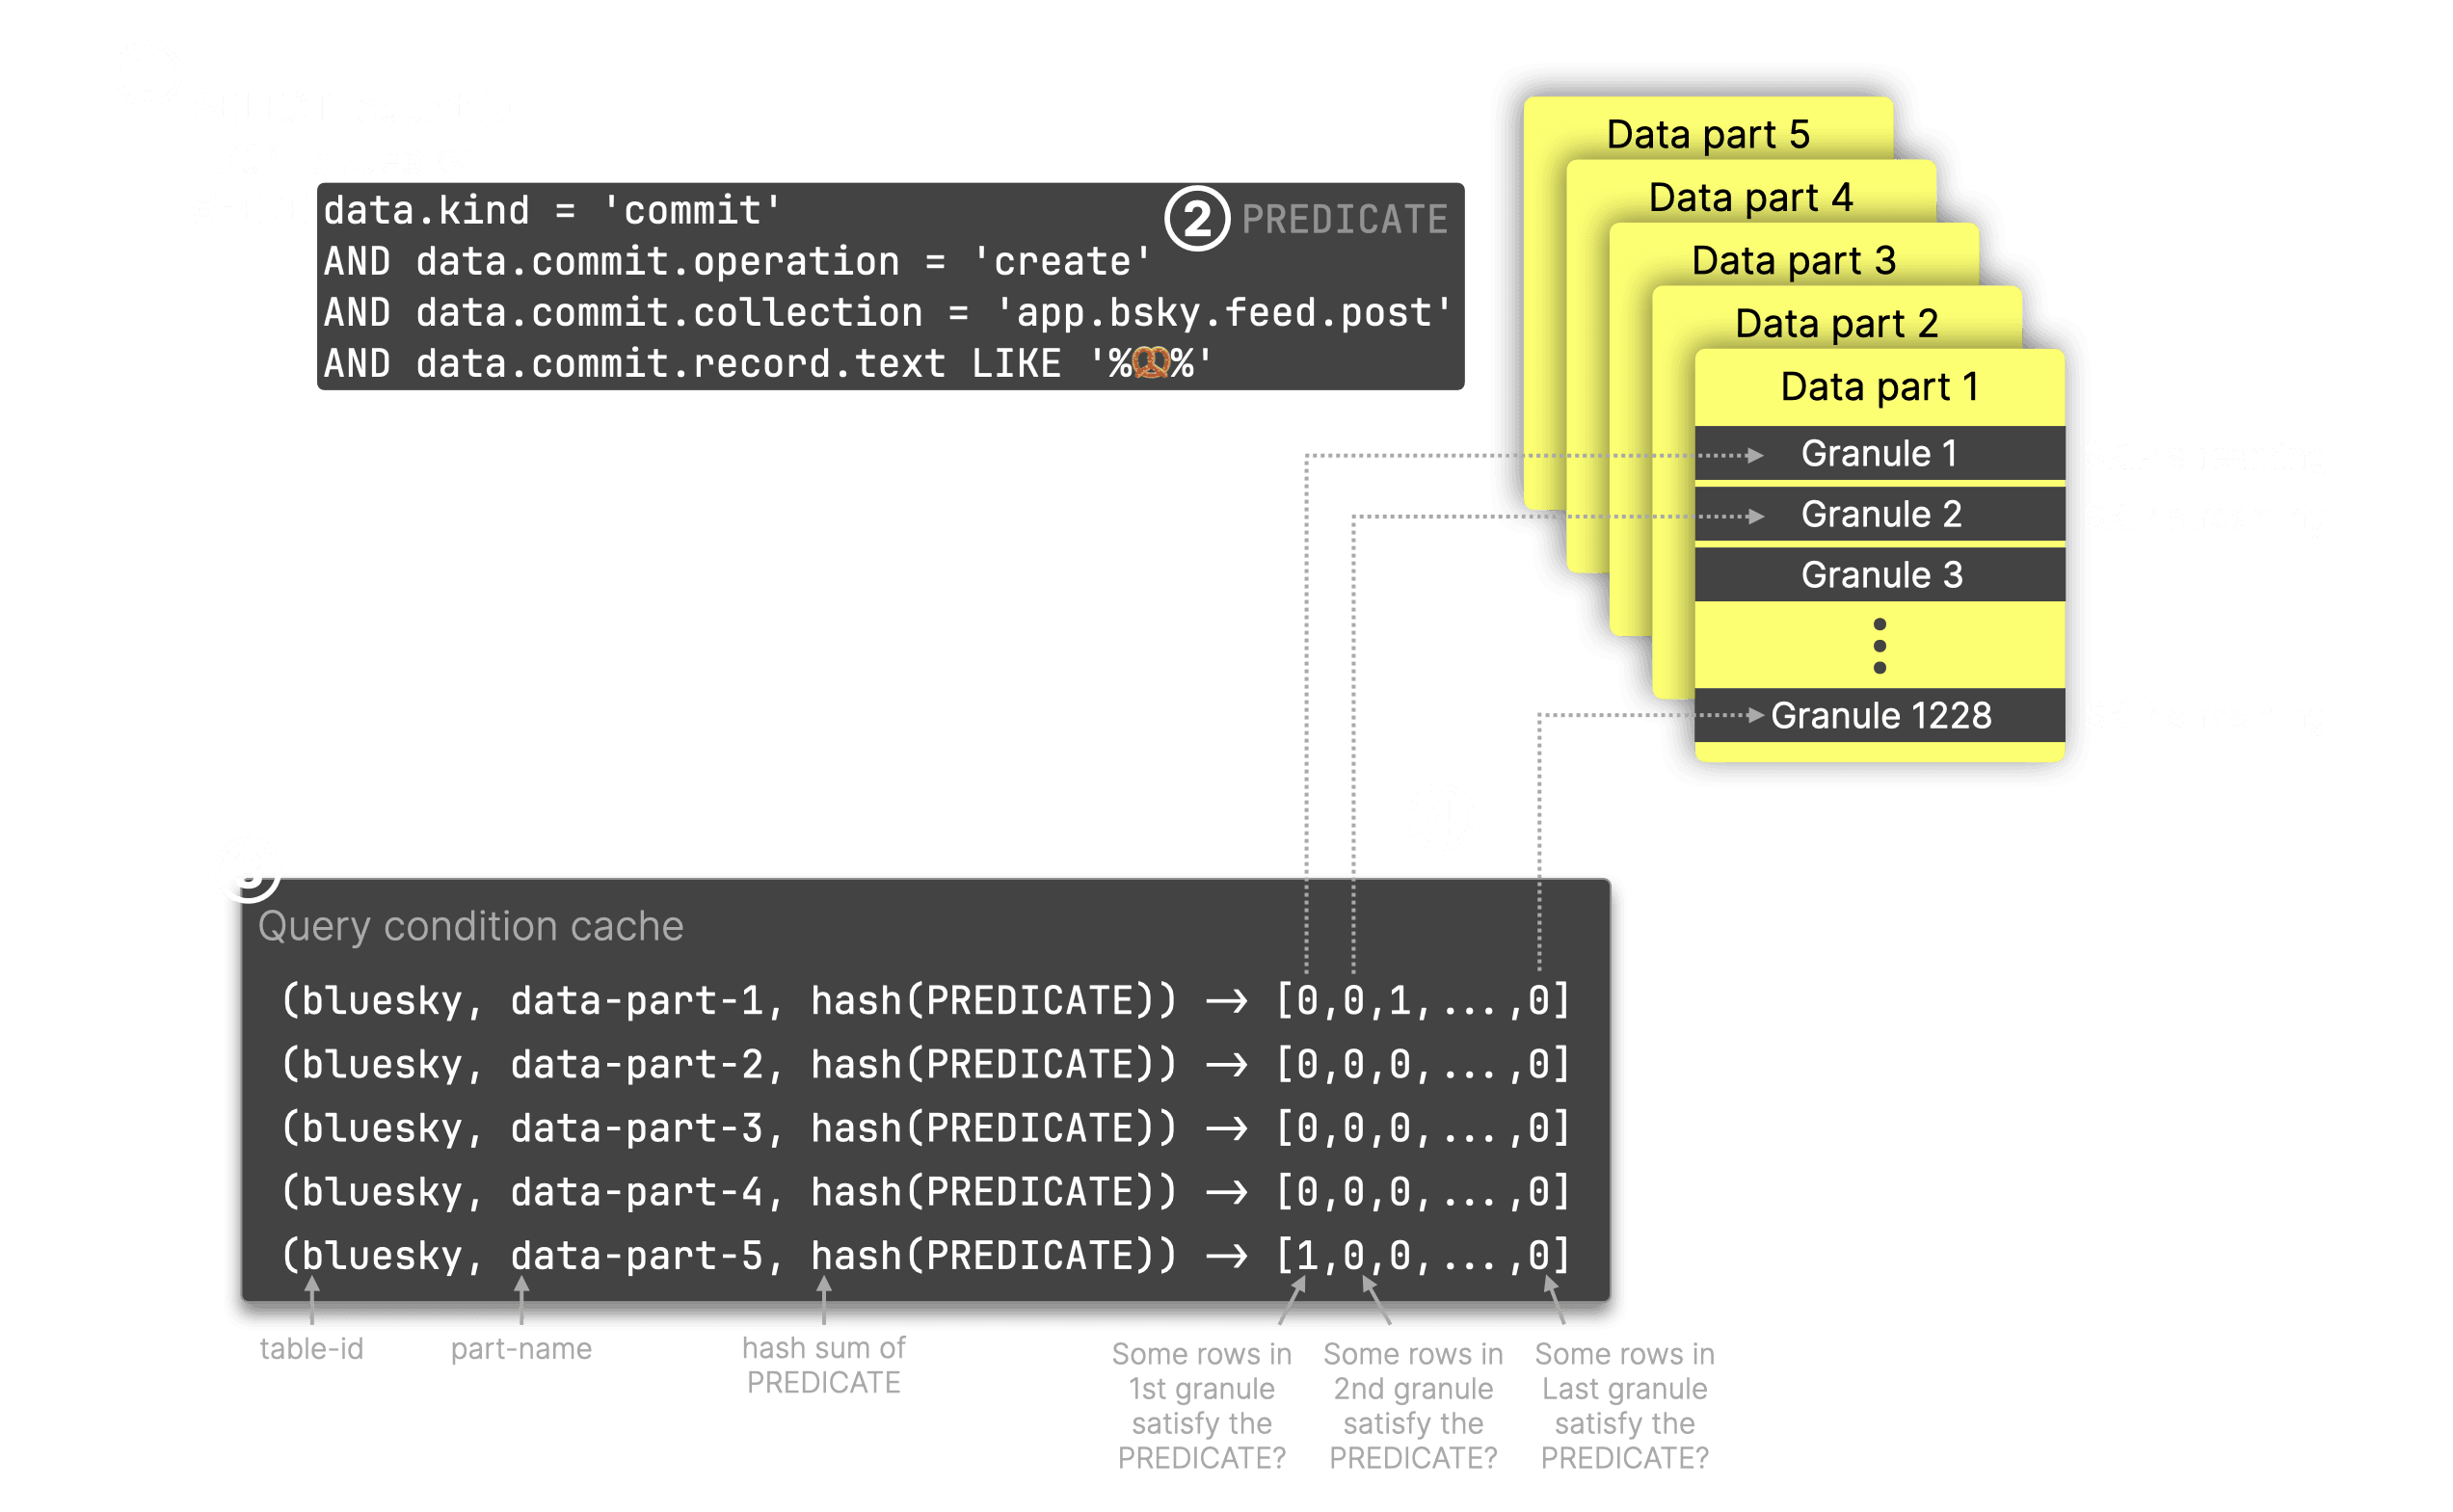
We illustrate this query condition cache–based granule pruning below:

For our ① query—given the table, its data parts, and ② the query predicate—ClickHouse finds matching entries in the ③ query condition cache. ④ All granules marked with a 0 can be skipped for processing.
Memory efficiency of the query condition cache #
Note that the query condition cache is highly memory-efficient, storing just one bit per filter condition and granule. Its size is configurable via query_condition_cache_size (default: 100 MB). At that 100 MB size, it can hold ~839 million (100 * 1024 * 1024 * 8) granule entries—each granule covering 8,192 rows—allowing up to 6.8 trillion rows with one column. In practice, this total is divided by the number of columns used in the filter. This stands in contrast to the query result cache, which maps queries to their complete result sets, typically consuming significantly more memory per cached entry.
Reusing the predicate: Top pretzel post languages #
The best part of the new query condition cache is that it operates at the level of the query predicate, not the full query. This means any query using the same predicate can benefit in the same way, regardless of what else the query is doing. In contrast, the query result cache stores complete results for entire queries, so it can’t (currently) be reused across different queries, even if they share the same filter logic.
We demonstrate the advantage with another pretzel post analysis query that returns the top post languages:
1SELECT
2    arrayJoin(CAST(data.commit.record.langs, 'Array(String)')) AS language,
3    count() AS count
4FROM bluesky
5WHERE
6    data.kind = 'commit'
7    AND data.commit.operation = 'create'
8    AND data.commit.collection = 'app.bsky.feed.post'
9    AND data.commit.record.text LIKE '%🥨%'
10GROUP BY language
11ORDER BY count DESC
12SETTINGS use_query_condition_cache = true;
┌─language─┬─count─┐
│ en       │    38 │
│ de       │    10 │
│ ja       │     8 │
│ es       │     5 │
│ pt       │     2 │
│ nl       │     1 │
│ zh       │     1 │
│ el       │     1 │
│ fr       │     1 │
└──────────┴───────┘

9 rows in set. Elapsed: 0.055 sec. Processed 1.08 million rows, 98.42 MB (19.83 million rows/s., 1.80 GB/s.)
Peak memory usage: 102.66 MiB.
A 55 ms runtime is impressively fast for a query that would otherwise scan the entire table. Thanks to the query condition cache entries created by the earlier query, ClickHouse can skip scanning most granules, and thus most rows.
As a comparison, we run the same query with the query condition cache disabled:
1SELECT
2    arrayJoin(CAST(data.commit.record.langs, 'Array(String)')) AS language,
3    count() AS count
4FROM bluesky
5WHERE
6    data.kind = 'commit'
7    AND data.commit.operation = 'create'
8    AND data.commit.collection = 'app.bsky.feed.post'
9    AND data.commit.record.text LIKE '%🥨%'
10GROUP BY language
11ORDER BY count DESC
12SETTINGS use_query_condition_cache = false;
┌─language─┬─count─┐
│ en       │    38 │
│ de       │    10 │
│ ja       │     8 │
│ es       │     5 │
│ pt       │     2 │
│ nl       │     1 │
│ zh       │     1 │
│ el       │     1 │
│ fr       │     1 │
└──────────┴───────┘

9 rows in set. Elapsed: 0.601 sec. Processed 99.43 million rows, 9.00 GB (165.33 million rows/s., 14.96 GB/s.)
Peak memory usage: 418.93 MiB.
Now, we’re back to an almost full table scan, as the query gains little benefit from the table’s primary index.
Reusing the predicate: Peak pretzel posting hours #
We wrap up the pretzel post analysis with a third query, again using the same predicate as before, that shows the most popular hours of the day for pretzel posts on Bluesky:
1SELECT
2    toHour(fromUnixTimestamp64Micro(data.time_us)) AS hour_of_day,
3    count() AS count,
4    bar(count, 0, 10, 30) AS bar
5FROM bluesky
6WHERE
7    data.kind = 'commit'
8    AND data.commit.operation = 'create'
9    AND data.commit.collection = 'app.bsky.feed.post'
10    AND data.commit.record.text LIKE '%🥨%'
11GROUP BY hour_of_day
12SETTINGS use_query_condition_cache = true;
┌─hour_of_day─┬─count─┬─bar──────────────────────┐
│           0 │     2 │ ██████                   │
│           1 │     6 │ ██████████████████       │
│           2 │     6 │ ██████████████████       │
│           3 │     6 │ ██████████████████       │
│           4 │     1 │ ███                      │
│           5 │     4 │ ████████████             │
│           6 │     3 │ █████████                │
│           7 │     3 │ █████████                │
│           9 │     6 │ ██████████████████       │
│          10 │     8 │ ████████████████████████ │
│          16 │     2 │ ██████                   │
│          17 │     2 │ ██████                   │
│          18 │     4 │ ████████████             │
│          19 │     2 │ ██████                   │
│          20 │     2 │ ██████                   │
│          21 │     3 │ █████████                │
│          22 │     2 │ ██████                   │
│          23 │     7 │ █████████████████████    │
└─────────────┴───────┴──────────────────────────┘

Query id: 5ccec420-6f13-43c2-959e-403054d9243a

18 rows in set. Elapsed: 0.036 sec. Processed 884.74 thousand rows, 78.37 MB (24.38 million rows/s., 2.16 GB/s.)
Peak memory usage: 83.42 MiB.
Confirming cache hits in the query log #
Instead of inspecting trace logs we can query the query_log system table (using the Query id returned for the run above) for verifying if the query benefitted from the query condition cache:
1SELECT
2    ProfileEvents['QueryConditionCacheHits'] AS num_parts_with_cache_hits,
3    ProfileEvents['QueryConditionCacheMisses'] AS num_parts_with_cache_misses
4FROM system.query_log
5WHERE
6    type = 'QueryFinish'
7    AND query_id = '5ccec420-6f13-43c2-959e-403054d9243a';
┌─num_parts_with_cache_hits─┬─num_parts_with_cache_misses─┐
│                         5 │                           0 │
└───────────────────────────┴─────────────────────────────┘
For all 5 data parts of the queried table ClickHouse found entries in the cache.
Wrapping up #
The query condition cache is a small but powerful addition to ClickHouse. It quietly boosts performance behind the scenes—especially for repeated queries with selective filters—without requiring any changes to your schema or manual index tuning. Whether you’re building dashboards, analyzing event streams, or tracking snacks on social media in a JSON firehose, the query condition cache helps ClickHouse do less work and get results faster.
Give it a try, we think you’ll be pleasantly surprised.


