50.4k
50.4k
Summary
- ClickHouse Open House 2026 Day 1 brought announcements across ClickHouse Cloud, Postgres, distributed query execution, AI agents, observability, and lakehouse interoperability.
- ClickHouse Postgres moves to public beta delivering over 5x more transactions per second than AWS RDS; multi-stage distributed queries cut TPC-H SF100 runtime from 117.6 seconds to 54.7 seconds; Langfuse V4 delivers 200x query performance improvements.
- ClickHouse Agents powered by Claude entered public beta with a native chat experience and no-code agent builder; enabling bi-directional workflows between ClickHouse and external lakehouse systems.
Today at Open House 2026 in San Francisco, we shared a broad set of announcements across ClickHouse Cloud, AI agents, observability, Postgres, and lakehouse interoperability.
Open House has always been a chance for our users to come together and exchange ideas about where real-time data systems are heading, and this year’s launches reflect many of the conversations we’ve been having with users, contributors, customers, and partners over the last year. This post rounds up the major announcements from Day 1, and tomorrow we’ll be back with another set of announcements from Day 2.
Improving the UX for humans and agents
ClickHouse Cloud is now serving two audiences: the teams that operate it in production and the AI agents that query it programmatically. These product updates bring improvements across resilience, observability, schema management, and developer tooling to make ClickHouse Cloud easier to operate and easier to build on.
Cross-Region Replication brings an active-passive failover architecture to ClickHouse Cloud. Data is synchronously replicated to a secondary region, with recovery time measured in minutes and recovery point measured in seconds. We will begin a limited private preview later this year.
Monitoring v2 overhauls observability with opinionated service health signals, schema exploration, query insights, and mutation tracking all in one place.
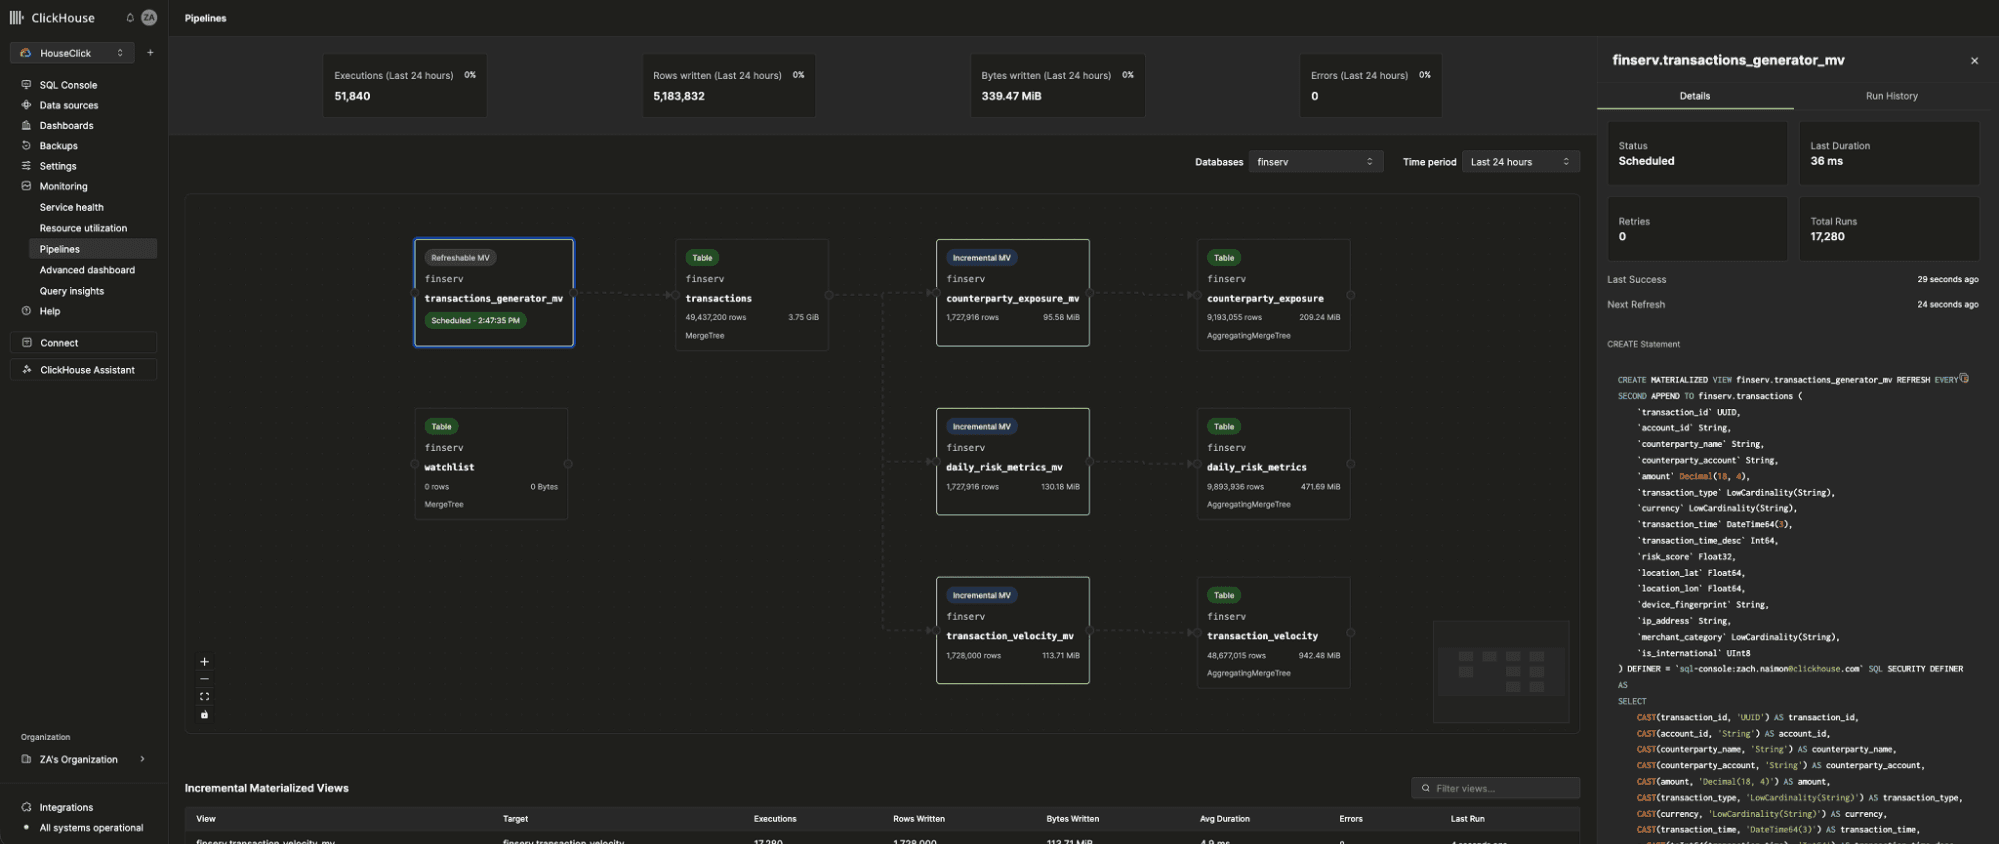
A Materialized View Pipeline Visualization will give teams a live visual map of data flowing across materialized views, one-click debugging for unhealthy refreshes, and a drag-and-drop pipeline builder for creating new pipelines.
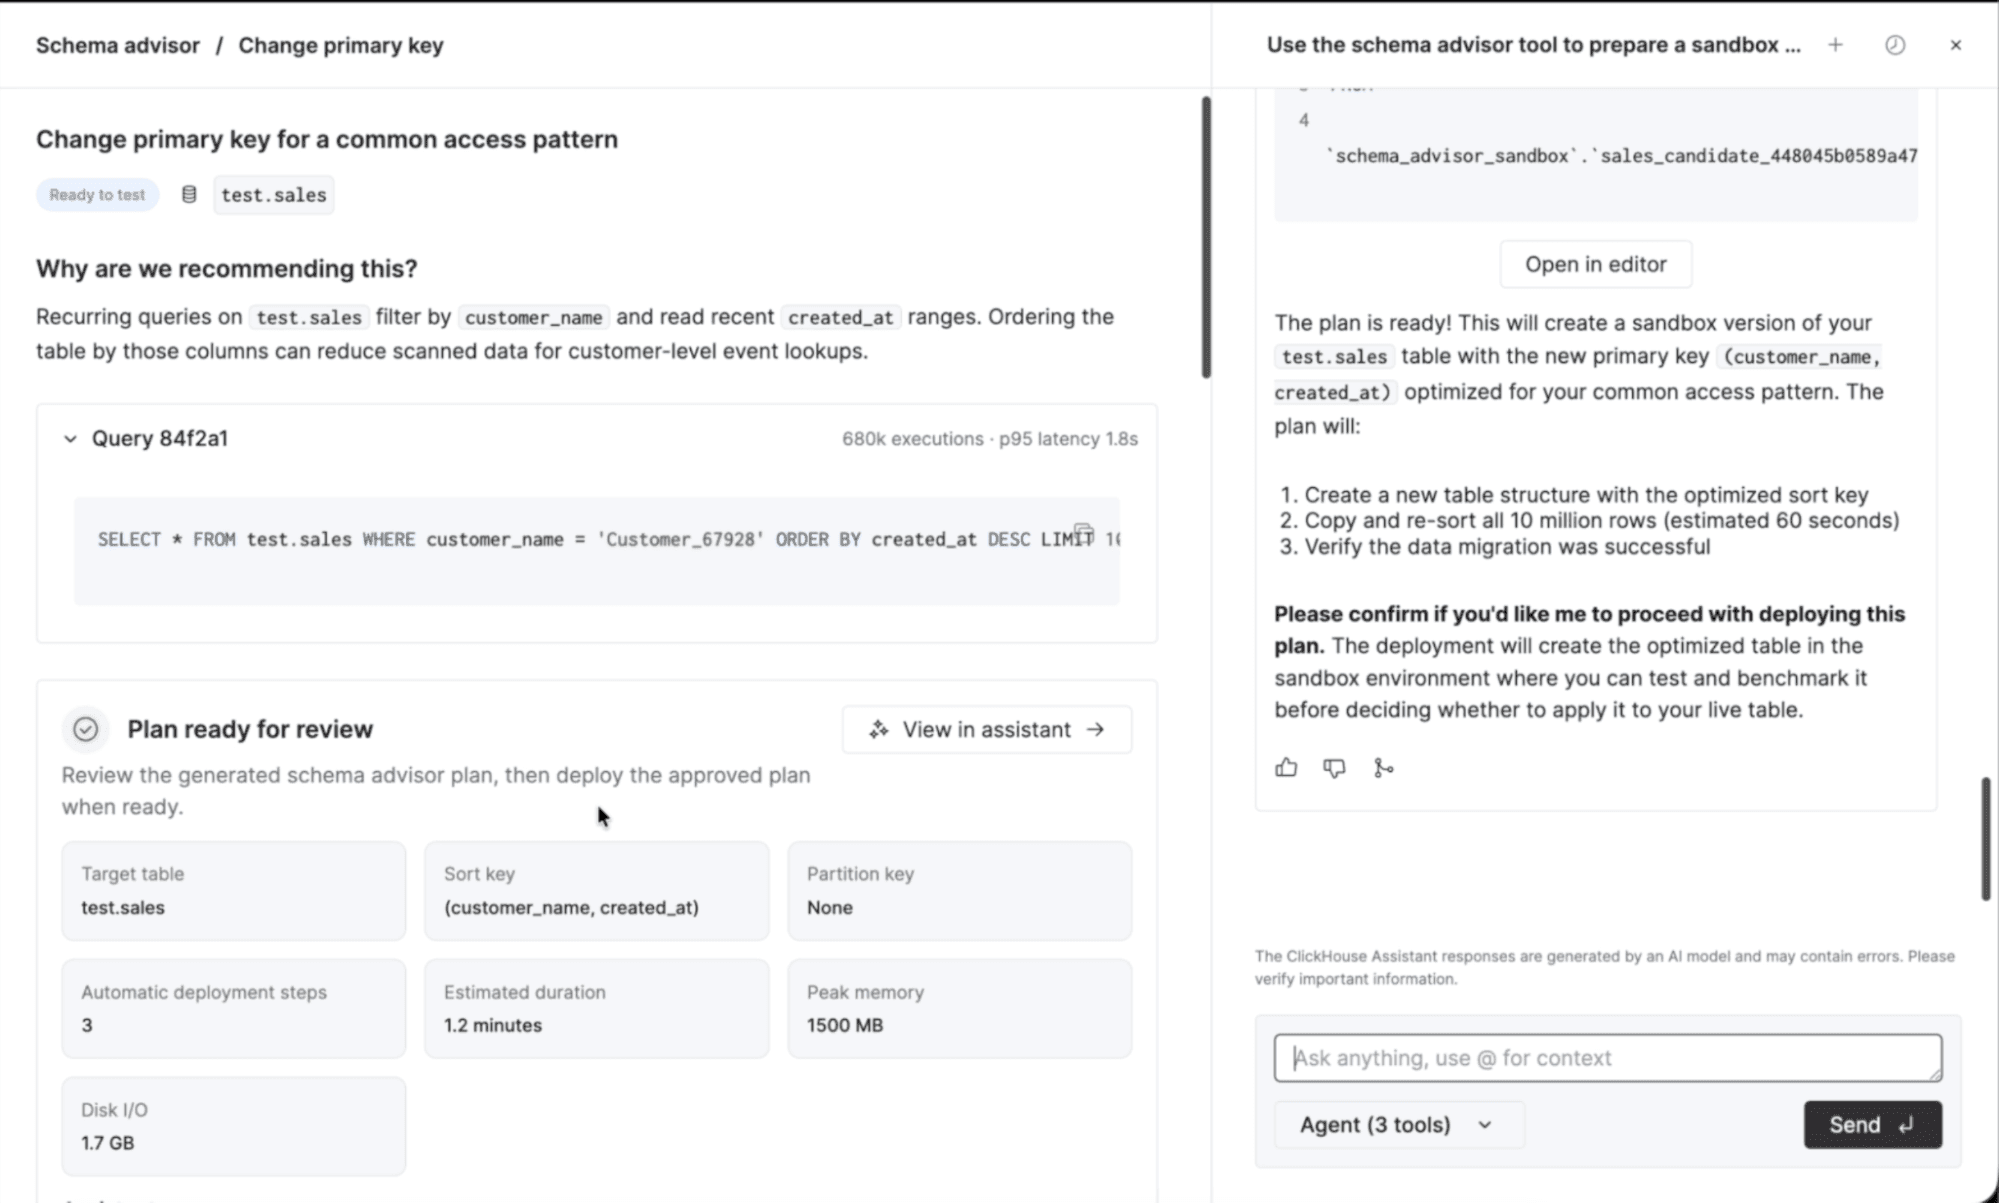
Coming soon Schema Management and Optimization introduces a fully guided, end-to-end AI-assisted schema management experience. It includes a workload-aware recommendation engine, a dedicated sandboxing environment, automated impact analysis, and a guided blue-green deployment flow for zero-downtime schema changes.
On the developer and agent side, the ClickHouse CLI is built for agentic workflows, with official ClickHouse skills installable directly into Cursor, Claude Code, and other coding agents. The same CLI manages both local development and production Cloud services.
Query API Endpoints gets a unified management pane, enterprise-grade RBAC, native IDE integrations, and MCP tooling support. The AI-Enhanced Query Builder UI lets analysts build complex queries visually and move fluidly between the visual builder and ClickHouse Assistant.
And MCP-as-a-Service enables fully managed, domain-specific remote MCP servers to be spun up directly from the ClickHouse Cloud UI, with fine-grained access control and support for custom context.
Together, these updates make ClickHouse Cloud a more complete platform for running production workloads, whether the queries come from a dashboard, a notebook, or an agent.
Postgres announcements
AI workloads are collapsing the divide between transactional and analytical databases. Applications that once ran predictable, hard-coded queries now generate unpredictable bursts of agent-driven requests that need answers from both sides of the stack. Best-of-breed matters more than ever: Postgres for OLTP, ClickHouse for OLAP. But composing them has traditionally meant standing up each database independently and bridging the two with custom CDC pipelines, message brokers, and orchestration logic.
ClickHouse Postgres, now moving from private preview to public beta, is built to close that gap. The service runs on local NVMe storage, eliminating the primary bottleneck in transactional workloads by colocating storage with compute instead of relying on network-attached volumes.
In early benchmarks, this delivers over 5x more transactions per second than AWS RDS and 2.4x more than the next closest alternative. High availability is supported with up to two standby replicas across availability zones, synchronous commit to the fastest standby, and automatic failover. Continuous WAL archiving to S3 provides point-in-time recovery, branching, and region-survivable durability.
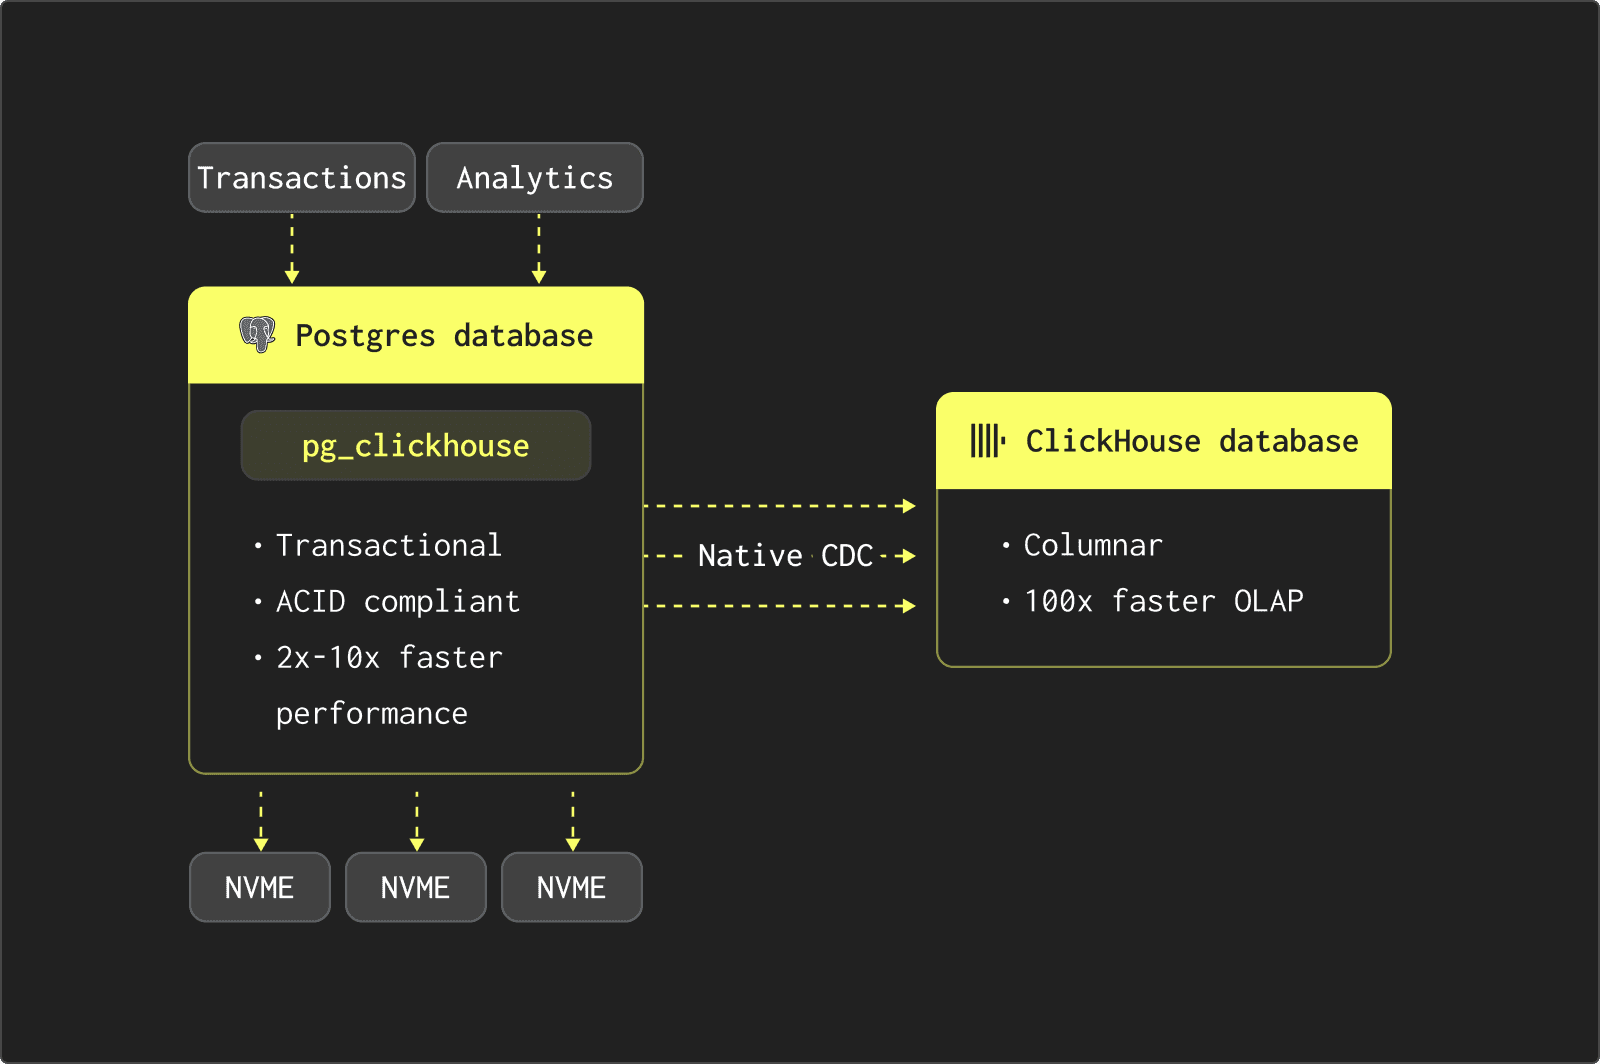
On the integration side, a Postgres-native CDC pipeline streams inserts, updates, and deletes directly into ClickHouse with no intermediate infrastructure, handling both parallel initial snapshots and continuous replication.
To make the experience even simpler for developers already building on Postgres, a new open-source extension, pg_clickhouse, makes ClickHouse-backed tables queryable directly from within a standard Postgres session, transparently pushing projections, filters, and aggregations down to ClickHouse for fast analytical queries. Developers continue using familiar Postgres SQL and tooling while the right engine handles the right workload behind the scenes.
For a deeper look at the architecture, benchmarks, and roadmap, read the dedicated blog post.
Distributed queries in ClickHouse
ClickHouse Cloud now supports multi-stage distributed query execution in private preview. The feature scales large joins and high-cardinality aggregations across many nodes by repartitioning intermediate data between execution stages.
Parallel replicas already distribute probe-side work, but every node still rebuilds the full hash table from the right side of the join. High-cardinality aggregations hit a similar wall, with final aggregation collapsing onto a single coordinator. Multi-stage execution removes both bottlenecks.
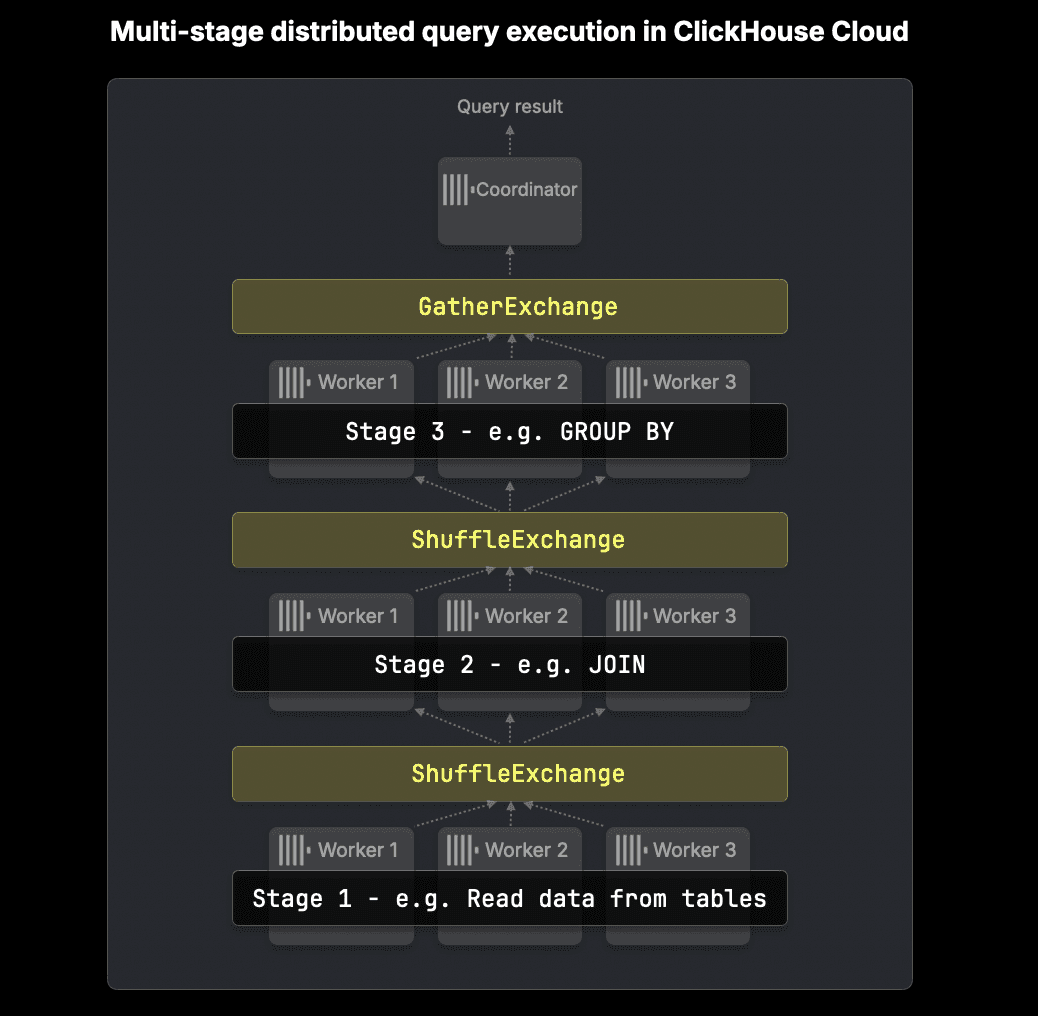
Workers exchange intermediate results, re-partition by join or GROUP BY keys, and operate on independent slices of the problem.
The feature builds on ClickHouse Cloud's shared-storage architecture, where any worker can access any data without fixed shard ownership. That makes it possible to distribute query stages dynamically across available compute, pointing toward more elastic execution with interchangeable worker pools.
In early TPC-H testing at scale factor 100, the full benchmark suite ran in 54.7 seconds on eight nodes, down from 117.6 seconds on a single node. Roughly a 2x improvement, with further gains expected as the cost-based optimizer matures.
For more technical details, we recommend users read the dedicated blog post.
Join performance and other core improvements
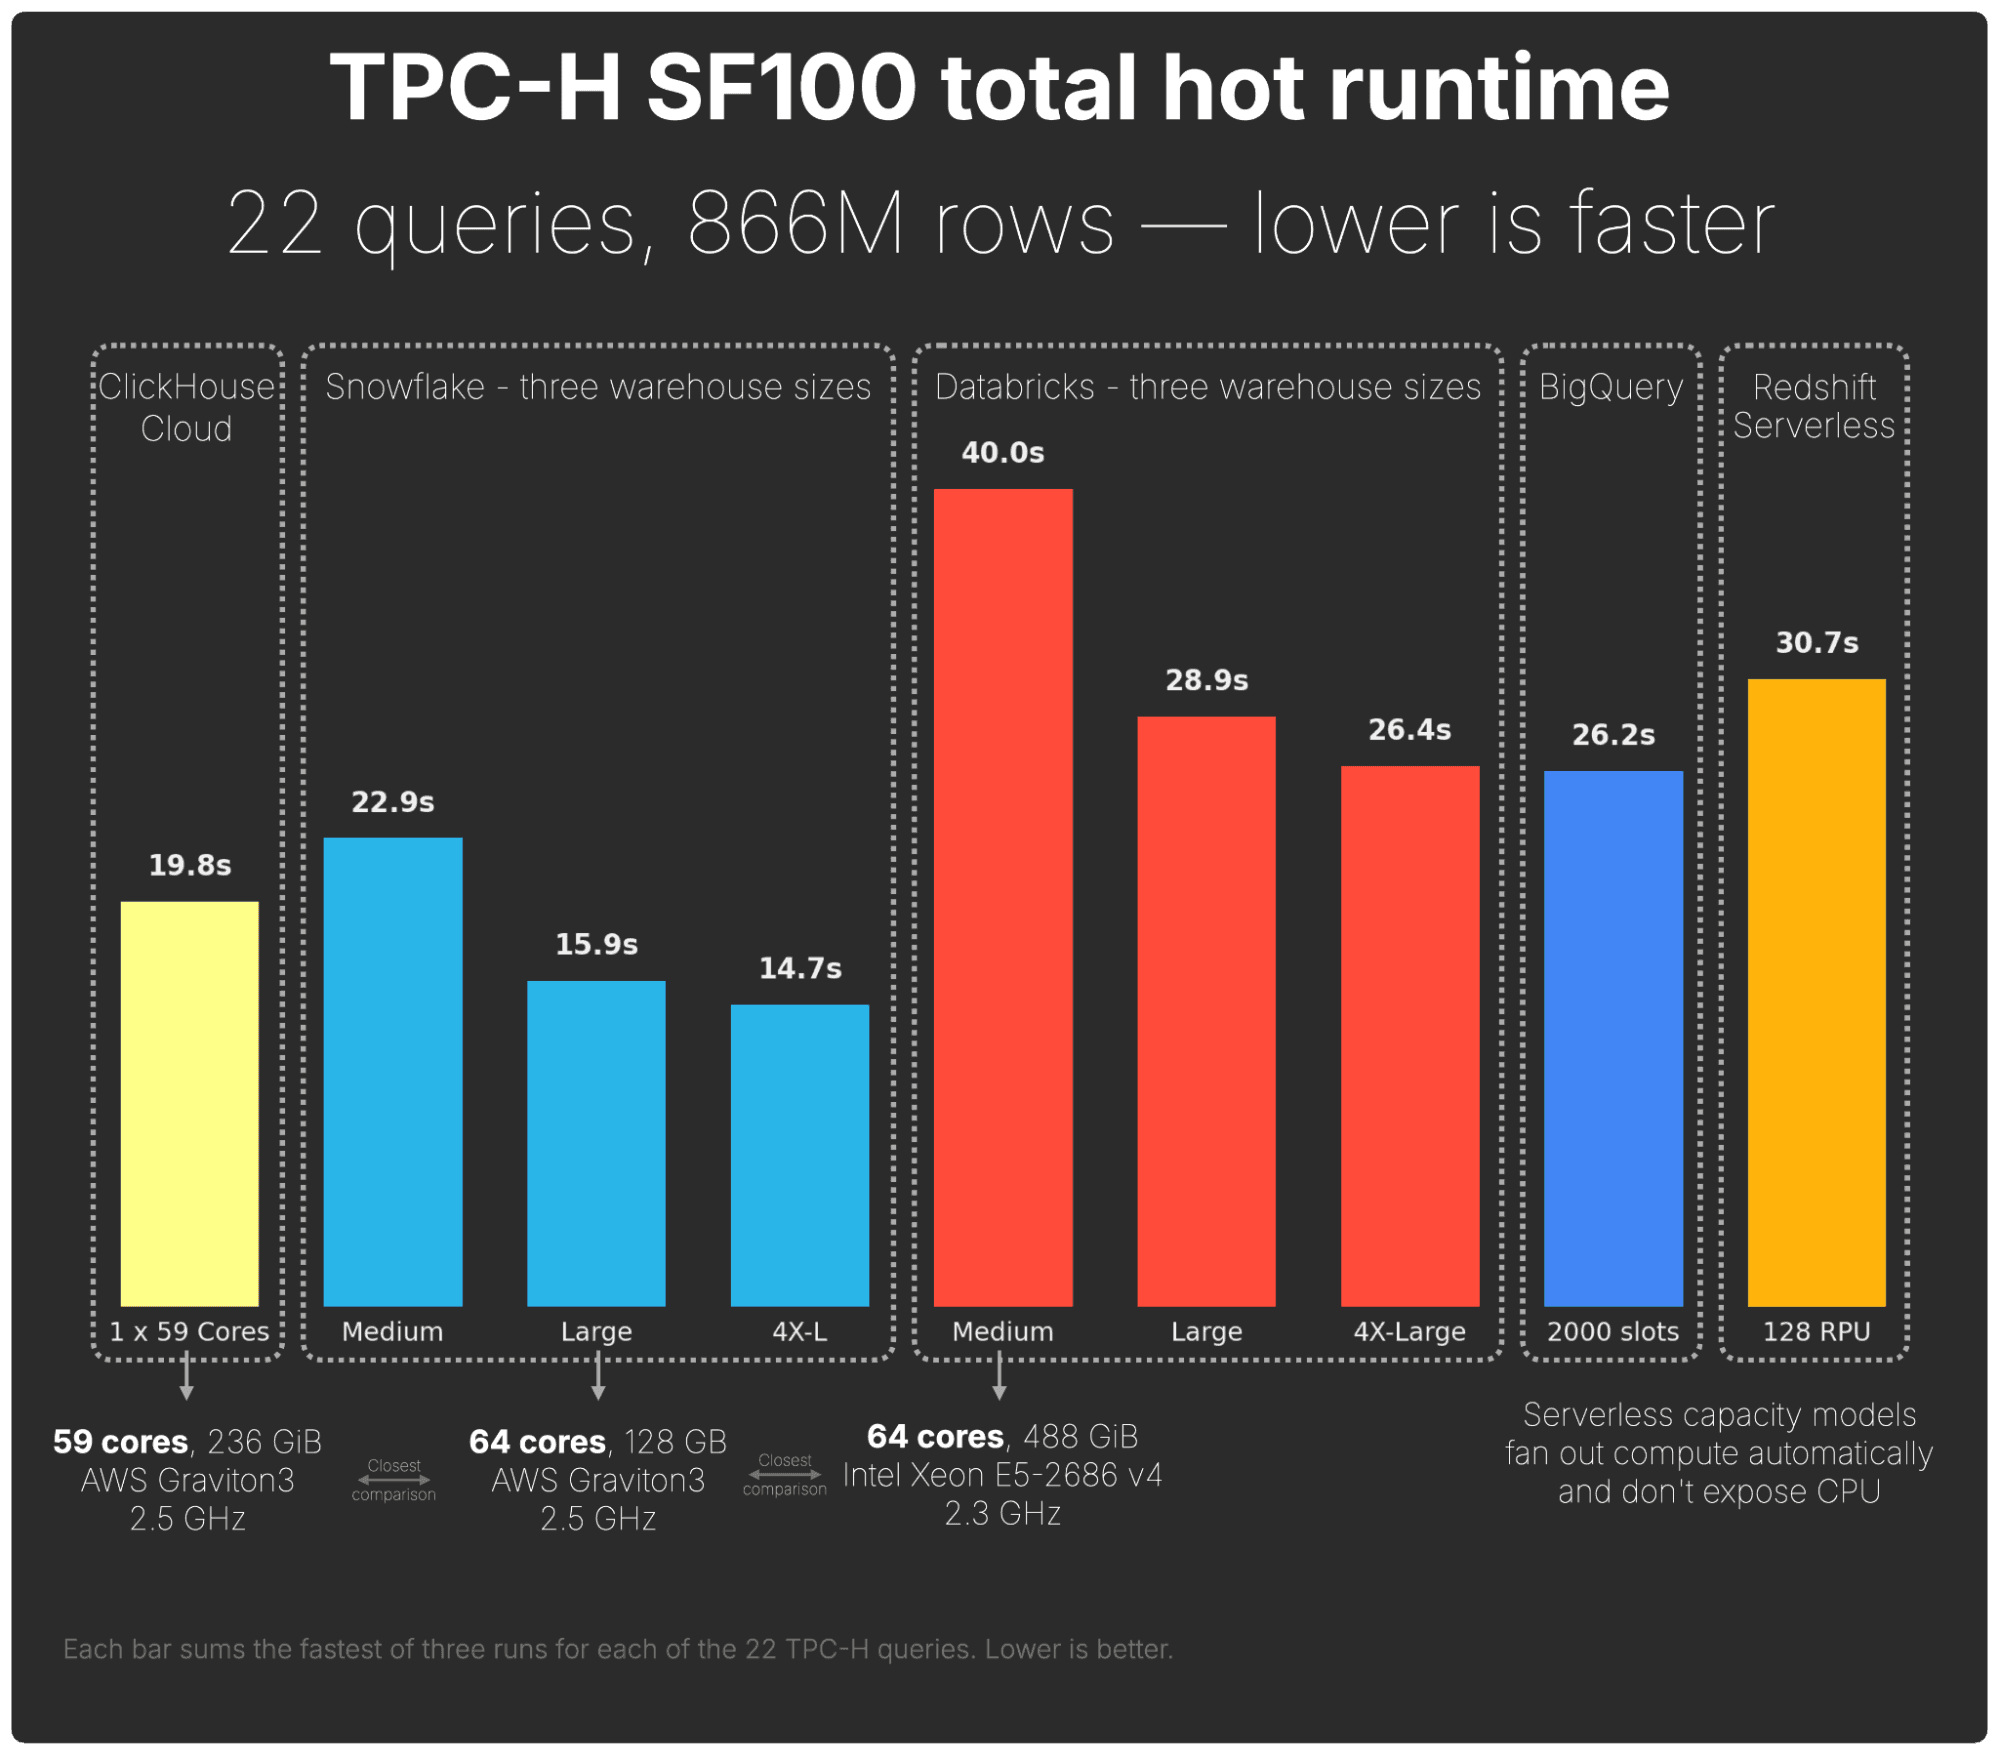
We presented how JOIN performance in ClickHouse improved by over 6x in the last year through support for correlated subqueries, lazy materialization, runtime filters, and automatic join reordering. These optimizations and features now put ClickHouse on par with established data warehouses across TPC-H and other standard JOIN benchmarks, often matching or exceeding the performance of systems such as Snowflake, BigQuery, and Databricks.
We also recapped some of the most recent improvements in the core database, including Full-Text Search being made generally available, addressing one of the most common requirements for observability and AI workloads.
ClickPipes
We're bringing ClickPipes natively to GCP! Starting today, new ClickHouse Cloud services on GCP run ClickPipes in the same region for lower-latency ingestion, data locality guarantees, and tighter integration with GCP-native features.
This includes Private Service Connect (PSC) support for secure, direct private connections to GCP-managed services behind a VPC; before, you had to tunnel connections via an SSH bastion host.
Note: If you’re using ClickPipes with existing GCP services, please reach out to your account executive to discuss a migration plan.
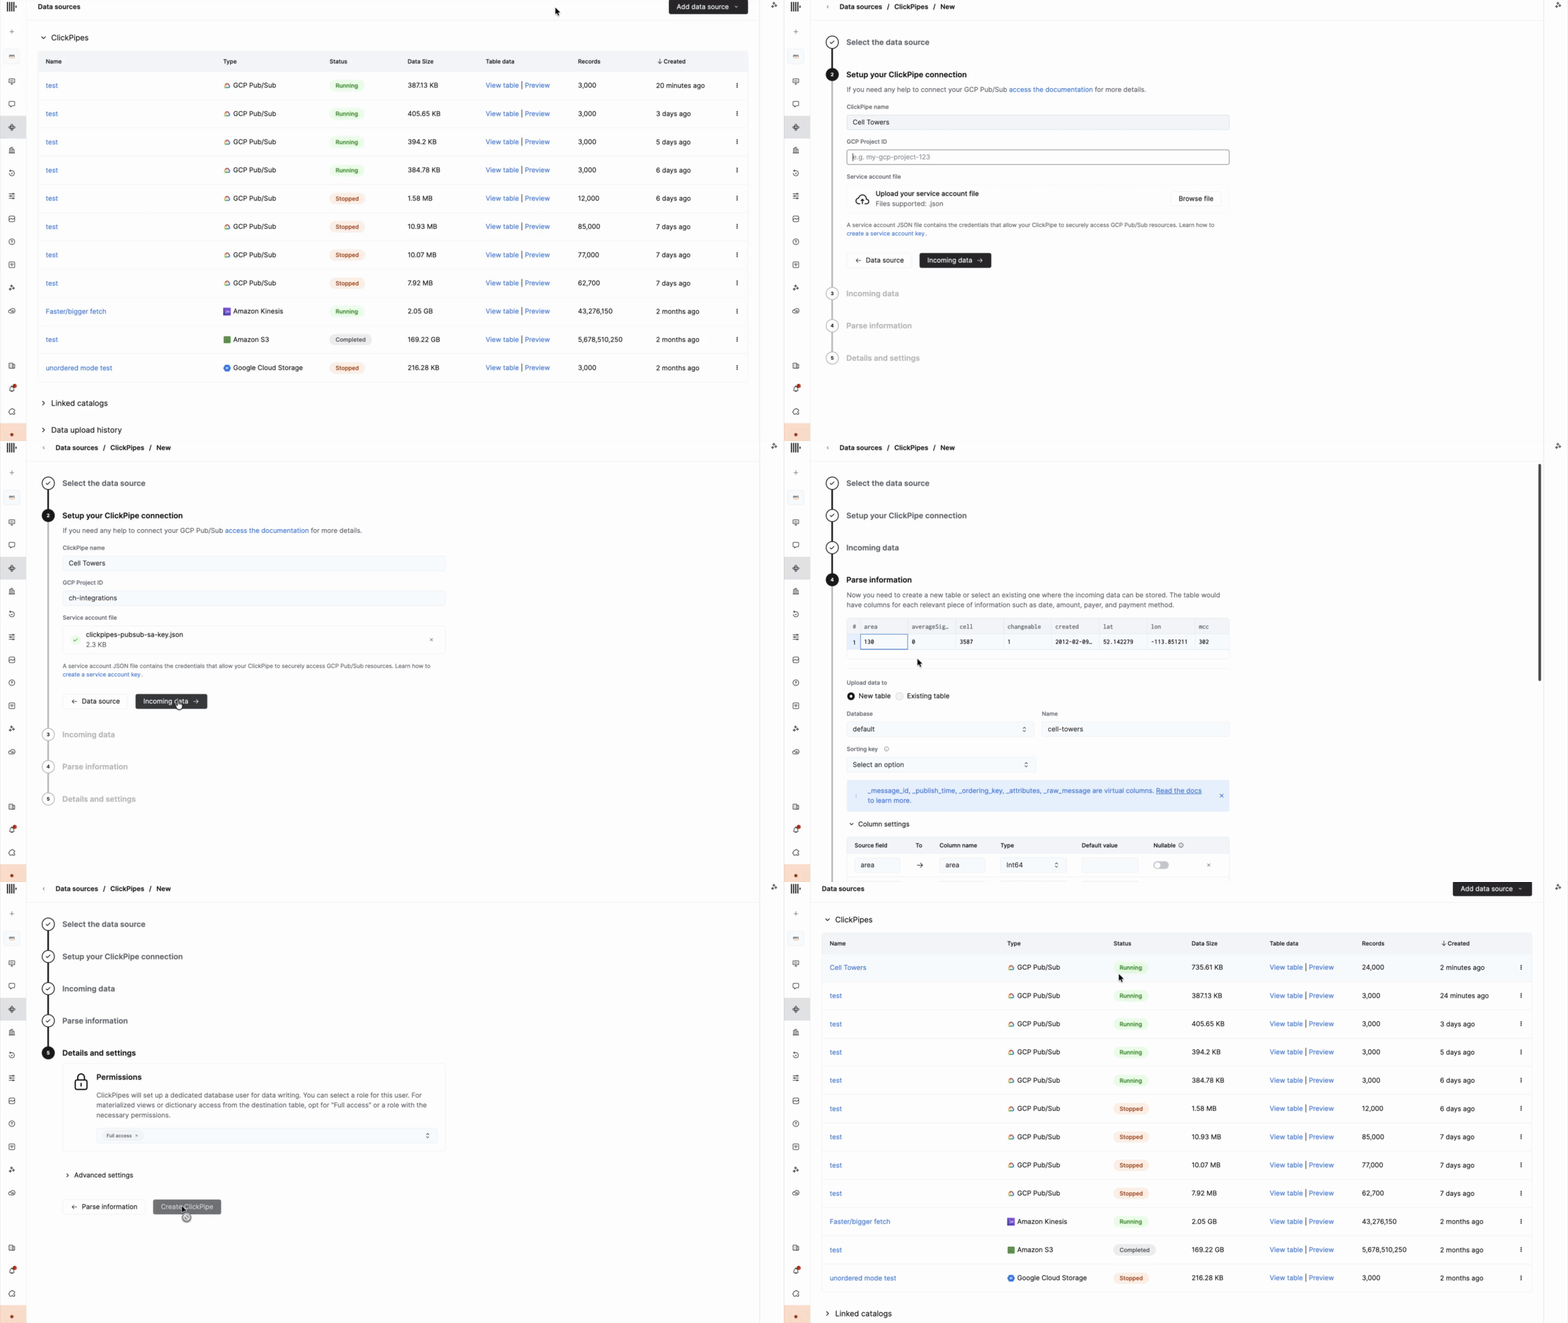
To deepen our integration with the GCP ecosystem even further, we’re also announcing a new ClickPipes connector for Google Cloud Pub/Sub, in Private Preview. If Pub/Sub is part of your stack, you can now subscribe to topics and stream data directly into ClickHouse Cloud with no additional infrastructure. The connector supports all common formats (JSON, Avro, Protobuf) and schema registry integration, with attribute-based message filtering, flexible seek options, and per-key ordered delivery. Like all connectors, it can also be managed programmatically via OpenAPI and the ClickHouse Terraform provider.
Bring any agent to your real-time data, with zero lock-in
AI agents are a new kind of workload, and they're breaking the old playbook. They fire ten to a hundred times the volume of queries a human analyst would, in bursts, all at once, and most analytical engines simply weren't built for it. Closed data platforms make it worse, locking teams into limited and proprietary models, a single agent, and one rigid way of working, while costs spiral. The agentic era needs a real-time substrate that's fast, affordable, and refuses to lock anyone in.
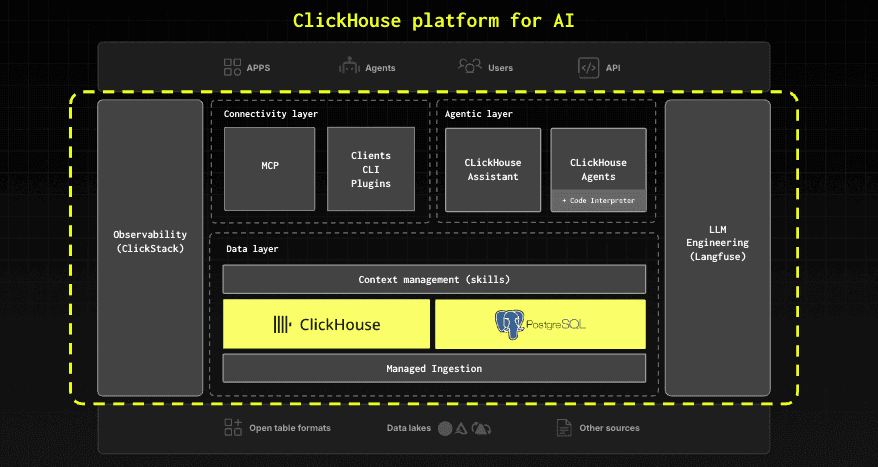
Today, we're introducing ClickHouse Agents, a fully managed agentic analytics service on ClickHouse Cloud, powered by Claude and now in public beta.
Every ClickHouse Cloud user gets a native chat experience and a no-code agent builder for shipping agents grounded in their own data, with zero setup. Under the hood is a sandboxed code interpreter, shareable artifacts, skills, memory, and multi-agent workflows, all built on LibreChat - the open-source platform that joined ClickHouse last November.
Because it speaks MCP natively, context can be pulled from any MCP-compatible system. ClickHouse is purpose-fit for this agentic era, where sub-second queries on billions of rows, petabyte scale, and cost efficiency are key to running agentic analytics in production successfully. Customers don't have to choose between us and the tools they already love. Use our agents out of the box, build or bring your own, get speed, transparency, and full control with your analytics AI stack.
Langfuse announcements
As we discussed in the previous section, AI agents are introducing a fundamentally different workload pattern for data systems, and observability platforms are feeling that shift just as strongly. A single agent run can produce hundreds of observations across LLM calls and tool calls, and the interesting signal is rarely at the top of the trace but requires deep evaluation workflows in production and in development. Langfuse solves for this problem, and the team joined ClickHouse in January.
Today, we're announcing Langfuse V4, in beta on Langfuse Cloud and soon to be available for self-hosted deployments.
This represents a "simplify for scalability" rewrite that collapses the data model into a single immutable observations table with no joins and no deduplication. The result is millisecond dashboard loads, 200x query performance across many important routes, and a single project that comfortably handles billions of events, all benefiting from ClickHouse's performance. Learn more about the details of this change in this technical blog post.
On top of V4, we're shipping a tighter improvement loop: Experiments now ship with an improved UI, code-based evaluators, and CI/CD workflows. This means prompt and agent changes can be scored before they reach production, with LLM-as-a-judge supporting categorical, boolean, and free-text scores and alerting, ensuring teams can react to score and latency regressions at agent scale.
The platform itself is becoming agent-native, with v2 of the MCP server exposing most API routes to agents, a rewritten Langfuse CLI, and skills that wrap every Langfuse capability so the same building blocks work for humans and agents. Soon, these APIs will include fast full-text search, allowing agents to explore traces in a more free-form/semantic way.
Finally, Langfuse Cloud users can now sign in using their ClickHouse Cloud identity, making adoption seamless and removing the need to manage a separate login. Langfuse itself remains open source, OpenTelemetry-native, self-hostable, and built to scale with the realities of agent workloads.
ClickStack announcements
ClickStack Cloud
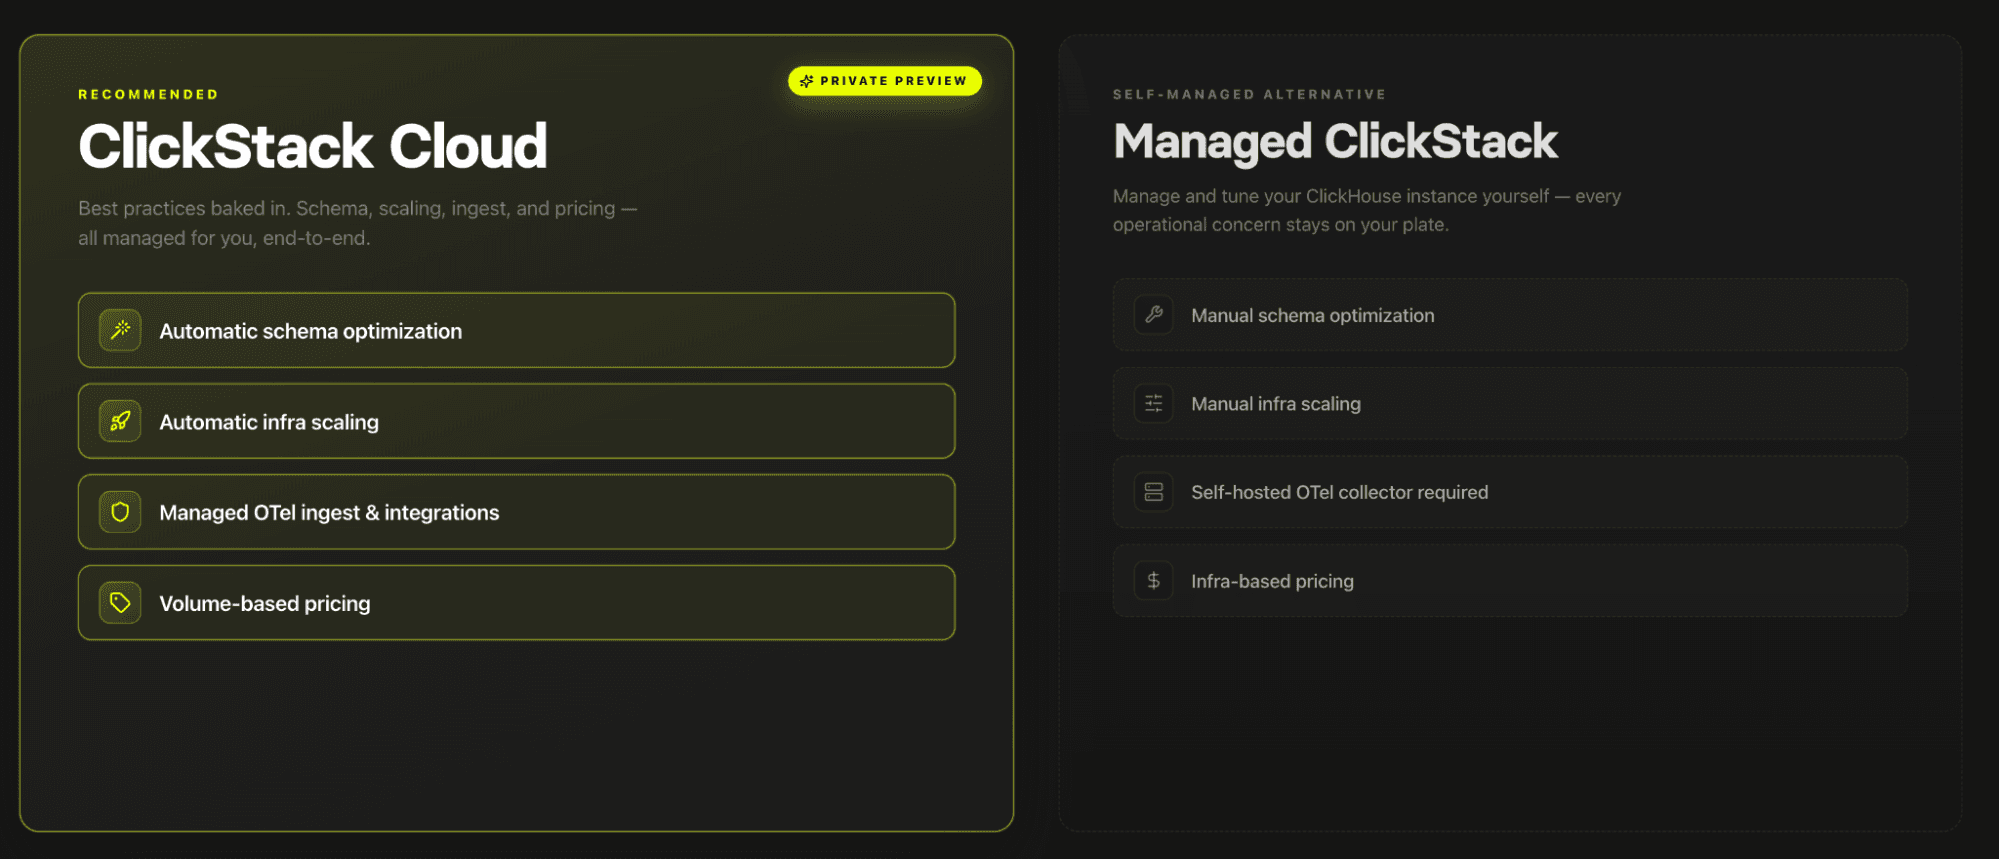
Today, we announced the private preview of ClickStack Cloud, a fully managed, serverless observability platform built on ClickHouse. Teams can send OpenTelemetry data to a managed OTLP endpoint, then investigate logs, metrics, and traces through the ClickStack UI without operating collectors, ingestion pipelines, or ClickHouse clusters themselves. ClickStack Cloud enters private preview with managed ingestion, a serverless query experience, and integrated observability workflows built directly on ClickHouse Cloud.
During the private preview, we’re focused on two areas that matter for large-scale observability workloads: independently scaling ingestion and query infrastructure, and automatically tuning the underlying datastore based on how teams actually use their telemetry data.
This means improving systems that learn from common query patterns and automatically optimize telemetry data over time. Planned areas of automatic tuning include materializing frequently queried fields, adjusting primary keys around common filters, and adding materialized views and indexes for common dashboard and investigation workflows. These capabilities will be refined alongside early adopters and design partners throughout the private preview period.
Private preview spots are limited. If you are interested in using ClickStack Cloud, sign up for the preview program and tell us about your observability workload.
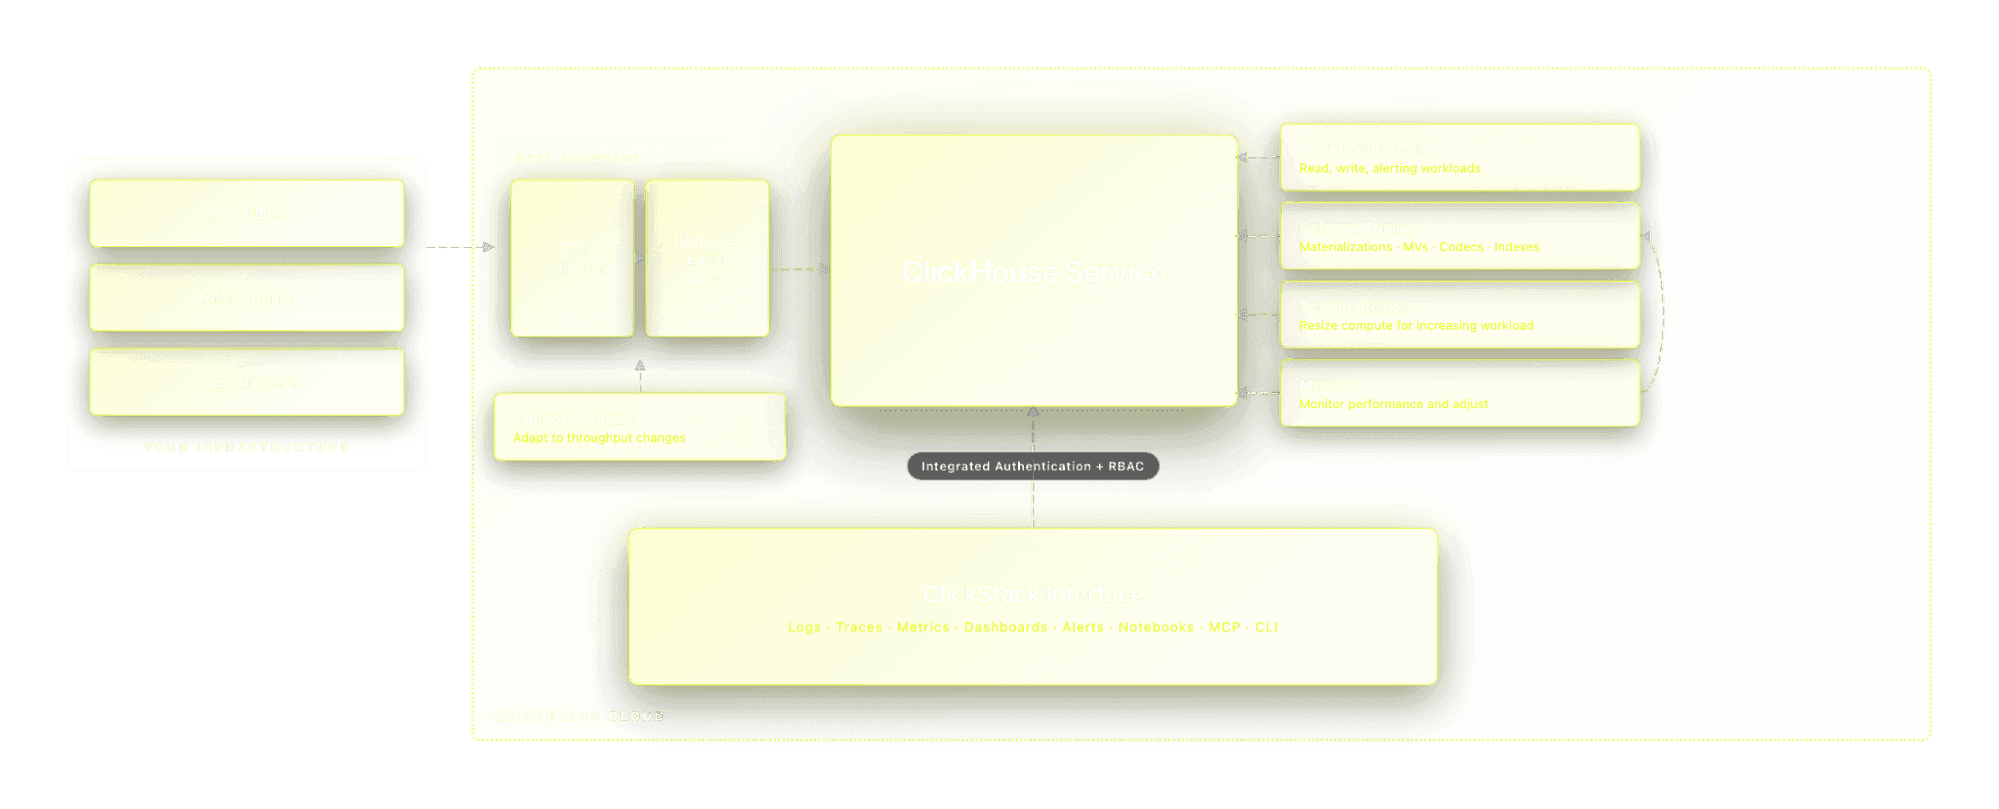
For more details, see our dedicated blog post.
Managed ClickStack
In addition to ClickStack Cloud entering private preview, our existing Managed ClickStack offering is now generally available.
Managed ClickStack is designed for teams that want direct operational control over their observability stack, including ingestion pipelines, compute sizing, workload isolation, schema design, and datastore tuning. Users manage their own OpenTelemetry collectors and ingestion architecture while using ClickHouse Cloud as the underlying observability datastore. For many large-scale deployments, that control is essential for optimizing performance and achieving market-leading cost efficiency.
PromQL support
While we believe SQL is the lingua franca of data analysis, some workloads benefit from a domain-specific language. PromQL for Prometheus-style metrics is one example.
To close out our observability announcements, we wanted to share an early preview of a major area of investment for 2026: PromQL support in ClickHouse and ClickStack.
During the demo, we showed PromQL queries running against ClickHouse through the ClickStack UI.
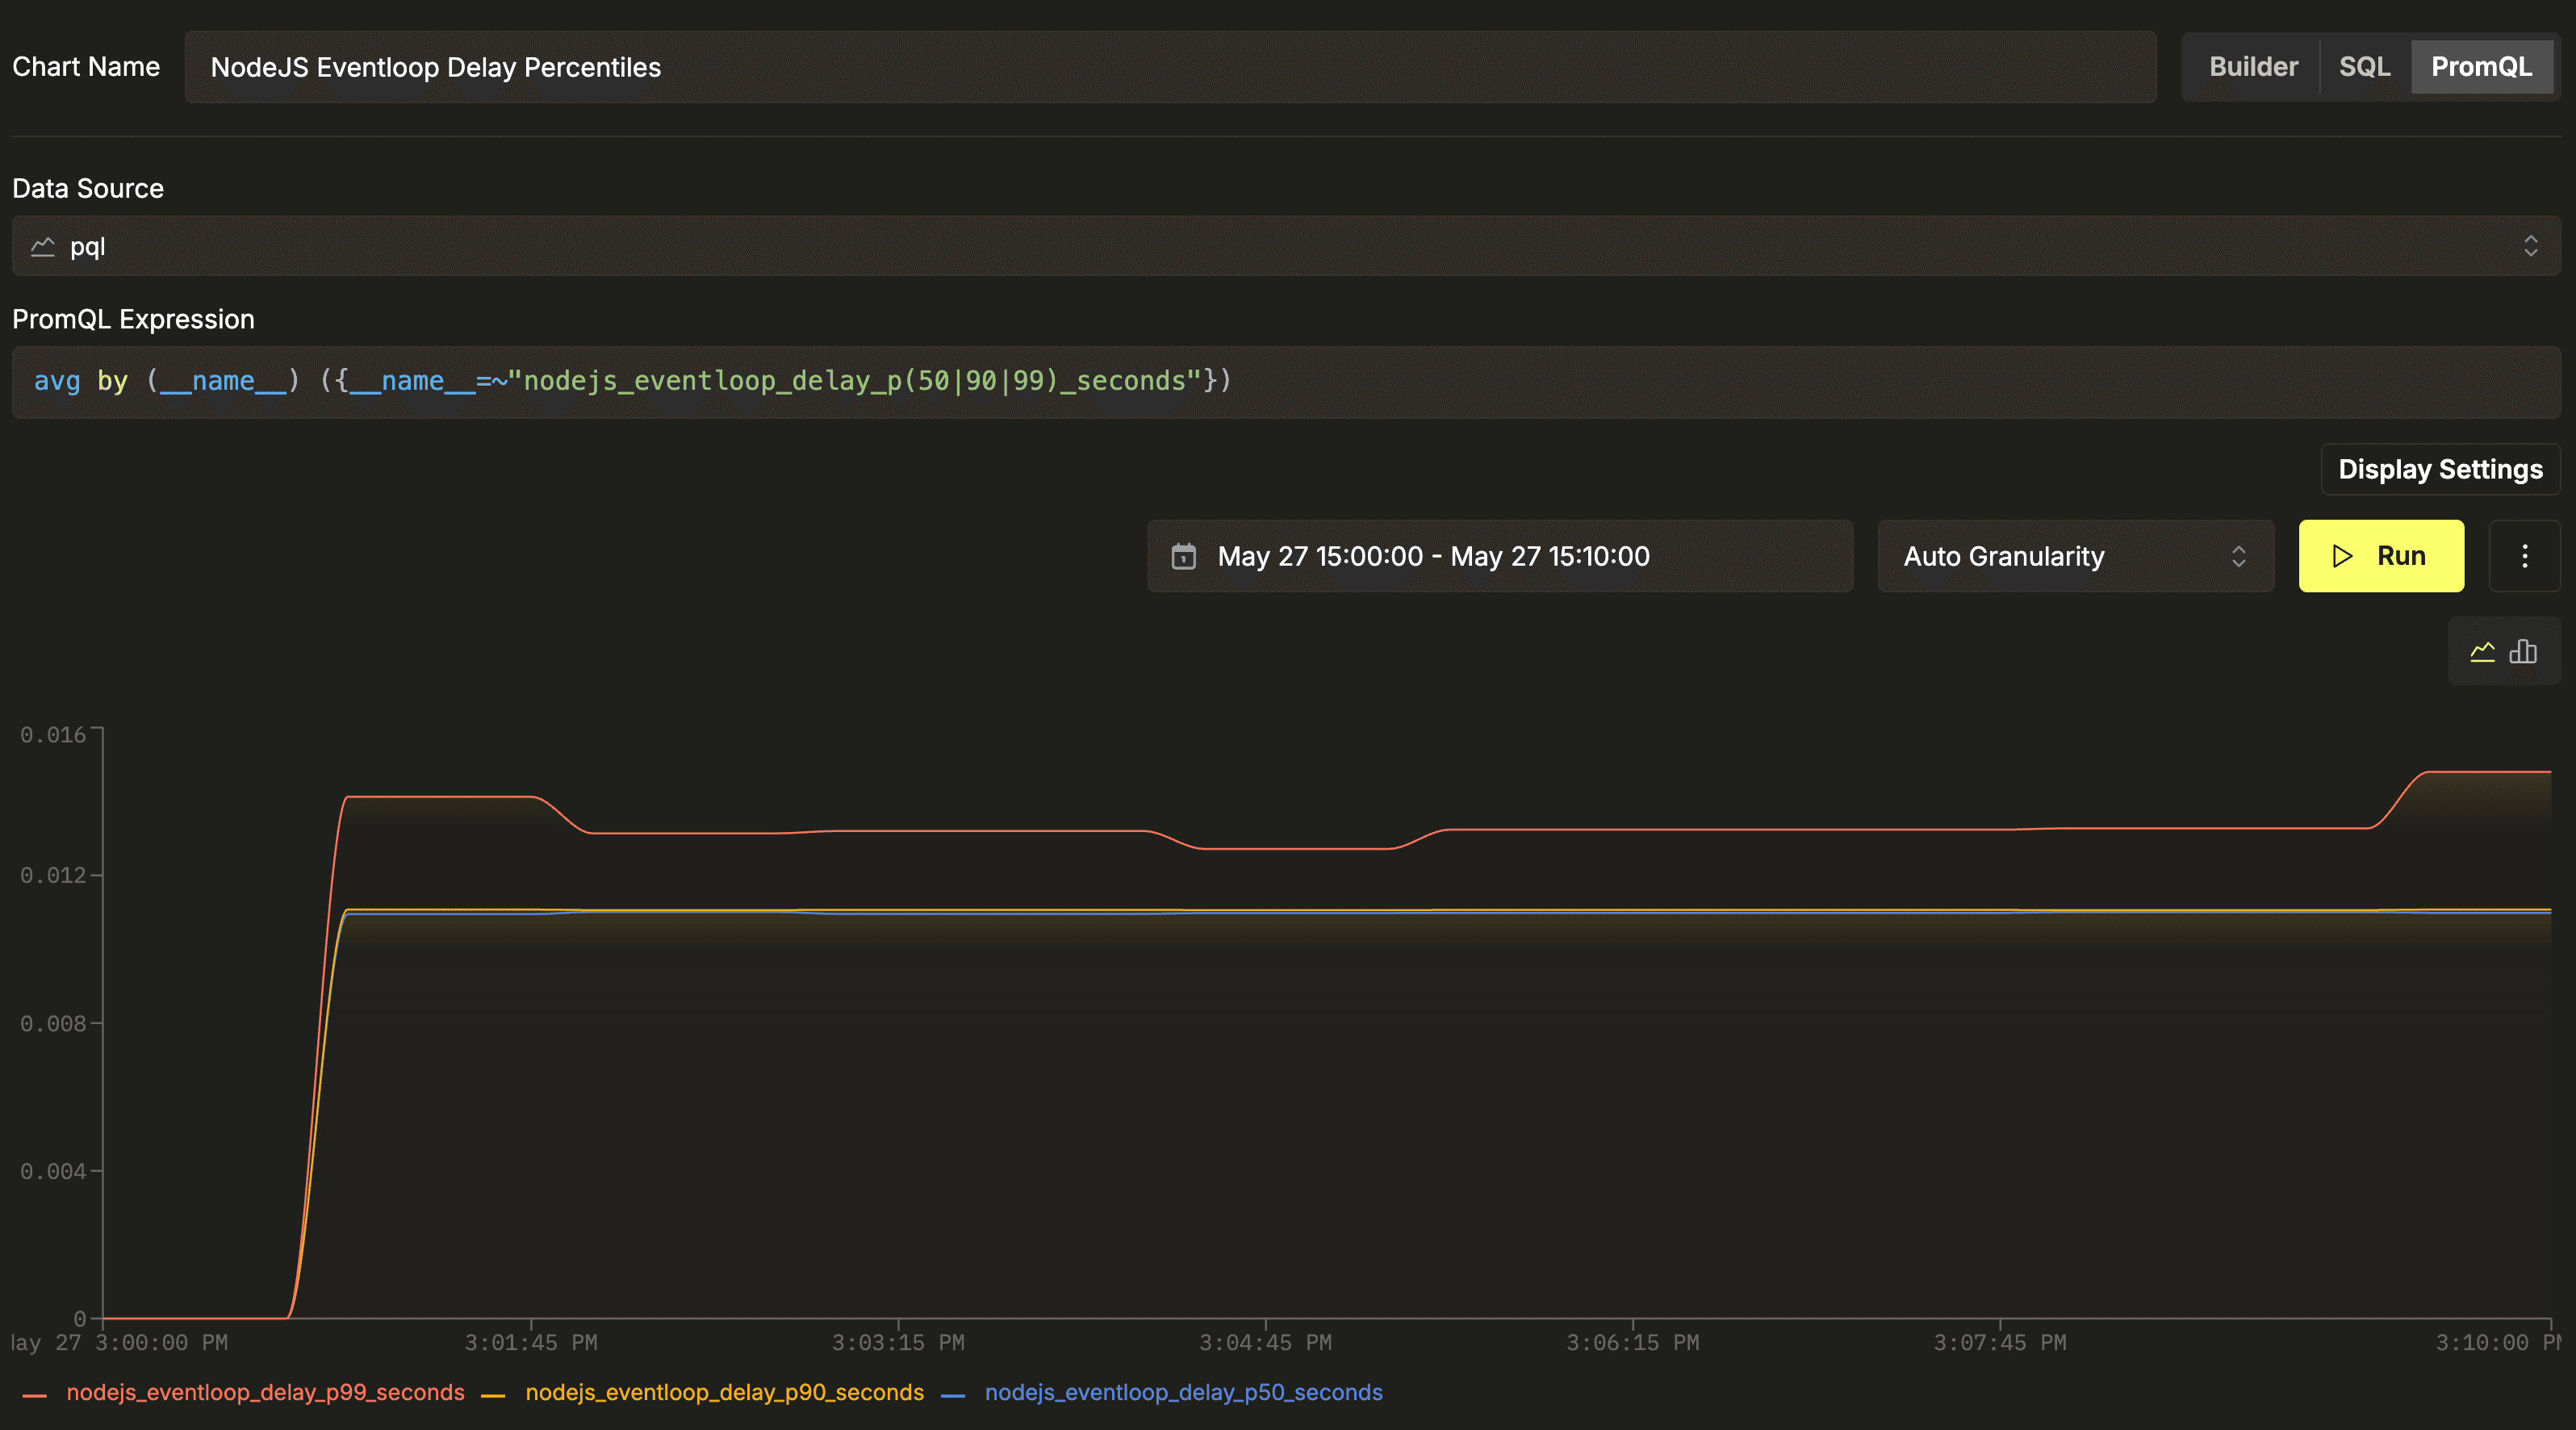
This is still very early work. There are dragons here. The implementation is incomplete, behavior will change, and there is still a large gap between the current state and something we would consider production-ready.
For anyone curious enough to experiment, the underlying functionality is already available experimentally in ClickHouse, with integration also available in open-source ClickStack.
Most of the recent work has focused on language coverage and compatibility. The goal is straightforward: existing PromQL queries should behave the way users expect when pointed at ClickHouse. Performance work is happening alongside this, so PromQL queries can still benefit from the scale and execution speed of the ClickHouse engine.
Partner program announcement
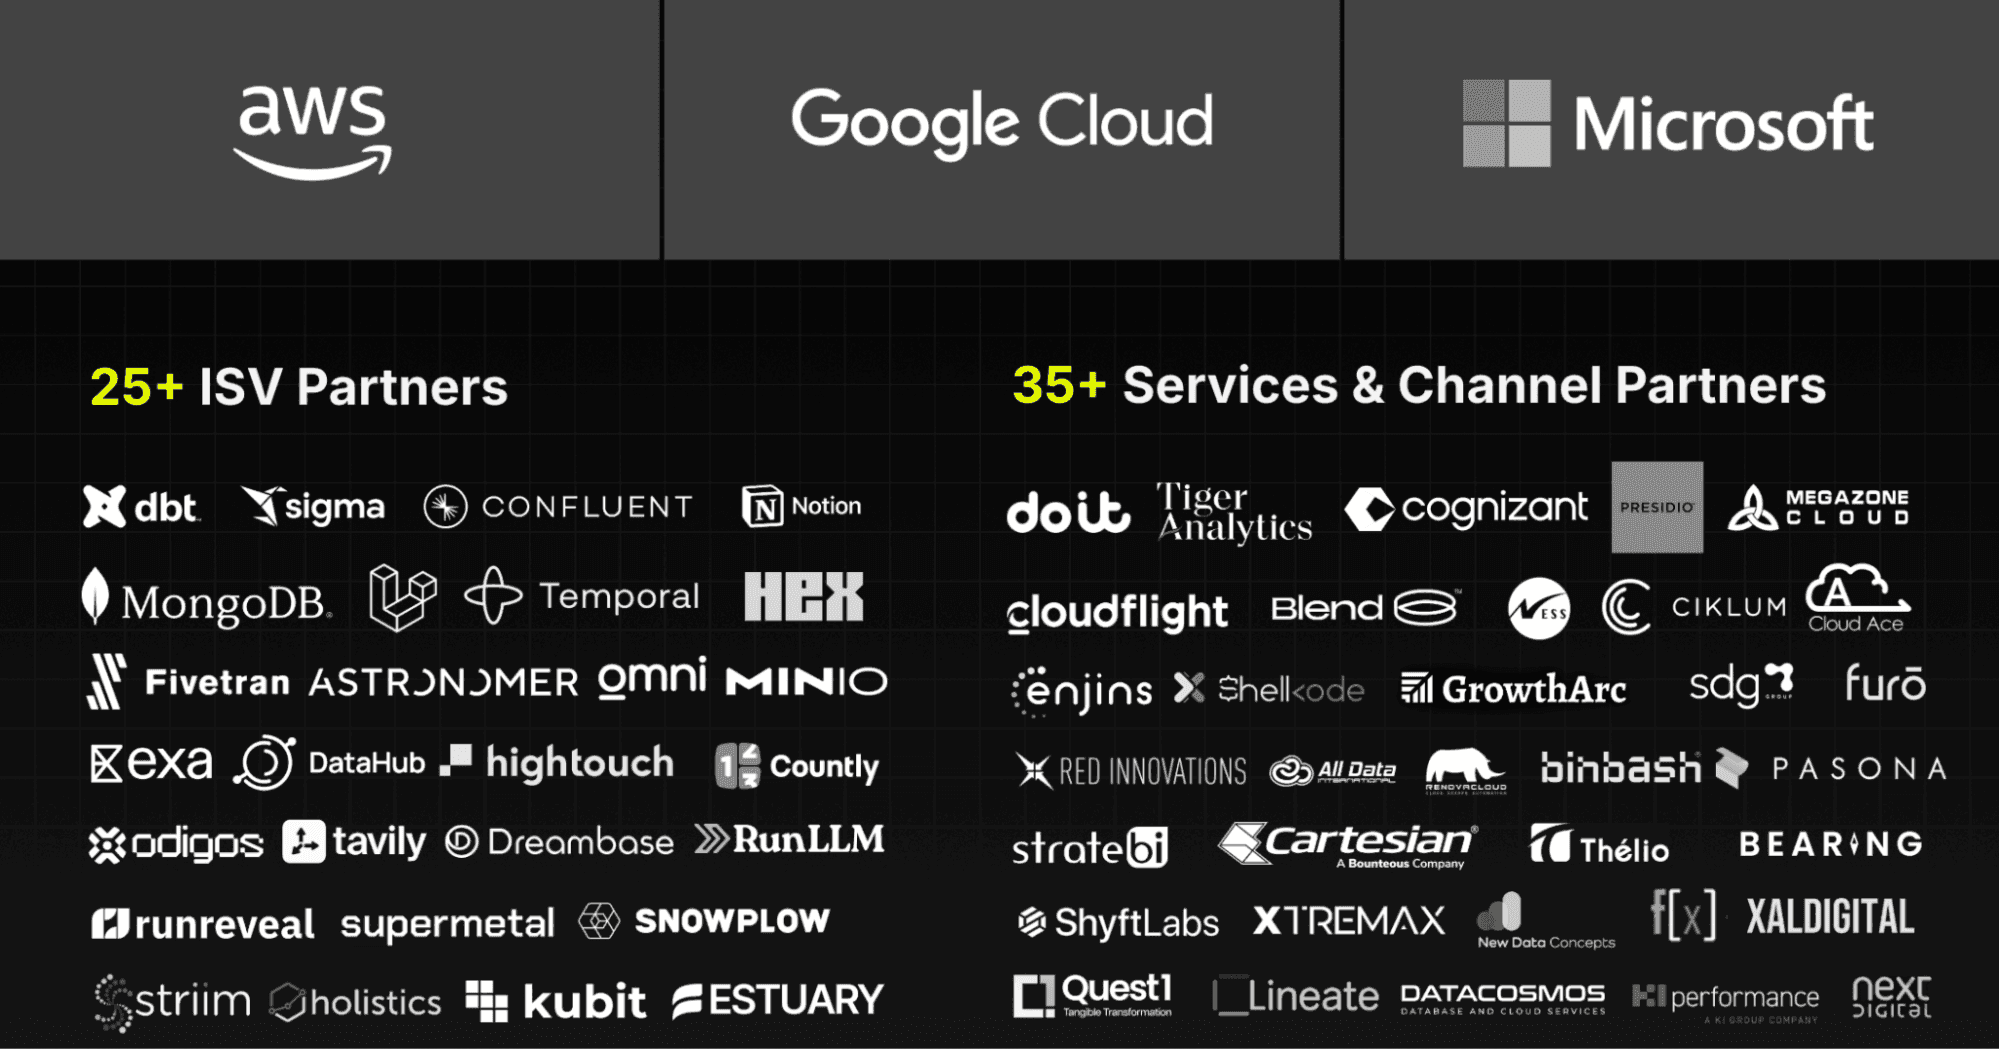
ClickHouse also introduced House Mates, its first formal partner community and program. It launches with a founding cohort of more than 25 technology partners and over 35 services, consulting, and channel partners across six continents. The program is organized across three tracks: Technology, Services, and Reseller, each with three tiers: Ignite, Accelerate, and Prime. Benefits scale with tier and include joint go-to-market motions, co-innovation and integration support, enablement and certifications, incentives, and a dedicated partner portal. Read the announcement blog for more details.
Wrap-up
Today’s announcements span distributed query execution, observability, lakehouse interoperability, agentic analytics, and transactional workloads, all while keeping teams in control of the tools and architectures they use. Whether that means bringing your own agent, your own catalog, your own collectors, or continuing to work from familiar Postgres workflows, the focus remains the same: fast real-time systems without lock-in.
The performance improvements behind these launches were equally significant, including over 5x higher throughput than AWS RDS for Postgres workloads, roughly 2x faster distributed query execution at TPC-H scale factor 100, and up to 200x query performance improvements in Langfuse V4. We’ll be back tomorrow with another round of announcements and deeper technical sessions for Day 2.
Get started today
Interested in seeing how ClickHouse works on your data? Get started with ClickHouse Cloud in minutes and receive $300 in free credits.
Sign up