50.4k
50.4k
Summary
The ClickHouse Terraform provider now manages ClickStack resources across self-hosted deployments and ClickHouse Cloud. Dashboards, alerts, sources, saved searches, connections, and webhooks can be stored in version control and managed with the usual terraform plan and terraform apply workflow.
A dashboard built for one service rarely stays in one environment. It gets recreated in staging and production, along with its filters, saved searches, and alerts. Once those copies exist, keeping them aligned means repeating changes through the UI and checking each environment by hand.
ClickStack configuration can now follow the same workflow as the rest of your infrastructure. The official ClickHouse Terraform provider now supports ClickStack resources for self-hosted deployments and ClickHouse Cloud. Dashboards, alerts, sources, saved searches, connections, and webhooks can live in version control, pass through code review, and be applied with `terraform plan` and `terraform apply`.
Support for self-hosted ClickStack and Managed ClickStack resources are available in the regular provider release as beta from v3.25. Their behavior and configuration may thus change as we get more production feedback.
The ClickHouse Terraform provider
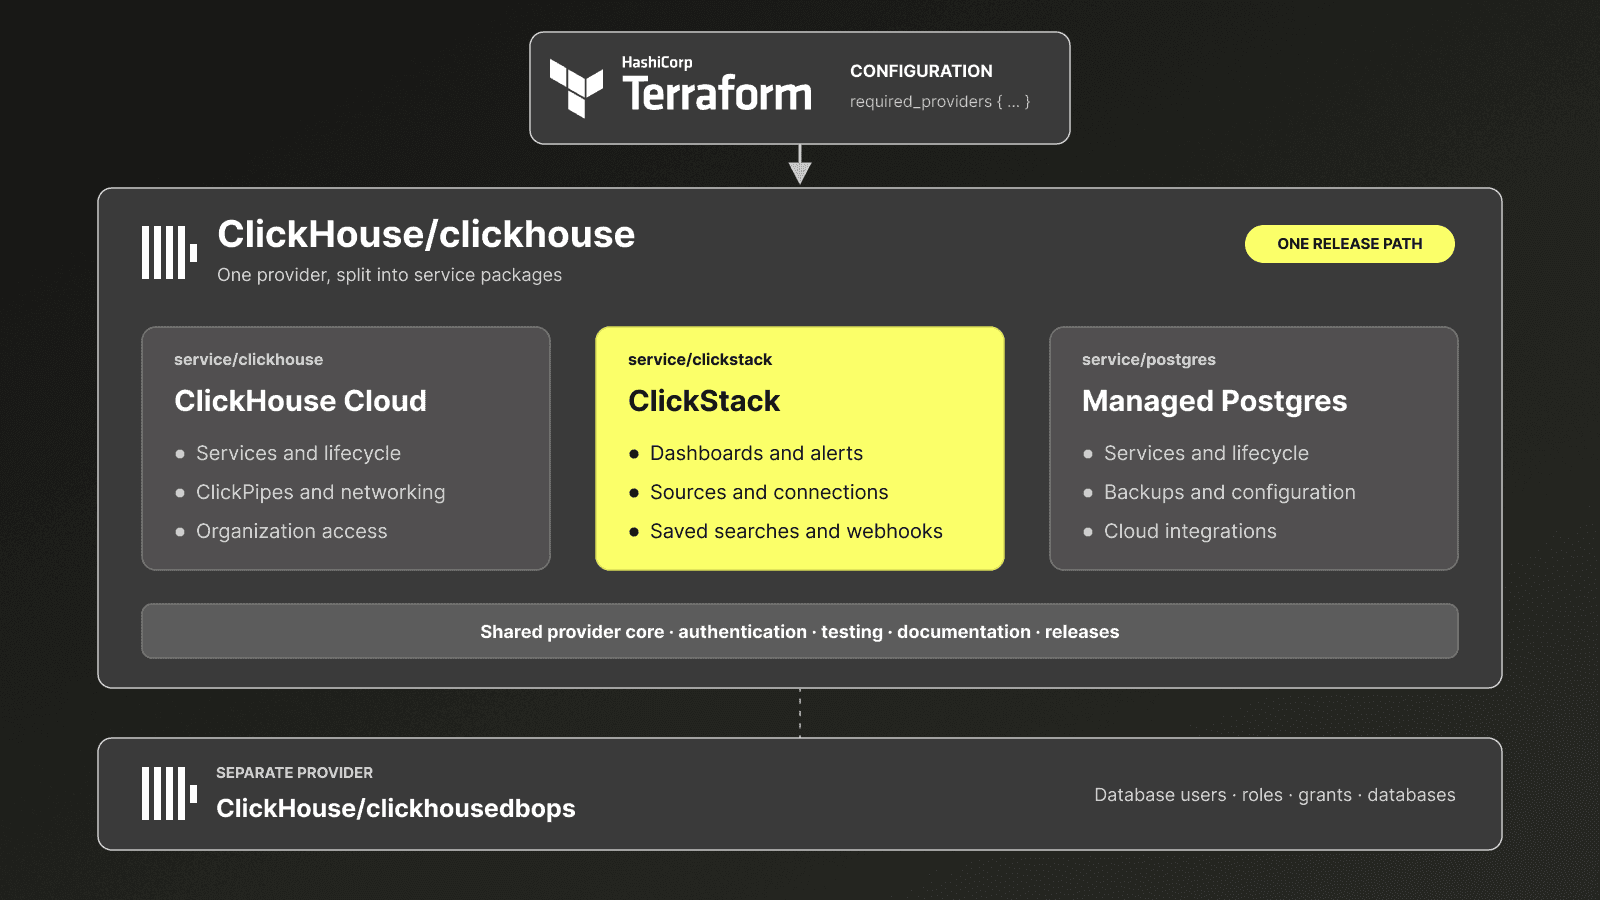
ClickHouse maintains two official Terraform providers with different jobs:
ClickHouse/clickhousemanages resources in the ClickHouse Cloud control plane, including services, private endpoints, ClickPipes, organization access, and Managed Postgres.ClickHouse/clickhousedbopsconnects to a ClickHouse instance to manage database-level users, roles, grants, and databases.
ClickStack support belongs in ClickHouse/clickhouse. In feedback from ClickStack users, Terraform was the most common request across both self-hosted and Cloud deployments. We initially developed that support as a separate effort, but realised that publishing another provider would have duplicated release work, testing, documentation, and authentication code.
The ClickStack provider was therefore added as a dedicated service module within the existing ClickHouse/clickhouse provider, keeping its resources and data sources separate from the ClickHouse Cloud and Postgres implementations. Users continue to install a single provider and follow the same release path.
This also keeps authentication consistent in ClickHouse Cloud. ClickStack resources use the same organization ID and Cloud API credentials as the rest of the provider, with a ClickStack service ID identifying the target deployment. Self-hosted, open-source ClickStack uses its own endpoint and personal API access key. We will show both configurations later in the post.
Building on the ClickStack API
A Terraform resource needs a predictable API contract. Resource identifiers must remain stable across reads and updates. Create, update, delete, and import behavior must be explicit. Errors also need enough structure to point users back to the field that failed during planning.
The ClickStack API work earlier this year, exposing observability resources through the existing ClickHouse Cloud service path:
/v1/organizations/{organizationId}/services/{serviceId}/clickstack/…
Supporting infrastructure tooling also required changes to the API definition. Inline schemas were replaced with named types, numeric fields were defined consistently as integers, and validation failures gained structured error details. Those changes make the OpenAPI contract usable by generated clients and give Terraform enough information to report configuration errors clearly.
Managing dashboards introduced an additional requirement: dashboard definitions are supplied as JSON and need to be validated before they are applied. During terraform plan, the provider sends the definition to the ClickStack validation API when the endpoint is available. Invalid configurations are therefore caught before terraform apply makes any changes.
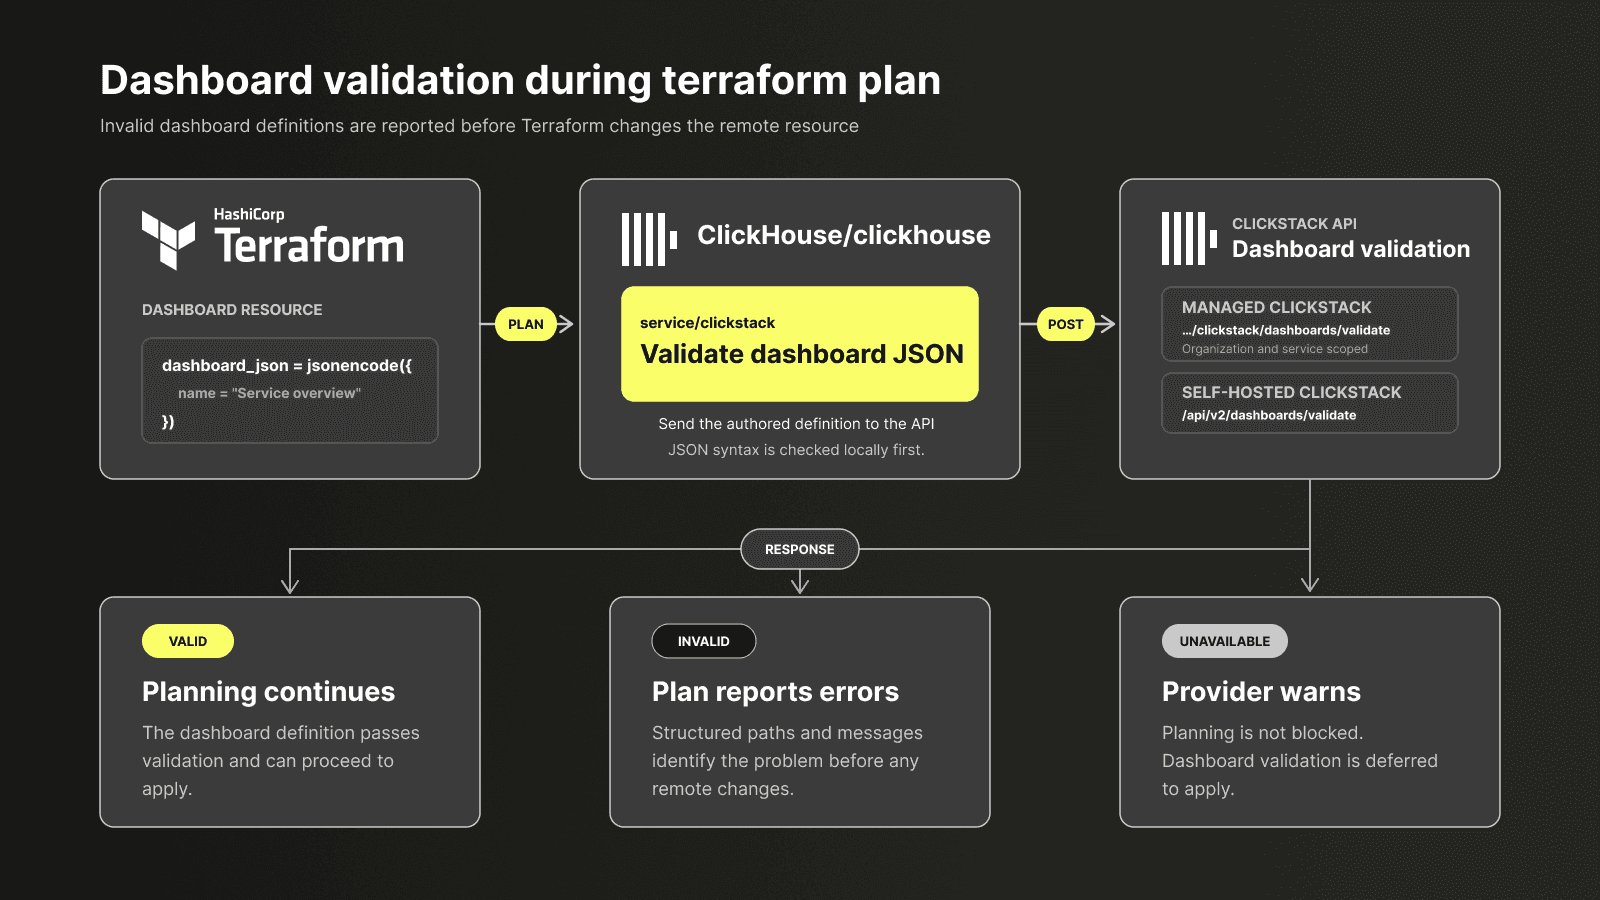
Note: If the validation endpoint is unavailable e.g. due to earlier versions of ClickStack, the provider emits a warning instead of blocking terraform plan. Validation is then deferred until terraform apply.
With these changes in place, users can manage ClickStack resources through the ClickHouse Terraform provider across both open-source and Managed ClickStack deployments.
Using ClickStack resources
While the following example uses the provider for configuring Managed ClickStack on ClickHouse Cloud, the same clickhouse_clickstack_dashboard resource also works with open-source self-hosted ClickStack. The resource definition stays the same but authentication and team scoping differ between the two deployments.
You will need Terraform 1.5 or later, at least version 3.25 of the ClickHouse provider, and an existing Managed ClickStack service. The dashboard below also assumes you have an OpenTelemetry logs source and ClickHouse connection configured.
Create a ClickHouse Cloud API key
The provider calls the ClickHouse Cloud API on your behalf. In the ClickHouse Cloud console, open Organization → API keys, select New API key, and create a key with Service Admin or Org Admin permissions. Save the key ID and secret somewhere secure.
You also need two non-secret identifiers:
- The organization ID for the ClickHouse Cloud organization.
- The service ID of the Managed ClickStack service you want Terraform to manage.
Copy both from the Cloud console. Make sure the service ID belongs to the service where you open ClickStack, rather than another ClickHouse service in the same organization.
> Cloud and self-hosted credentials - ClickHouse Cloud uses the organization ID, Cloud API key ID, Cloud API secret, and ClickStack service ID. A Managed ClickStack service maps to one team, so do not set the team on Cloud resources. Conversely, self-hosted ClickStack uses CLICKSTACK_ENDPOINT and CLICKSTACK_API_KEY instead. The key must be a personal API access key created in the ClickStack UI. For a non-default team, set the resource's team attribute to the team ID. Do not configure Cloud and self-hosted credentials in the same unaliased provider block.
Export the Cloud credentials
The provider reads credentials from environment variables. This keeps them out of the Terraform files and avoids committing a secret in `terraform.tfvars`.
export CLICKHOUSE_ORG_ID="<organization-id>"
export CLICKSTACK_SERVICE_ID="<managed-clickstack-service-id>"
export CLICKHOUSE_CLOUD_API_KEY="<api-key-id>"
export CLICKHOUSE_CLOUD_API_SECRET="<api-key-secret>"> For a self-hosted deployment, replace those Cloud environment variables with:
export CLICKSTACK_ENDPOINT="https://clickstack.example.com"
export CLICKSTACK_API_KEY="<personal-api-access-key>"Use your CI system's secret store when running Terraform in a deployment pipeline. The variable names can remain the same.
In our example, we’ll load dashboard objects. These refer to ClickStack sources and connections by ID. You can retrieve the available values from the ClickStack API using the credentials you exported above.
curl --silent \
--user "${CLICKHOUSE_CLOUD_API_KEY}:${CLICKHOUSE_CLOUD_API_SECRET}" \
"https://api.clickhouse.cloud/v1/organizations/${CLICKHOUSE_ORG_ID}/services/${CLICKSTACK_SERVICE_ID}/clickstack/sources" \
| jq -r '["SOURCE_ID","KIND","CONNECTION_ID","NAME"], (.result[] | [.id, .kind, .connection, .name]) | @tsv' \
| column -t -s $'\t'Copy the ID of a log source and its corresponding connection that you want the dashboard to query. Pass them to Terraform as input variables:
export TF_VAR_logs_source_id="68d20d409bc8769c8984585f"
export TF_VAR_connection_id="68b6b6dd5d2cada7d1c593ac"Configure the provider
Create an empty directory for the example, then add this provider configuration to [main.tf](http://main.tf):
terraform {
required_version = ">= 1.5.0"
required_providers {
clickhouse = {
source = "ClickHouse/clickhouse"
version = "~> 3.24.0"
}
}
}
provider "clickhouse" {}
variable "logs_source_id" {
type = string
}
variable "connection_id" {
type = string
}> The provider block is empty here because the four environment variables above supply its Cloud configuration. Add team = var.team_id to the dashboard resource only when targeting a non-default team in a self-hosted deployment.
Define the dashboard
Add the dashboard resource to main.tf. This example creates one log chart counting events per service over time:
variable "logs_source_id" {
description = "ID of the ClickStack logs source used by the dashboard"
type = string
}
resource "clickhouse_clickstack_dashboard" "simple_logs" {
dashboard_json = jsonencode({
name = "simple logs dashboard"
tiles = [
{
name = "Log count over time by service",
id = "9kcn995dbkdxjlw3jj28k"
x = 0
y = 0
w = 24
h = 11
config = {
name = "Logs over time"
sourceId = var.logs_source_id
displayType = "line"
granularity = "auto"
alignDateRangeToGranularity = true
select = [
{
aggFn = "count"
aggCondition = ""
aggConditionLanguage = "lucene"
valueExpression = ""
}
]
where = ""
whereLanguage = "lucene"
groupBy = "ServiceName"
}
}
]
filters = []
containers = []
})
}
output "dashboard_id" {
value = clickhouse_clickstack_dashboard.simple_logs.id
}The dashboard_json value maps to the ClickStack v2 dashboard API. Keeping it inside jsonencode lets you use Terraform variables without constructing JSON strings by hand.
Get started today
Interested in seeing how ClickHouse works on your data? Get started with ClickHouse Cloud in minutes and receive $300 in free credits.
Sign upPlan and apply the change
Initialize the directory, format and validate the configuration, then inspect the plan:
terraform init
terraform fmt
terraform validate
terraform planClickStack resources are beta. Terraform will print a beta warning during validation and planning; that warning is expected. Check that the plan contains one
clickhouse_clickstack_dashboard resource to add, then apply it:
dalemcdiarmid@Mac clickstack_terraform % terraform apply
Terraform used the selected providers to generate the following execution plan. Resource actions are indicated with the following symbols:
+ create
Terraform will perform the following actions:
# clickhouse_clickstack_dashboard.simple_logs will be created
+ resource "clickhouse_clickstack_dashboard" "simple_logs" {
+ dashboard_json = jsonencode(
{
+ containers = []
+ filters = []
+ name = "simple logs dashboard"
+ tiles = [
+ {
+ config = {
+ alignDateRangeToGranularity = true
+ displayType = "line"
+ granularity = "auto"
+ groupBy = "ServiceName"
+ name = "Logs over time"
+ select = [
+ {
+ aggCondition = ""
+ aggConditionLanguage = "lucene"
+ aggFn = "count"
+ valueExpression = ""
},
]
+ sourceId = "68d20d409bc8769c8984585f"
+ where = ""
+ whereLanguage = "lucene"
}
+ h = 11
+ id = "9kcn995dbkdxjlw3jj28k"
+ name = "Log count over time by service"
+ w = 24
+ x = 0
+ y = 0
},
]
}
)
+ id = (known after apply)
+ normalized_json = (known after apply)
}
Plan: 1 to add, 0 to change, 0 to destroy.
Do you want to perform these actions?
Terraform will perform the actions described above.
Only 'yes' will be accepted to approve.
Enter a value: yes
Apply complete! Resources: 1 added, 0 changed, 0 destroyed.
Outputs:
dashboard_id = "6a7daffaecf5dee21ed130c6"After the apply completes, open ClickStack → Dashboards for the service. The new dashboard should contain both tiles, and Terraform will print its dashboard ID as an output.
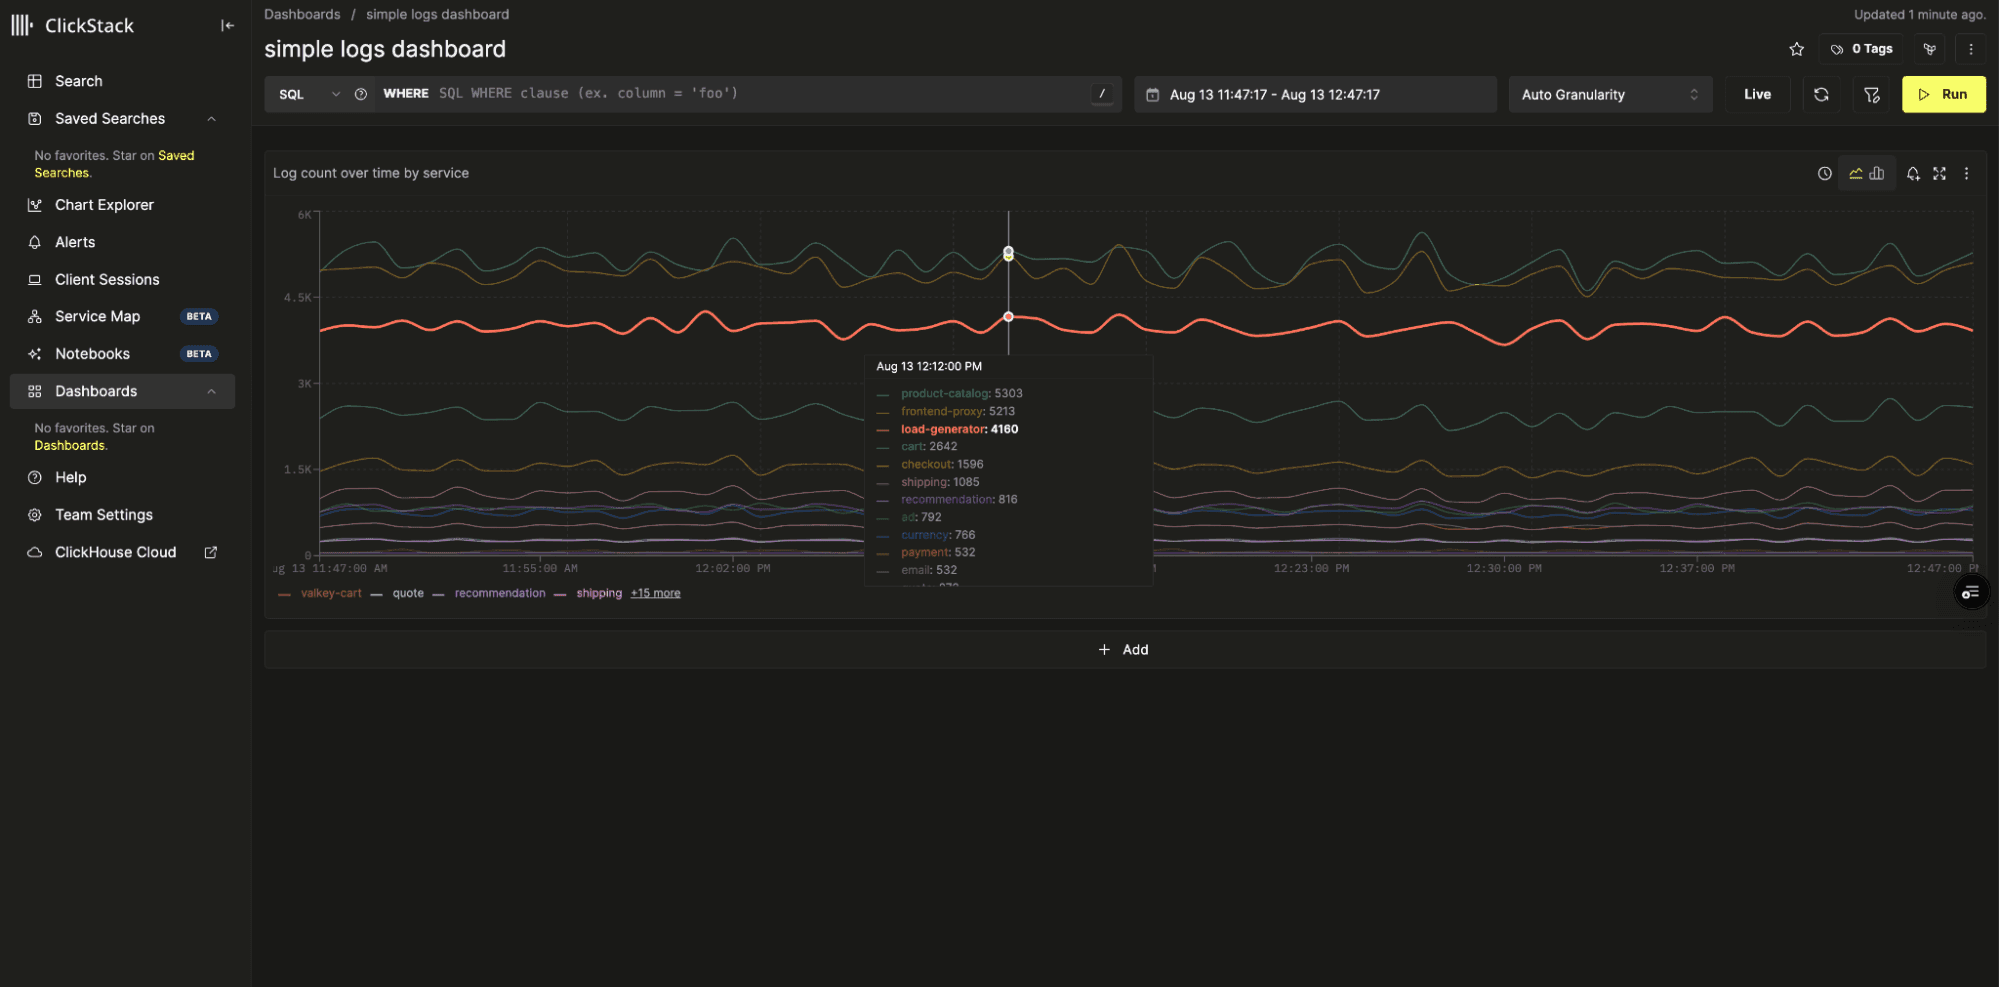
> Keep one source of truth. Manage a dashboard either in Terraform or in the ClickStack UI. The dashboard resource does not report UI edits as drift. Those edits remain until dashboard_json changes, at which point Terraform replaces the dashboard definition and can overwrite them.
Change the dashboard name, tags, or tile configuration and run terraform plan again to see the update before applying it. For a temporary test deployment, remove the dashboard when you are finished:
terraform destroyManaging existing dashboards
Existing dashboards can be brought under Terraform management with terraform import. Add a matching resource block first, then import the dashboard by ID:
terraform import clickhouse_clickstack_dashboard.collectors <dashboard-id>For a self-hosted dashboard in a non-default team, use <team-id>/<dashboard-id> as the import ID. The complete schema and import behavior are documented in the ClickStack dashboard resource.
Because you’ve been creating resources manually, we’ve also made it much easier to import existing ClickHouse resources into your Terraform configuration. Simply open the resource you want to bring into Terraform management in ClickStack, such as the dashboard shown below, select the Terraform icon, copy the generated import block into a .tf file, and run the terraform plan -generate-config-out=generated-dashboard.tf command. This workflow requires Terraform 1.5 or later.
You can also bulk-export all your existing resources and generate resource configurations.
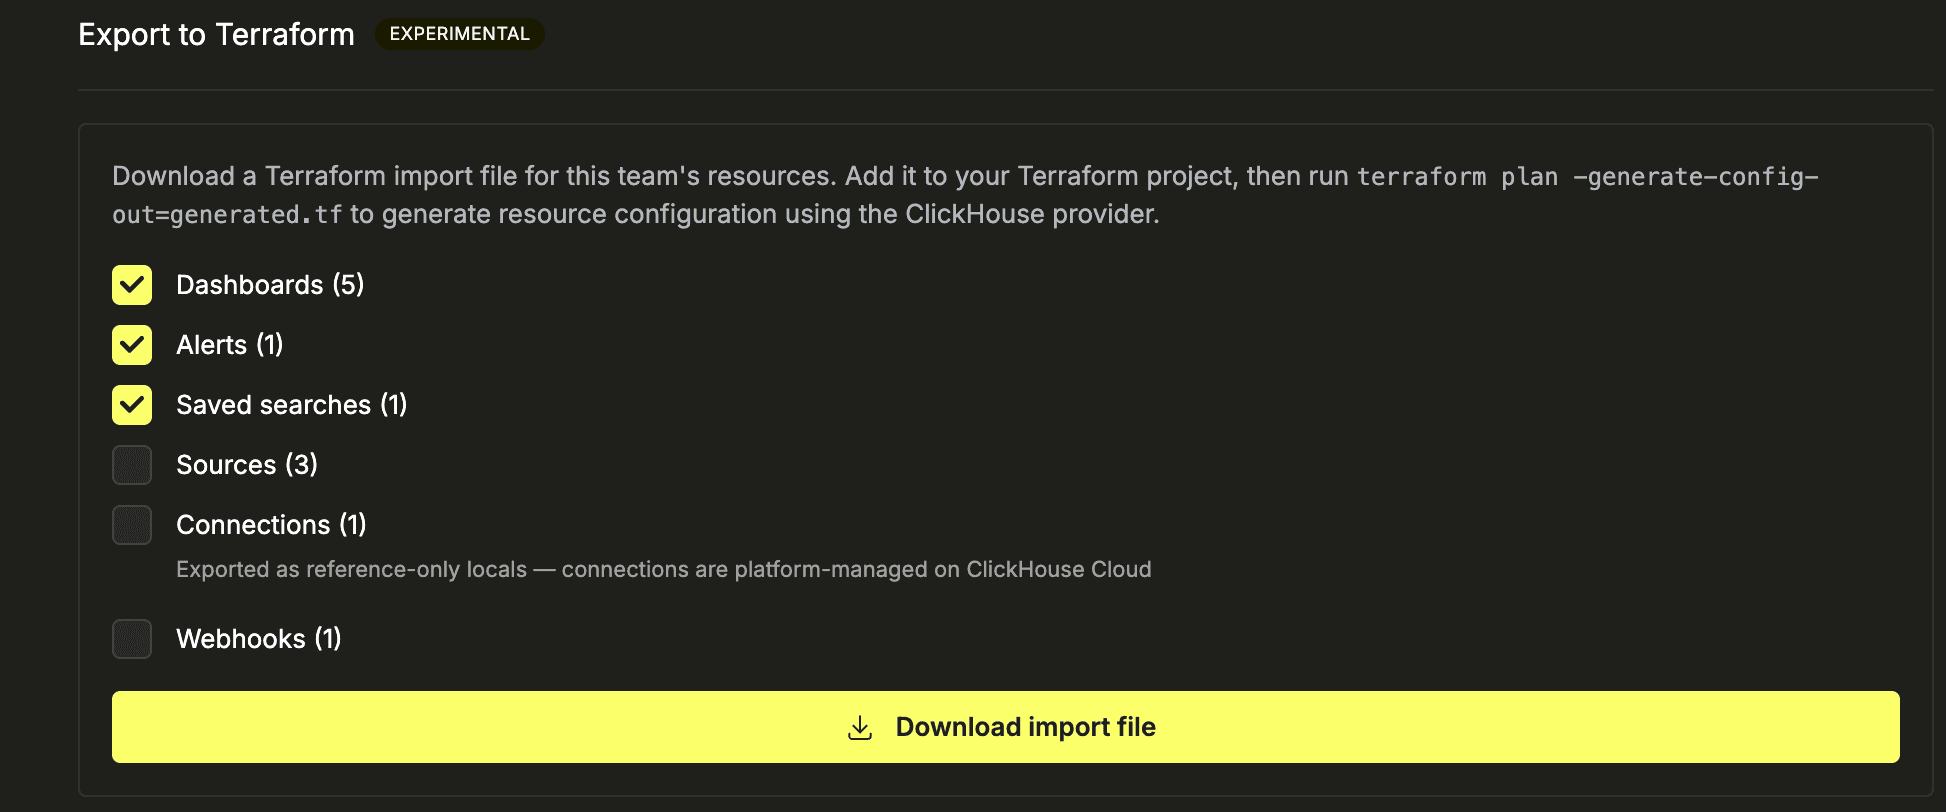
The exported file can then be used to bring the entire ClickStack deployment under Terraform management. For example:
cp ~/Downloads/hyperdx-import.tf .
terraform init
terraform plan -generate-config-out=generated-dashboard.tfConclusion
ClickStack resources can now follow the same review and deployment process as the rest of your infrastructure. Teams can reproduce observability configuration across environments, inspect changes before applying them, and bring existing resources under Terraform management through import.
Folding this work into ClickHouse/clickhouse also means one provider, one release path, and consistent authentication for Managed ClickStack. The same resources work with open-source, self-hosted ClickStack using its endpoint and a personal API access key.
ClickStack support is available in version 3.25.0 of the provider. Start with the provider documentation, try it with an existing dashboard, and share any issues or unexpected behavior through the provider’s GitHub repository.
Get started today
Interested in seeing how ClickHouse works on your data? Get started with ClickHouse Cloud in minutes and receive $300 in free credits.
Sign up