50.4k
50.4k
In the spring, I wrote about where we wanted to take the ClickHouse Grafana plugin. A good share of that has now shipped. The recent work, which was done in close partnership with Grafana Labs, has focused on making the common cases of finding a log line, narrowing to one service, or detecting a deployment, faster without SQL, while always ensuring full SQL is just one click away for more advanced needs.
Contributors
As always, thank you to our open source contributors and users who help improve the plugin for everyone.
aangelisc, adamyeats, akkikumar72, alyssajoyner, bossinc, fabrizio-grafana, fleon, hkrutzer, itsgareth, itsmylife, iwysiu, karl-power, katebrenner, lwandz13, MattiasMTS, mattvella07, Orenico10, SaiPrasanna9, stackempty, Tarasusrus
When working on the user experience, our efforts are focused on optimizing for the common adoption path that we see our users take - sending OpenTelemetry logs and traces into ClickHouse, as well as increasingly metrics, using the ClickHouse exporter for the OpenTelemetry Collector, before reaching for Grafana to investigate.
The query builder has always been part of the plugin since v1, but for someone new, or for a user looking to quickly filter events, design inefficiencies meant it was often faster to drop into writing ClickHouse SQL by hand. The recent work has focused on making the common cases of finding a log line, narrowing to one service, or detecting a deployment, faster without SQL, while always ensuring full SQL is just one click away for more advanced needs. We’ve linked the pull request behind each feature so you can dig in.
Search first, SQL one click away
If you’ve just got a table with logs in it, configuring the datasource shouldn’t be complicated. Single-table mode (#1832) is designed for exactly that use case. Point the datasource at your table, confirm its columns, and the editor gets out of your way - giving you a simpler, more focused experience.
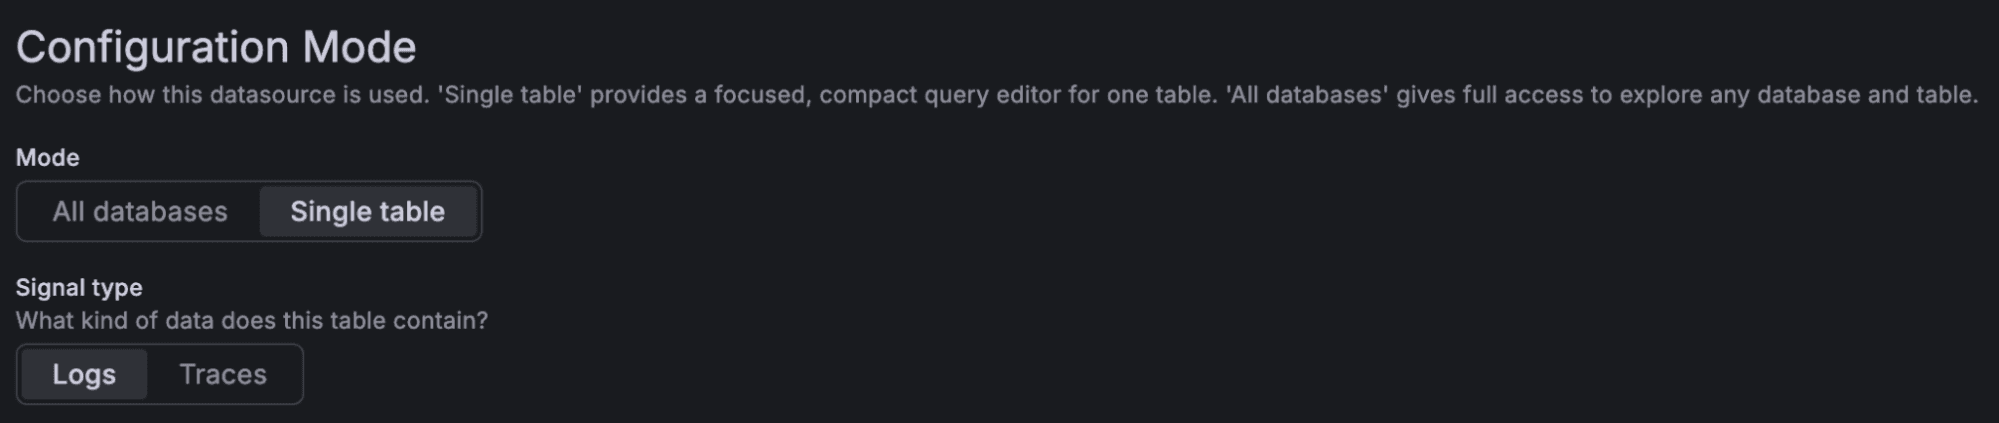
Single table configuration mode
With single-table mode configured, compact query mode (#1841) replaces the full builder with a more focused experience: type a log message and the plugin writes the query for you, while type-aware filters, query history, and a live SQL preview help you refine it. The generated SQL is always available to copy or edit directly.
While the compact editor is currently scoped to single-table configurations, this aligns perfectly with common Grafana patterns where users create dedicated data sources for specific log or trace streams. For example, you could easily create "Logs - Prod", "Logs - Staging" and so on. This approach not only provides a focused experience; to try it, simply create a targeted datasource for your specific table, open Explore, and let us know how it works for your workflow.
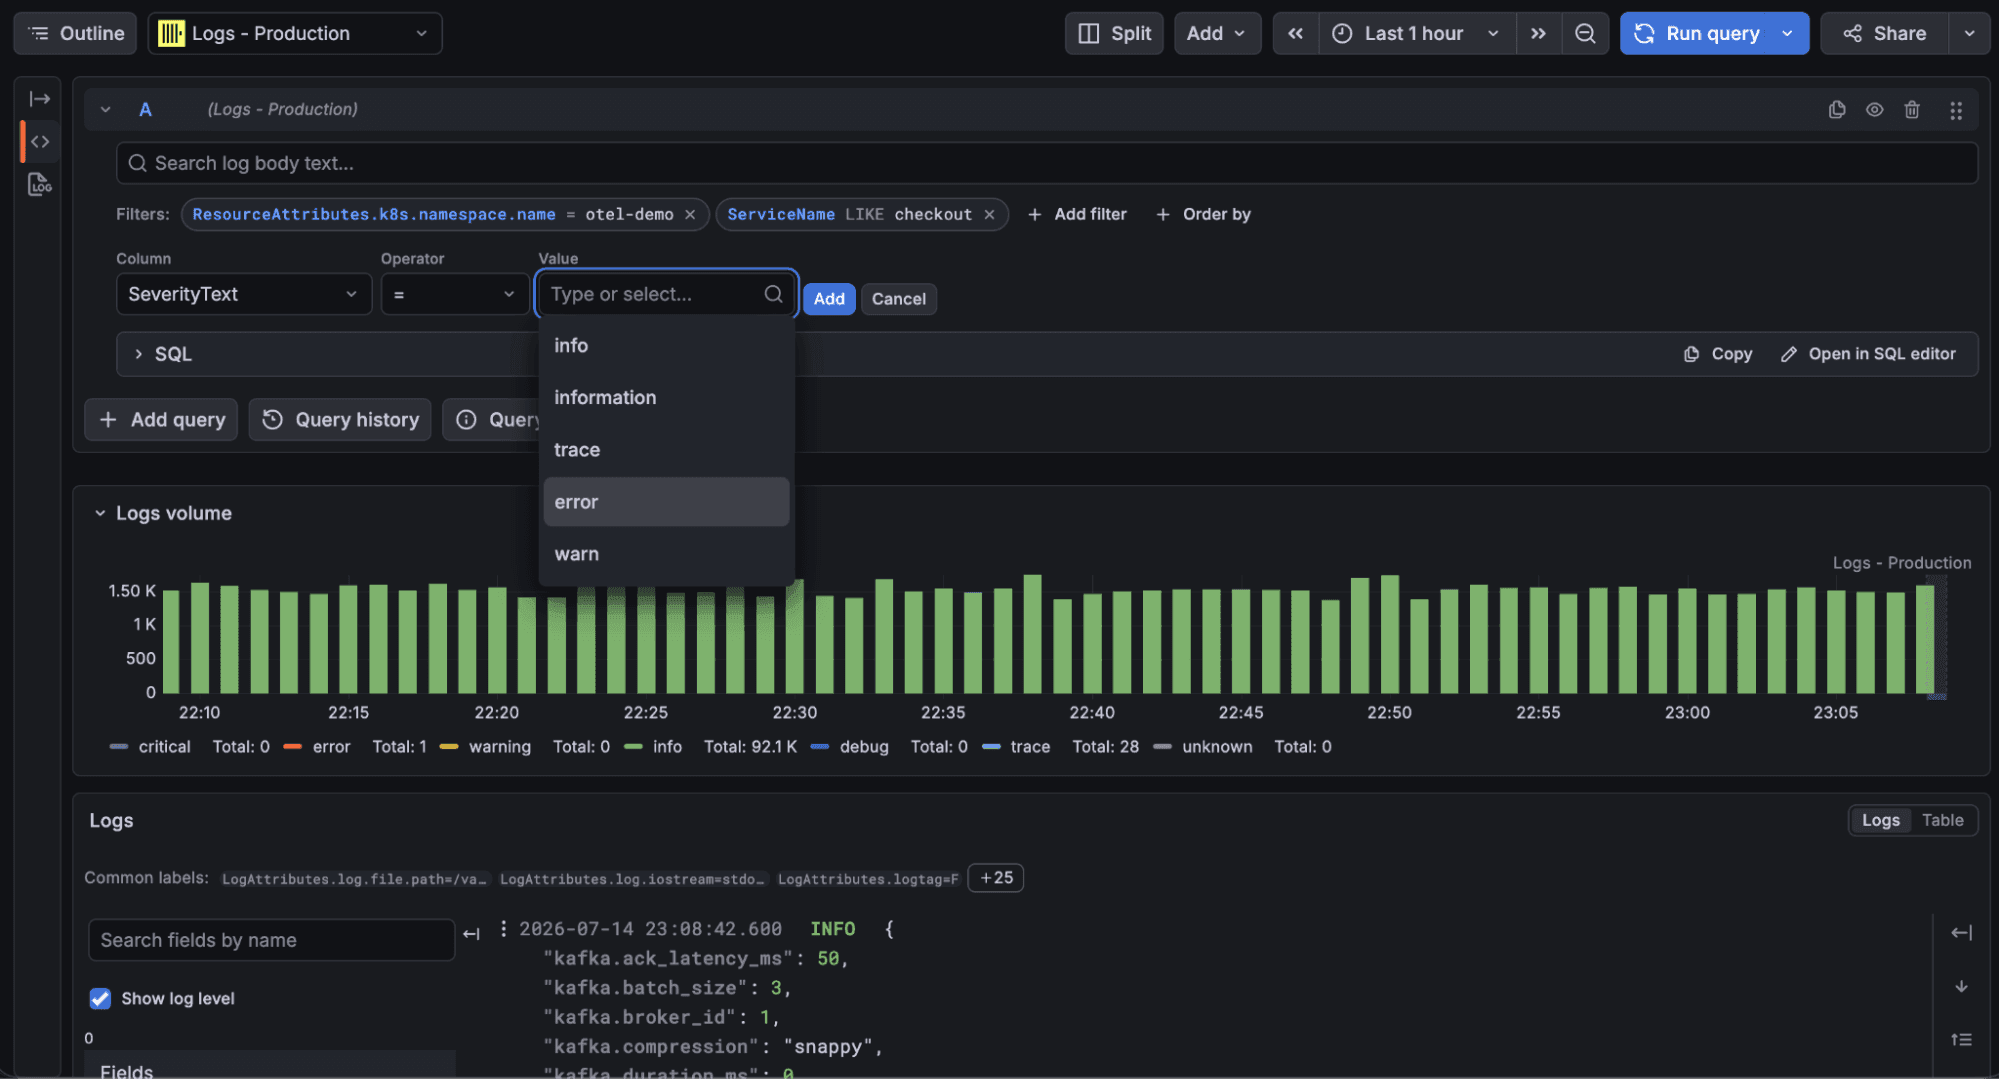
Compact query mode in Explore, with the search box, type-aware filters, query history, and the live SQL preview
Note: Early users provided feedback that they would like the ability to show custom fields/columns for their logs in the compact mode, whether for those using the OpenTelemetry or custom schema e.g. Query logs. This has been addressed by a new improvement under PR #2108, and will be included in the next plugin build.
Investigate by clicking, not typing
Most investigations are iterative: you start with a search, inspect the results, and then narrow or widen them by applying and removing filters. The latest plugin improvements let you follow that flow by clicking, without needing to edit the SQL.
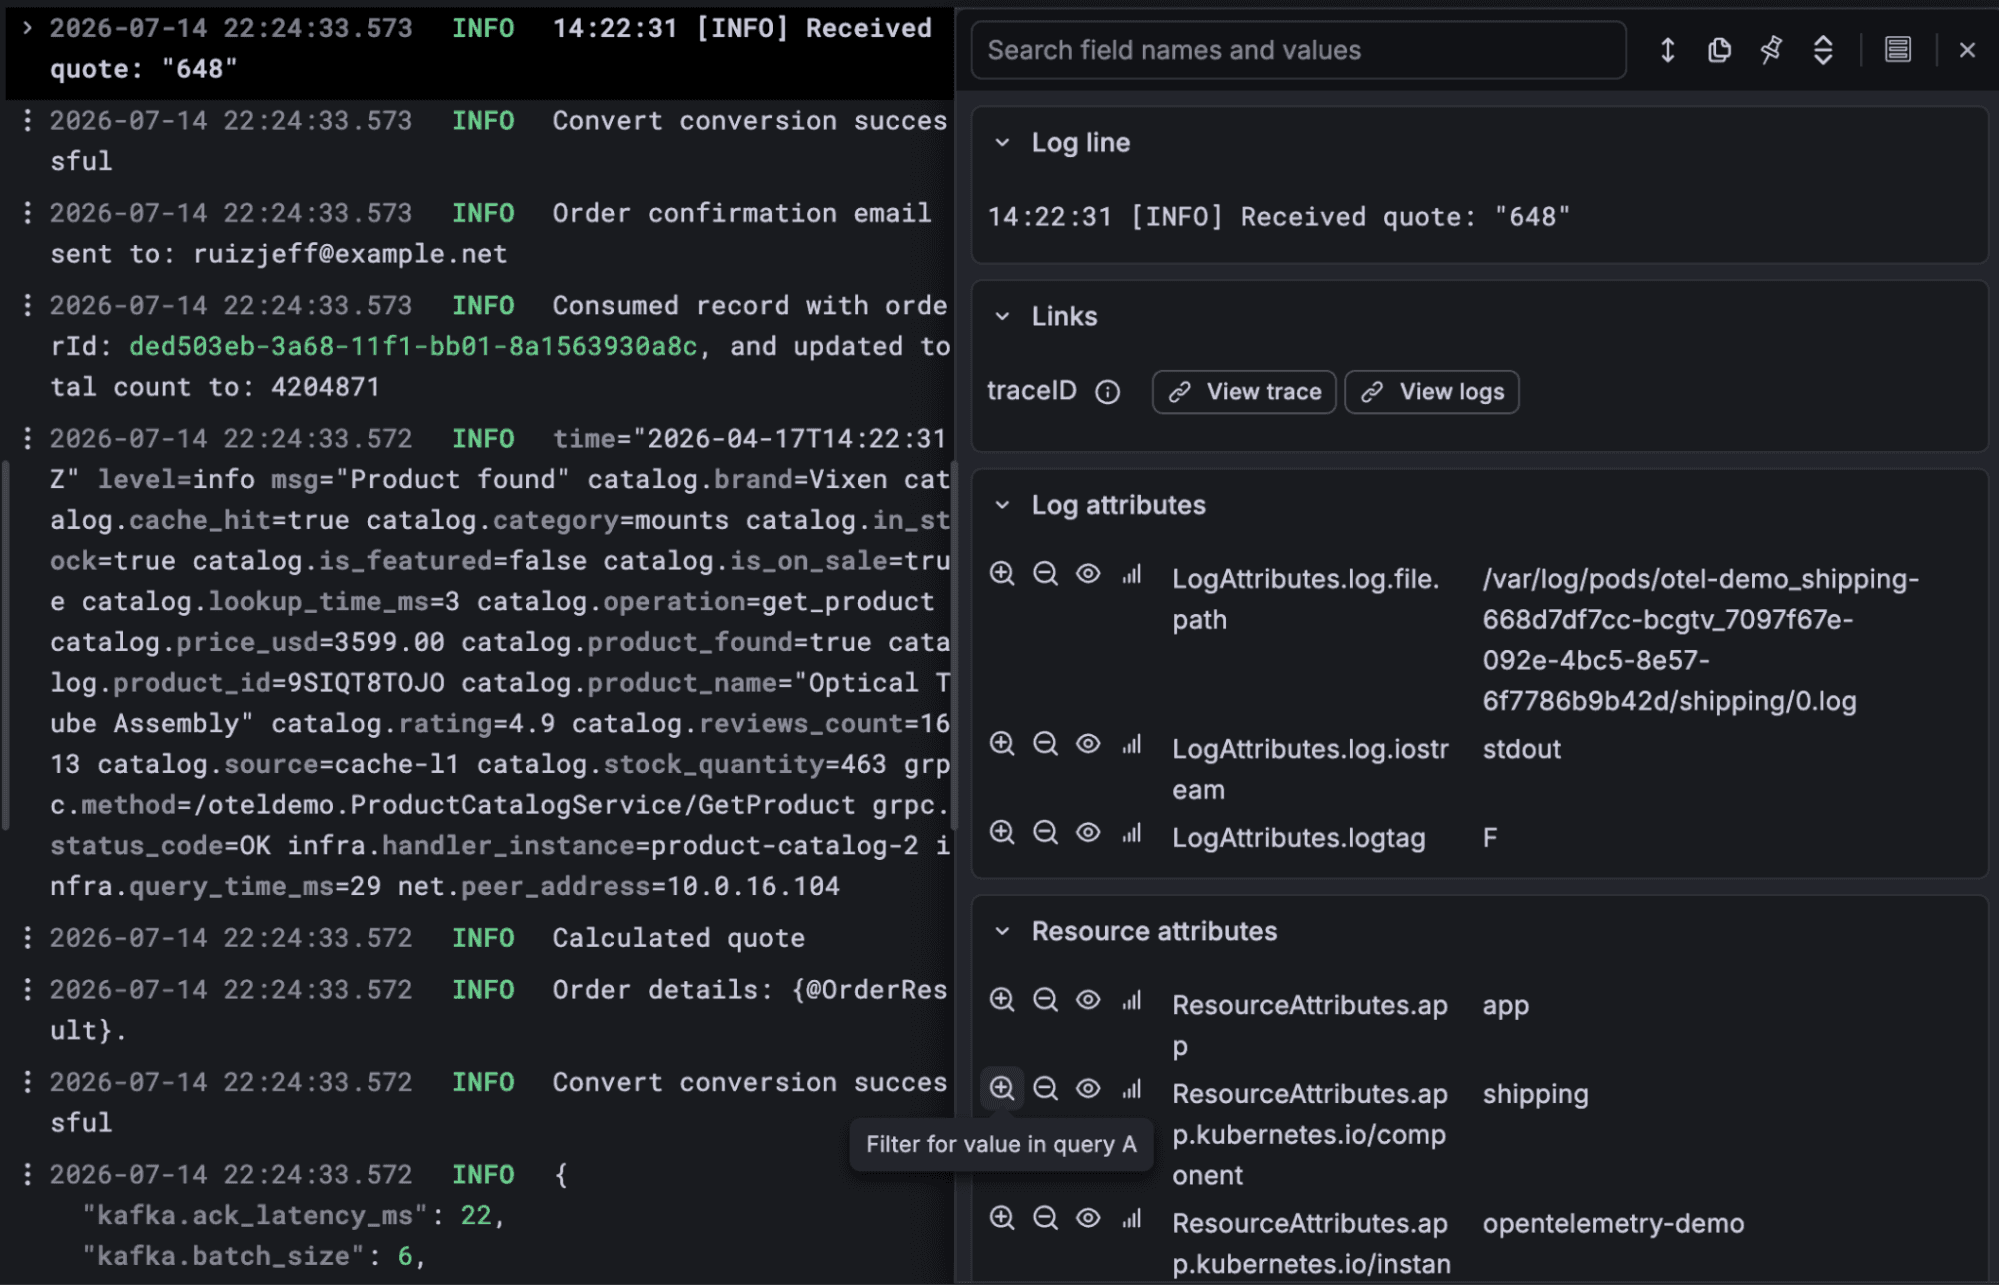
Expanded log rows now organize OpenTelemetry attributes into collapsible Resource, Scope, and Log sections (#1829). From there, you can filter for or filter out any value; applied filters are highlighted, and clicking one again removes it (#1824). You can also select text within a log message and filter on that substring directly (#1738).
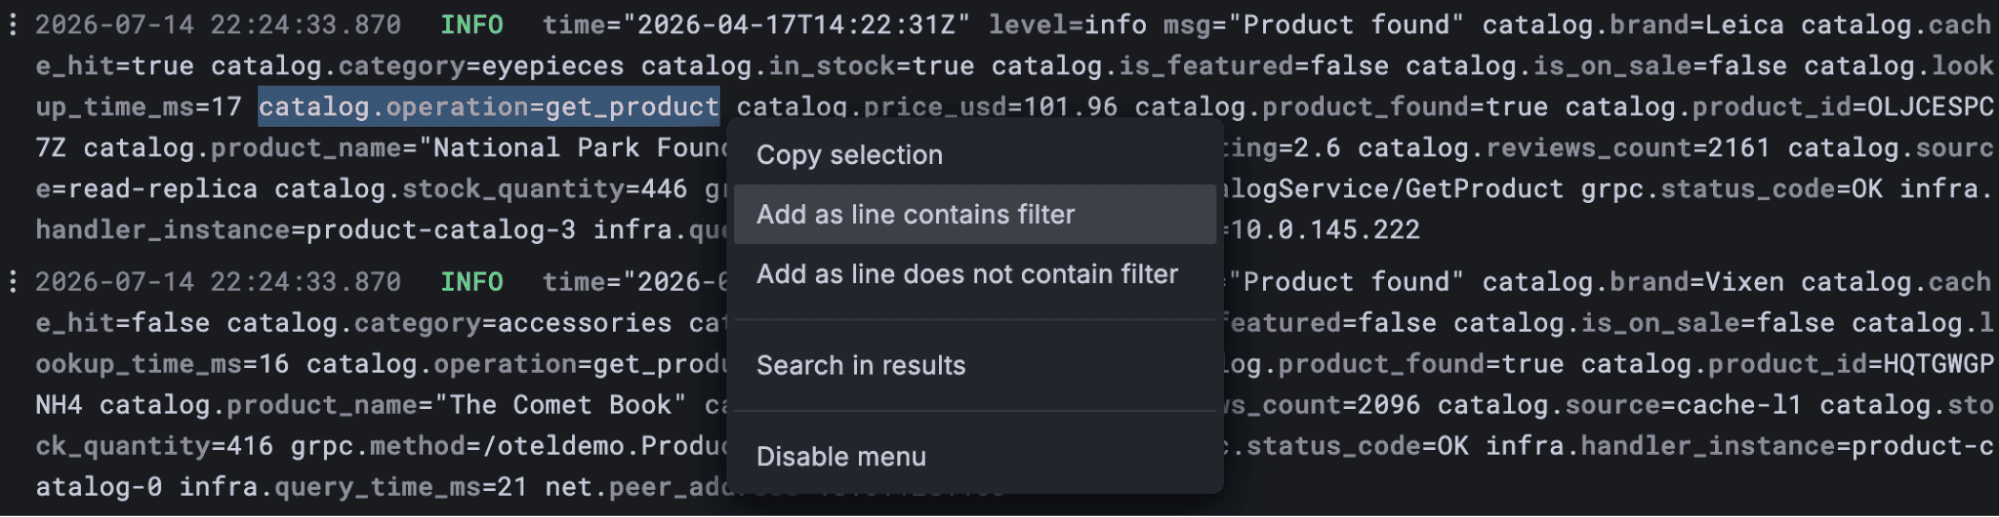
Filter on the text highlight to filter
Additionally, for dashboards, ad hoc filters can now discover keys and values within ClickHouse Map columns and can apply filters across multiple tables (#1793, #1757). Aliases and OpenTelemetry Map keys are resolved consistently whether you add a filter by clicking or through the query builder.
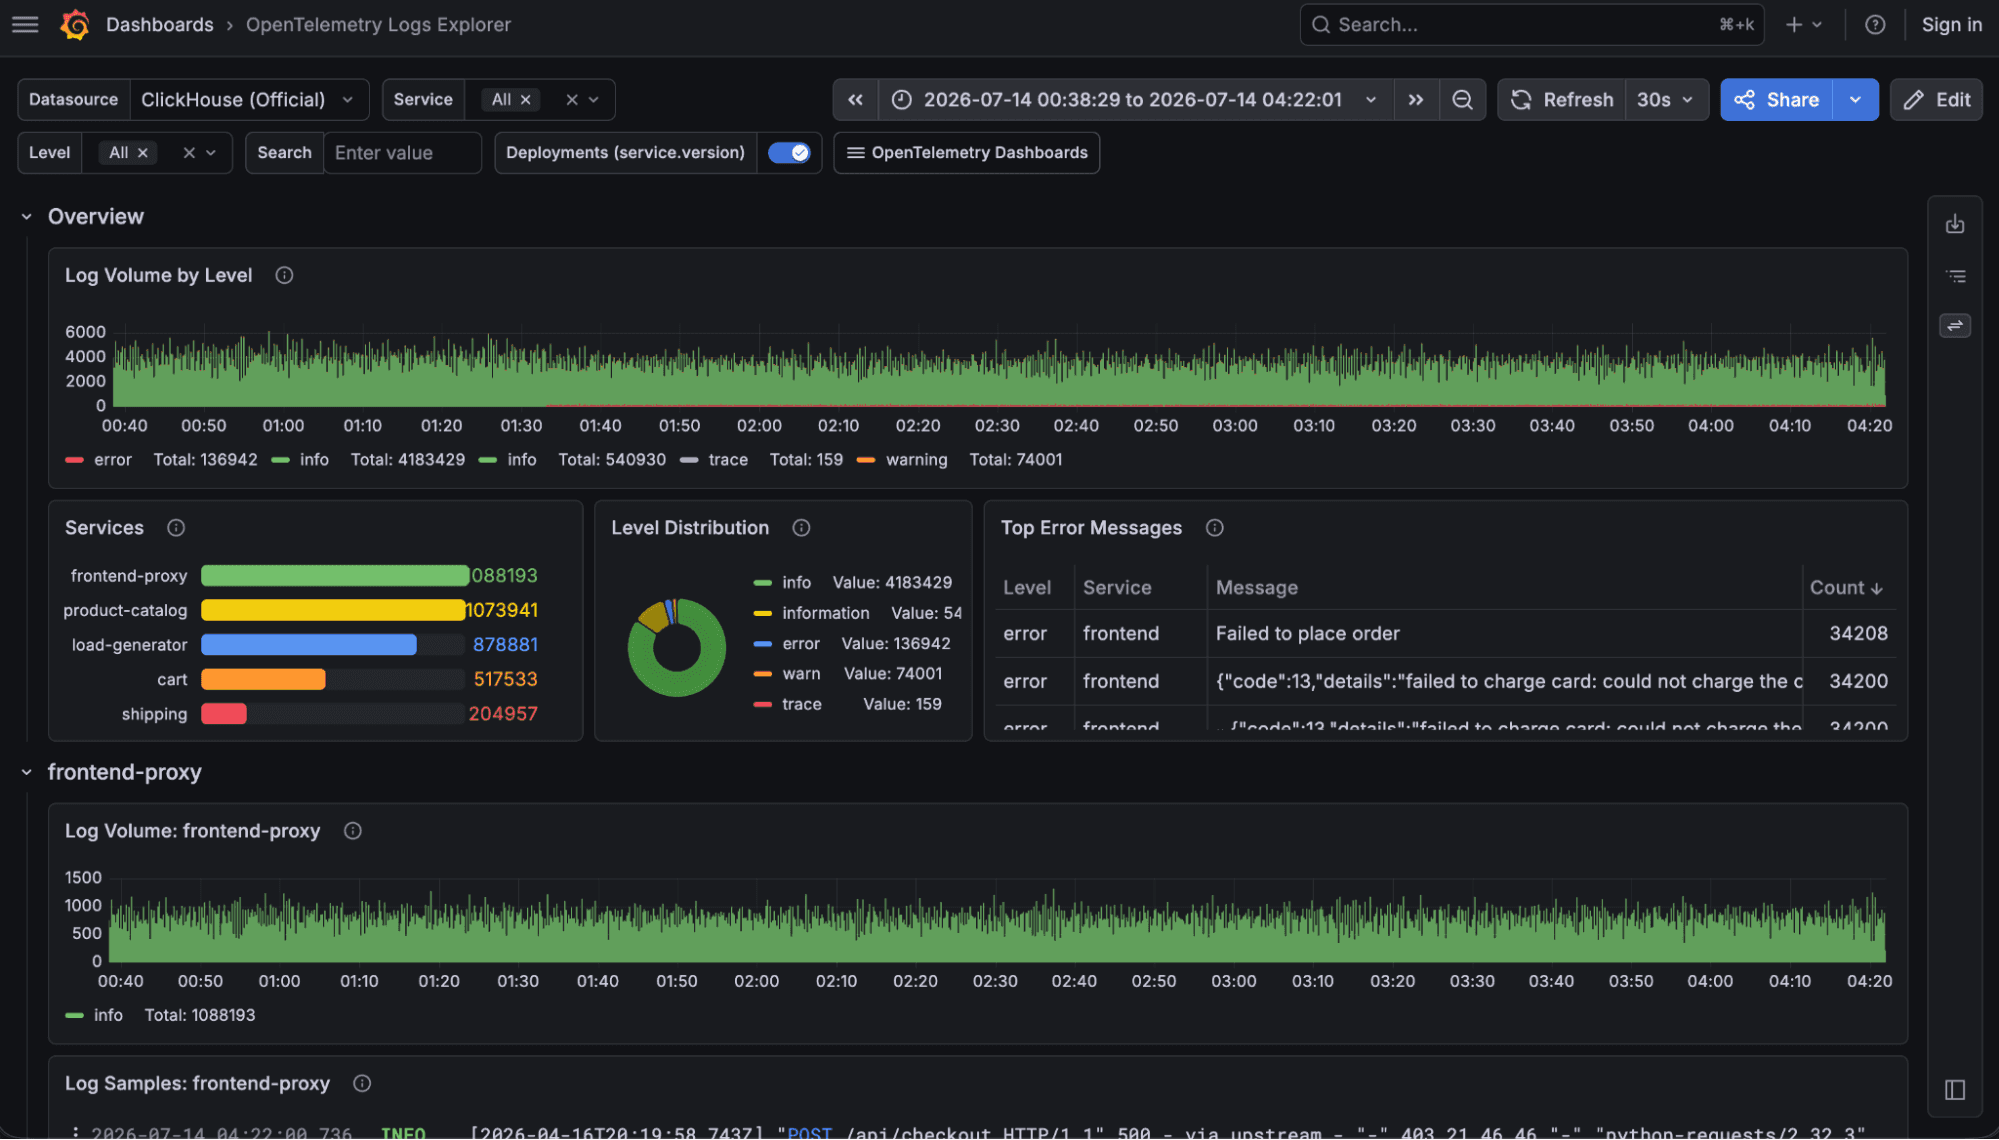
Out-of-the-box dashboards - useful the moment you connect
As OpenTelemetry rises as the industry standard for collecting and storing logs and traces, ClickHouse has been uniquely tuned to handle that data at scale. To ensure you can derive immediate value from this data, the plugin now includes three OpenTelemetry dashboards out of the box (#1869): a Logs Explorer, a Traces Explorer, and a per-service deep dive that ties logs and traces together.
These panels are fully interactive with filters, annotations, log samples panels per each service and similarly KPIs and top errors for traces and service dashboards.
Less SQL for dashboard scaffolding
Building richer dashboards often means adding variables and annotations, but until now both required users to write the underlying SQL. That added unnecessary complexity to common tasks such as making a dashboard filterable or marking deployments on a chart.
The new annotation editor (#1922) provides a guided experience: select a column to monitor, such as service.version, and the plugin generates the change-detection SQL automatically. This allows both changes and reversions to be easily detected, allowing deployments and rollbacks to appear as separate markers. The guided variable editor (#1868) works similarly: choose a column, including a key within a Map column, and it generates the SQL needed to retrieve its distinct values. In both editors, the generated SQL remains visible and editable, and any changes you make take precedence.
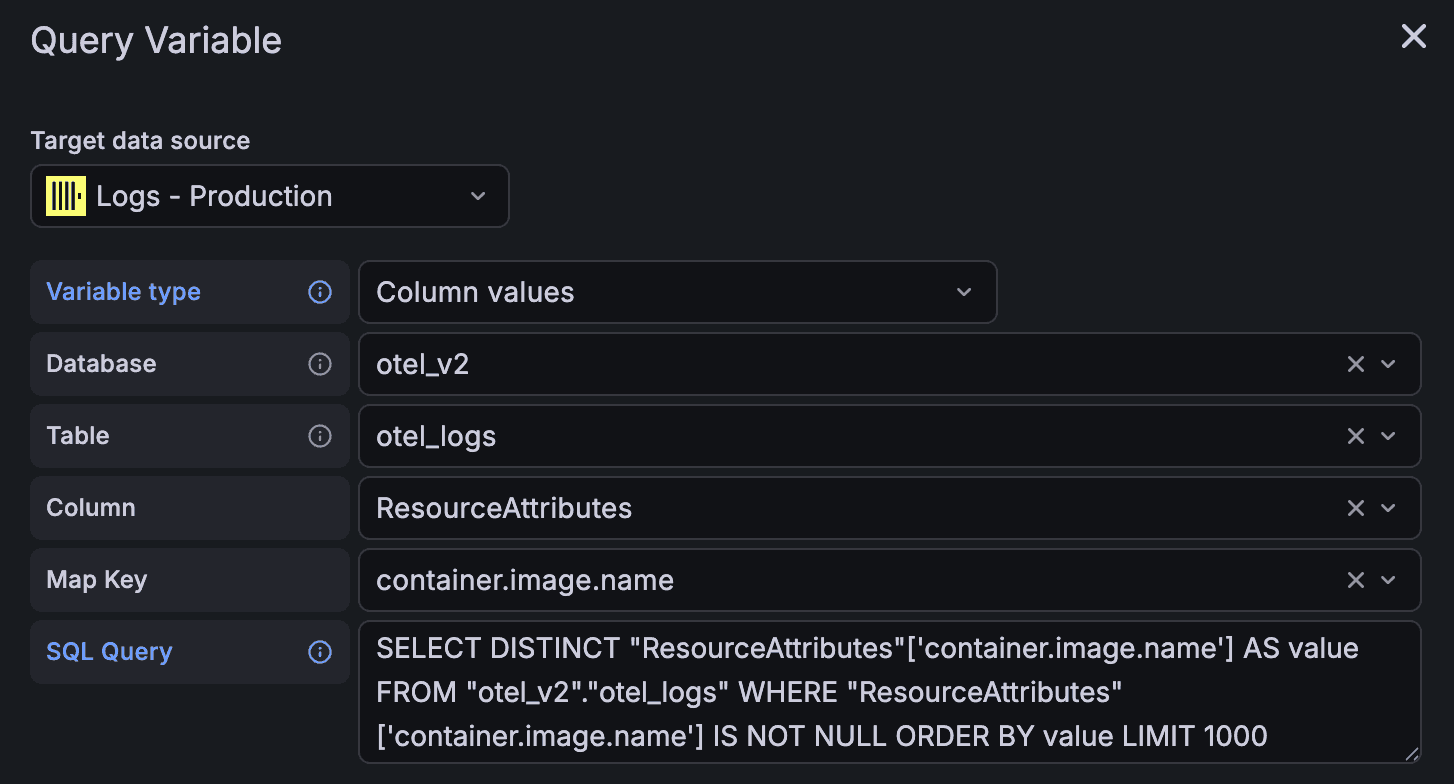
The annotation editor’s change-detection preset and the guided variable editor
Get started today
Interested in seeing how ClickHouse works on your data? Get started with ClickHouse Cloud in minutes and receive $300 in free credits.
Sign upTry it
To try the plugin, make sure you're on version 4.20 or later of the ClickHouse data source (install or update it from the Grafana plugin catalog), then point a data source at your OpenTelemetry tables.
The principle behind all of these improvements is the same one we set out in the spring: common tasks shouldn’t require SQL, but SQL should always be one click away when you need it. If you use ClickHouse with Grafana, the most valuable feedback you can give us is where the experience still gets in your way. Compact query mode is intentionally starting with single-table data sources so we can learn from real-world usage before taking it further.
Appendix: everything else that shipped
Not every improvement warrants a headline. Many of these changes are small on their own, but together they make the plugin faster, more reliable, and easier to use.
- A smarter builder. Conventional log columns are detected automatically (#1791); tooltips link directly to relevant documentation (#1790); and a shared schema picker now powers the builder, variable editor, and annotation editor (#1828). Time columns are also combined into a single
ORDER BY(#1695) for better primary key usage. Explore can show raw log samples beneath metrics charts (#1744), and attribute columns can use JSON as well as Map types (#1866). - Better performance. Schema introspection is cached per datasource (#1787), while fast trace-ID lookup is no longer tied to OpenTelemetry mode (#1786).
- Grafana 13 readiness. Compatibility work clears the path to Grafana 13 without changing behaviour on Grafana 11.6 or 12.x (#1861, #1863).
- Greater reliability. Span links open the correct linked trace (#1890), and SQL validation now uses a port of ClickHouse's own lexer (#1778).
- Self-observability. The plugin backend is instrumented with OpenTelemetry, with a machine-readable contract for its spans (#1734, #1735).
- Attribution and identity. When header forwarding is enabled, queries can carry the Grafana user’s identity into ClickHouse for row policies, quotas, and query-log attribution (#1797). This release also adds foundational support for Grafana’s SQL abstractions (#1756).