You're staring at a log line: Order abc123 failed: error:timeout. Which service timed out? Payment? Database? Network? You open ClickStack, click the trace ID, and instantly see the full request timeline: the Order API waited 3 seconds for the Payment Service, which was still running a fraud check when the connection was killed. Root cause identified in two clicks.
That's the power of distributed tracing. With minimal OpenTelemetry setup in ASP.NET, you can move from isolated log lines to a full cross-service execution view in ClickStack, seeing exactly where time was spent and where things broke across service boundaries.
In this post, we'll build two ASP.NET services instrumented with OpenTelemetry, persist data to SQLite, and ship traces, logs, and metrics to ClickStack.
What we're building
ClickStack is an open-source, all-in-one observability stack for OpenTelemetry. It accepts standard OTel data, stores it in ClickHouse, lets you explore it in a UI, and still gives you direct SQL access to the underlying telemetry.
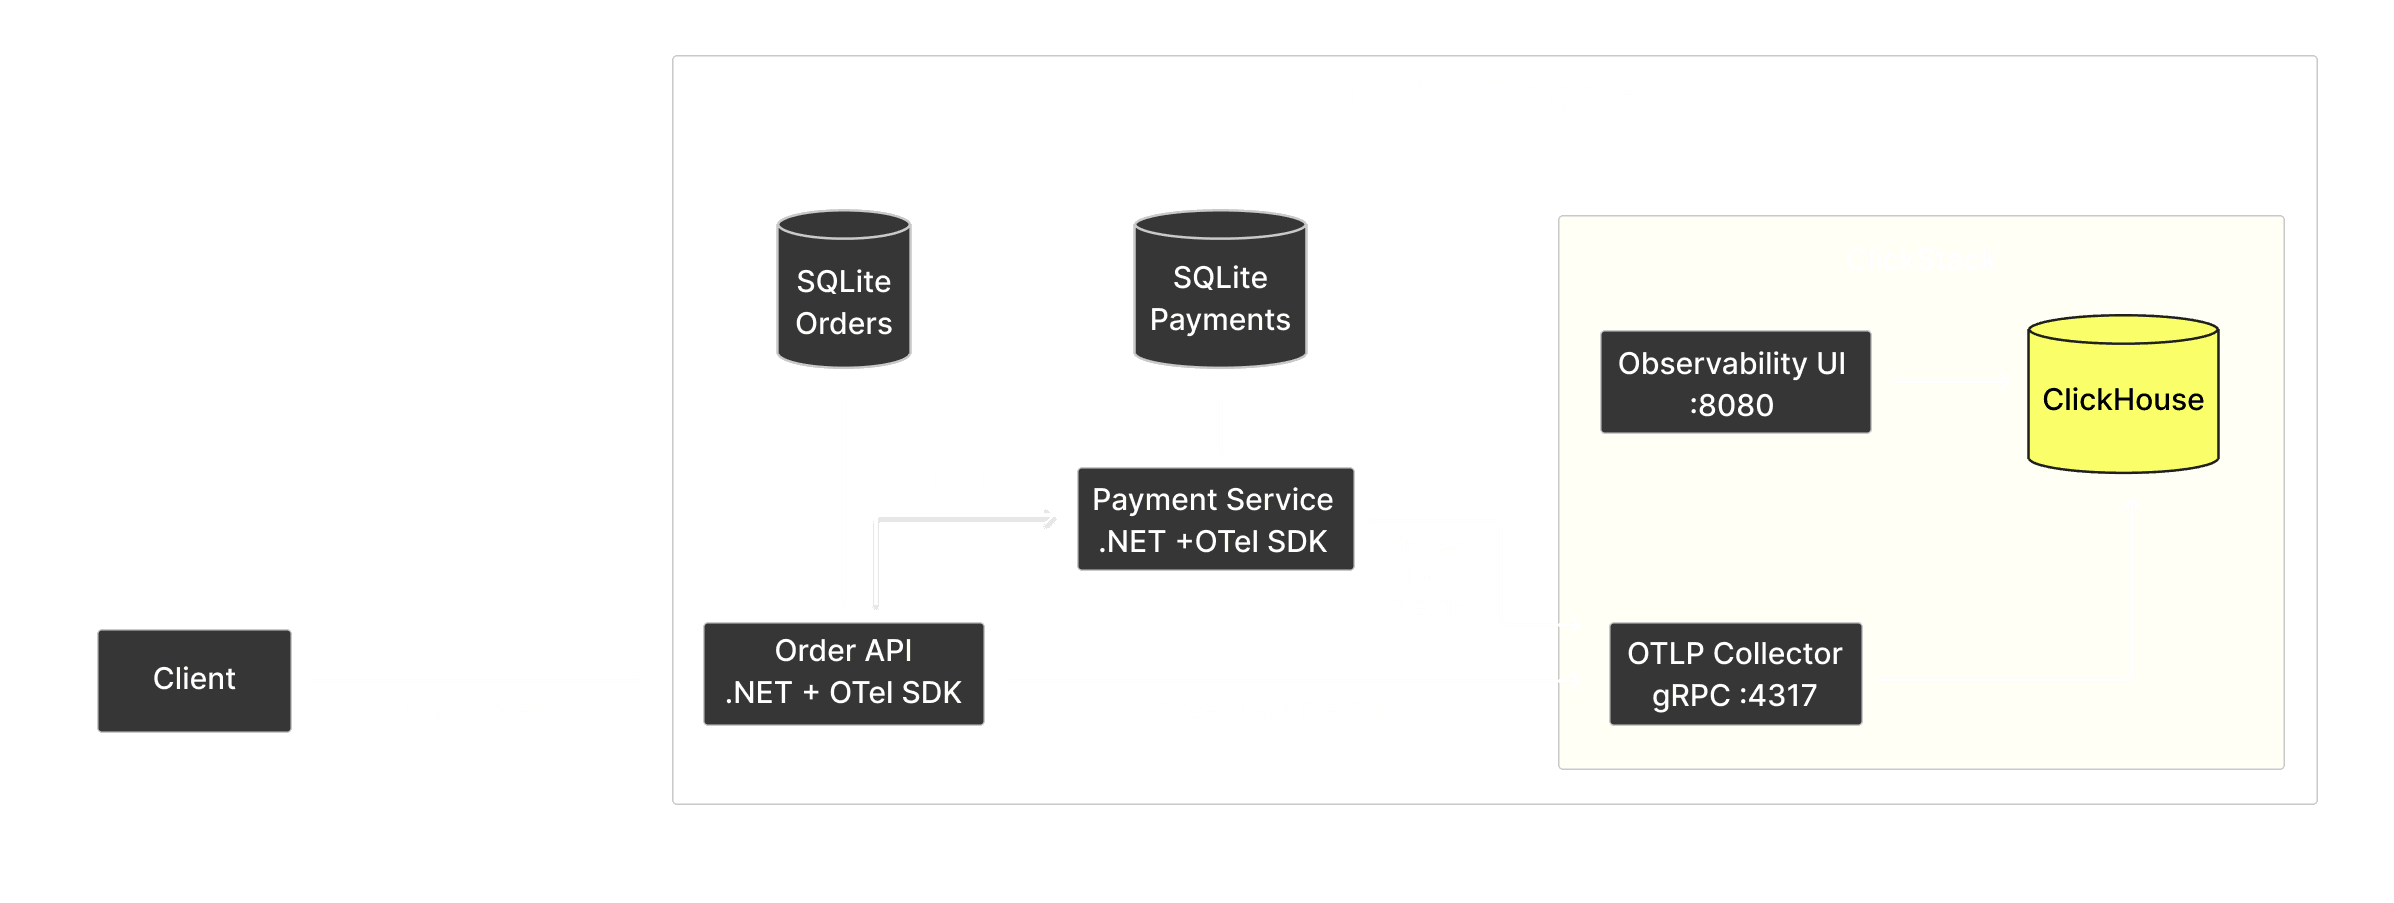
In this post, we will build two ASP.NET services that talk to each other and persist data to SQLite:
- Order API: accepts orders, validates inventory, calls Payment Service, saves completed orders to SQLite
- Payment Service: simulates payment processing with configurable failure modes, saves payment results to SQLite
Both services are instrumented with OpenTelemetry and export all three signals (traces, logs, metrics) via OTLP/gRPC to ClickStack. We're using SQLite simply to keep the demo self-contained, while still showing how database spans appear automatically through EF Core instrumentation. The SQLite layer is auto-instrumented via the EF Core instrumentation package, which means database operations show up in ClickStack with zero manual span creation.
The flow for a single order:
- Client POSTs to Order API
- Order API validates inventory (product catalog in SQLite)
- Order API calls Payment Service over HTTP
- Payment Service runs a fraud check, processes the charge, saves the result to SQLite
- Order API receives the payment result, then saves the order to SQLite
When we're done, we will be able to use ClickStack to follow a single request across multiple services and database calls: the Order API validating the request, an HTTP call crossing into the Payment Service for fraud checking and charge processing, with database writes on both sides, all nested under one trace ID.
Why ClickStack?
- Works out of the box with OpenTelemetry. ClickStack exposes an OTLP/gRPC endpoint out of the box. Point your OTel SDK at it and traces, logs, and metrics start flowing. No custom exporters, no schema setup, no intermediate pipeline to manage.
- ClickHouse under the hood. ClickHouse is an open-source columnar database built for real-time analytics over large datasets. All telemetry data lands in ClickHouse tables, which means columnar compression (10–20x is typical), sub-second analytical queries over billions of spans, and full-text search via inverted indexes. You get the power of a real database, not a purpose-limited query language. And all of this comes at a fraction of the cost compared to traditional observability solutions.
- Correlated signals. Because ClickStack receives traces, logs, and metrics together, it can automatically link them: click a log line to jump to its parent trace, view logs scoped to a specific trace's time window, or drill from a latency spike in metrics down to the individual spans that caused it.
- SQL access to everything. Your telemetry is stored in standard ClickHouse tables. Query them directly with SQL, build materialized views for real-time aggregations, or connect tools like Grafana alongside the built-in UI.
Compared to ElasticSearch, ClickHouse achieves ~5x better compression and 4x+ faster queries in realistic benchmarks. Trip.com migrated from Elasticsearch to ClickHouse and built a 50PB logging platform with 4x the data capacity on the same hardware.
Setting up the infrastructure
The entire stack runs in Docker Compose. ClickStack handles everything on the observability side: the image bundles ClickHouse for storage, an OTLP/gRPC collector for ingestion, and an observability UI for exploration.
services:
clickstack:
image: docker.io/clickhouse/clickstack-all-in-one:2.21.0
ports:
- "8080:8080" # ClickStack UI
- "18123:8123" # ClickHouse HTTP (Play UI)
volumes:
- ./clickstack/entry.sh:/etc/local/entry.sh:ro
- clickhouse_data:/var/lib/clickhouse
- clickhouse_logs:/var/log/clickhouse-server
healthcheck:
test: ["CMD-SHELL", "wget -qO /dev/null http://127.0.0.1:8123/ping || exit 1"]
interval: 5s
timeout: 3s
retries: 10
start_period: 10sThen we add our two ASP services, which depend on ClickStack being healthy before starting, and a seed-data container that automatically generates traffic once everything is up:
order-api:
build:
context: .
dockerfile: src/OrderApi/Dockerfile
ports:
- "5000:8080"
environment:
- ASPNETCORE_ENVIRONMENT=Development
- OTEL_EXPORTER_OTLP_ENDPOINT=http://clickstack:4317
- PaymentService__BaseUrl=http://payment-service:8080
depends_on:
clickstack:
condition: service_healthyThat OTEL_EXPORTER_OTLP_ENDPOINT environment variable is all the OTel SDK needs to know where to send data. ClickStack exposes an OTLP/gRPC receiver on port 4317 by default.
Start everything:
docker compose up -d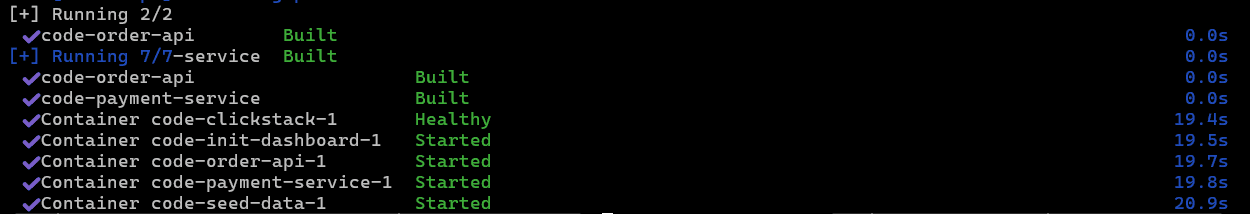
Building the Payment Service and Order API
OpenTelemetry setup
The OTel configuration in Program.cs sets up traces, metrics, and logs:
builder.Services.AddOpenTelemetry()
.ConfigureResource(resource => resource.AddService(DiagnosticConfig.ServiceName))
.WithTracing(tracing => tracing
.AddAspNetCoreInstrumentation()
.AddHttpClientInstrumentation()
.AddEntityFrameworkCoreInstrumentation()
.AddSource(DiagnosticConfig.ActivitySourceName)
.AddOtlpExporter())
.WithMetrics(metrics => metrics
.AddAspNetCoreInstrumentation()
.AddHttpClientInstrumentation()
.AddMeter(DiagnosticConfig.MeterName)
.AddOtlpExporter());
builder.Logging.AddOpenTelemetry(options =>
{
options.IncludeFormattedMessage = true;
options.IncludeScopes = true;
options.AddOtlpExporter();
});A few things to note:
- Three instrumentation libraries cover the common cases:
AddAspNetCoreInstrumentation()captures incoming HTTP requests,AddHttpClientInstrumentation()captures outgoing HTTP calls, andAddEntityFrameworkCoreInstrumentation()captures database operations. ConfigureResource(resource => resource.AddService(DiagnosticConfig.ServiceName)): this is how our service name appears in ClickStack.AddSource(DiagnosticConfig.ActivitySourceName)tells the tracer to listen for our custom spans (more on this below).AddOtlpExporter()on each signal sends data via OTLP/gRPC to whateverOTEL_EXPORTER_OTLP_ENDPOINTpoints to (in our case, ClickStack).- Logs are configured separately via
builder.Logging.AddOpenTelemetry(). TheIncludeFormattedMessageandIncludeScopesoptions ensure log messages are human-readable and include scope context.
Custom spans and metrics
The DiagnosticConfig class centralizes all telemetry definitions:
public static class DiagnosticConfig
{
public const string ServiceName = "payment-service";
public const string ActivitySourceName = "PaymentService.Payments";
public const string MeterName = "PaymentService.Metrics";
public static readonly ActivitySource ActivitySource = new(ActivitySourceName);
public static readonly Meter Meter = new(MeterName);
public static readonly Counter<long> PaymentsProcessed = Meter.CreateCounter<long>(
"payments.processed",
description: "Number of payments processed");
public static readonly Histogram<double> FraudCheckDuration = Meter.CreateHistogram<double>(
"fraud_check.duration",
unit: "ms",
description: "Duration of fraud check processing");
}In .NET, OpenTelemetry builds on System.Diagnostics, so ActivitySource and Meter are the native primitives you use to create spans and metrics.
This is what it looks like in practice: the PaymentProcessor class creates child spans for each processing step:
public async Task<PaymentResult> ProcessPaymentAsync(PaymentRequest request)
{
var paymentId = Guid.NewGuid().ToString("N")[..12];
// Start Activity for trace and enrich it with tags
using var activity = DiagnosticConfig.ActivitySource.StartActivity("process-payment");
activity?.SetTag("payment.id", paymentId);
activity?.SetTag("payment.order_id", request.OrderId);
activity?.SetTag("payment.amount", request.Amount);
// Step 1: Fraud check (creates its own child span)
var fraudScore = await RunFraudCheckAsync(paymentId, request);
// Step 2: Determine outcome based on configured rates
var outcome = DetermineOutcome();
// Step 3: Process the charge (creates its own child span)
var result = await ProcessChargeAsync(paymentId, request, outcome, fraudScore);
// Persist to SQLite (auto-instrumented by EF Core)
await using var db = await _dbFactory.CreateDbContextAsync();
db.Payments.Add(result);
await db.SaveChangesAsync();
// Record metrics
DiagnosticConfig.PaymentsProcessed.Add(1,
new KeyValuePair<string, object?>("status", result.Status),
new KeyValuePair<string, object?>("payment_method", request.PaymentMethod));
return result;
}The fraud check span includes an event when the score is suspicious. All of these will show up in ClickStack's trace waterfall:
private async Task<int> RunFraudCheckAsync(string paymentId, PaymentRequest request)
{
using var activity = DiagnosticConfig.ActivitySource.StartActivity("fraud-check");
var sw = Stopwatch.StartNew();
// Simulate fraud check latency (10-50ms)
var delay = Random.Shared.Next(10, 51);
await Task.Delay(delay);
var fraudScore = Random.Shared.Next(0, 101);
activity?.SetTag("fraud.score", fraudScore);
activity?.SetTag("fraud.delay_ms", delay);
if (fraudScore > 70)
{
activity?.AddEvent(new ActivityEvent("suspicious-activity", tags: new ActivityTagsCollection
{
{ "fraud.score", fraudScore },
{ "payment.amount", request.Amount },
}));
}
sw.Stop();
DiagnosticConfig.FraudCheckDuration.Record(sw.Elapsed.TotalMilliseconds);
return fraudScore;
}Configurable failure modes
The Payment Service doesn't just approve everything; it simulates realistic failure modes so that we get a wide variety of logs and traces in the demo (the rates can be configured in PaymentConfiguration.cs).
The timeout case is particularly interesting for tracing: the Payment Service sleeps for 3-8 seconds, but the Order API has a 3-second HTTP client timeout. This creates a scenario where the Order API sees a TaskCanceledException while the Payment Service is still happily processing. Both sides of that will show up in our traces in ClickStack.
Distributed tracing across services
When the Order API calls the Payment Service, the trace context is automatically propagated via HTTP headers. This happens because AddHttpClientInstrumentation() injects traceparent headers into outgoing requests, and AddAspNetCoreInstrumentation() on the Payment Service side extracts them. No manual correlation needed.
The OrderService creates spans for each step of order processing, in the same way we did it above for the payment service. The resulting trace waterfall shows the complete journey: place-order → validate-order → call-payment-service → HTTP POST /payments → (Payment Service spans) → SaveChanges (EF Core/SQLite).
Database layer with SQLite and Entity Framework Core
Both services persist data to SQLite using Entity Framework Core.
Auto-instrumented database spans
The OpenTelemetry.Instrumentation.EntityFrameworkCore package hooks into EF Core's internal DiagnosticSource events. Every SaveChangesAsync(), FirstOrDefaultAsync(), and other EF Core operations automatically produce spans with the standard OTel database semantic conventions. Setting it up is a one-liner in our startup config:
.WithTracing(tracing => tracing
.AddAspNetCoreInstrumentation()
.AddHttpClientInstrumentation()
.AddEntityFrameworkCoreInstrumentation() // <-- instruments database calls
.AddSource(DiagnosticConfig.ActivitySourceName)
.AddOtlpExporter())Generating test traffic
The Order API includes a /generate-traffic endpoint that creates realistic load, and the seed-data container in Docker Compose calls this endpoint automatically on startup. To get more data in there, you can simply run:
curl -X POST http://localhost:5000/generate-trafficExploring telemetry in ClickStack
Once traffic is flowing, open ClickStack at http://localhost:8080.
Because the OTel pipeline sends all three signals to ClickStack, you get capabilities that aren't possible with logs alone: auto-discovered service maps, distributed trace waterfalls, correlated log-to-trace views, and database operation breakdowns. The ClickStack UI provides an easy way to explore this data: you can search through all types of signals, filter, and use log clustering to group similar patterns and accelerate root cause analysis. ClickStack also supports full-text search via ClickHouse's lightning-fast inverted indexes, and recent releases have added text index support directly in the ClickStack UI.
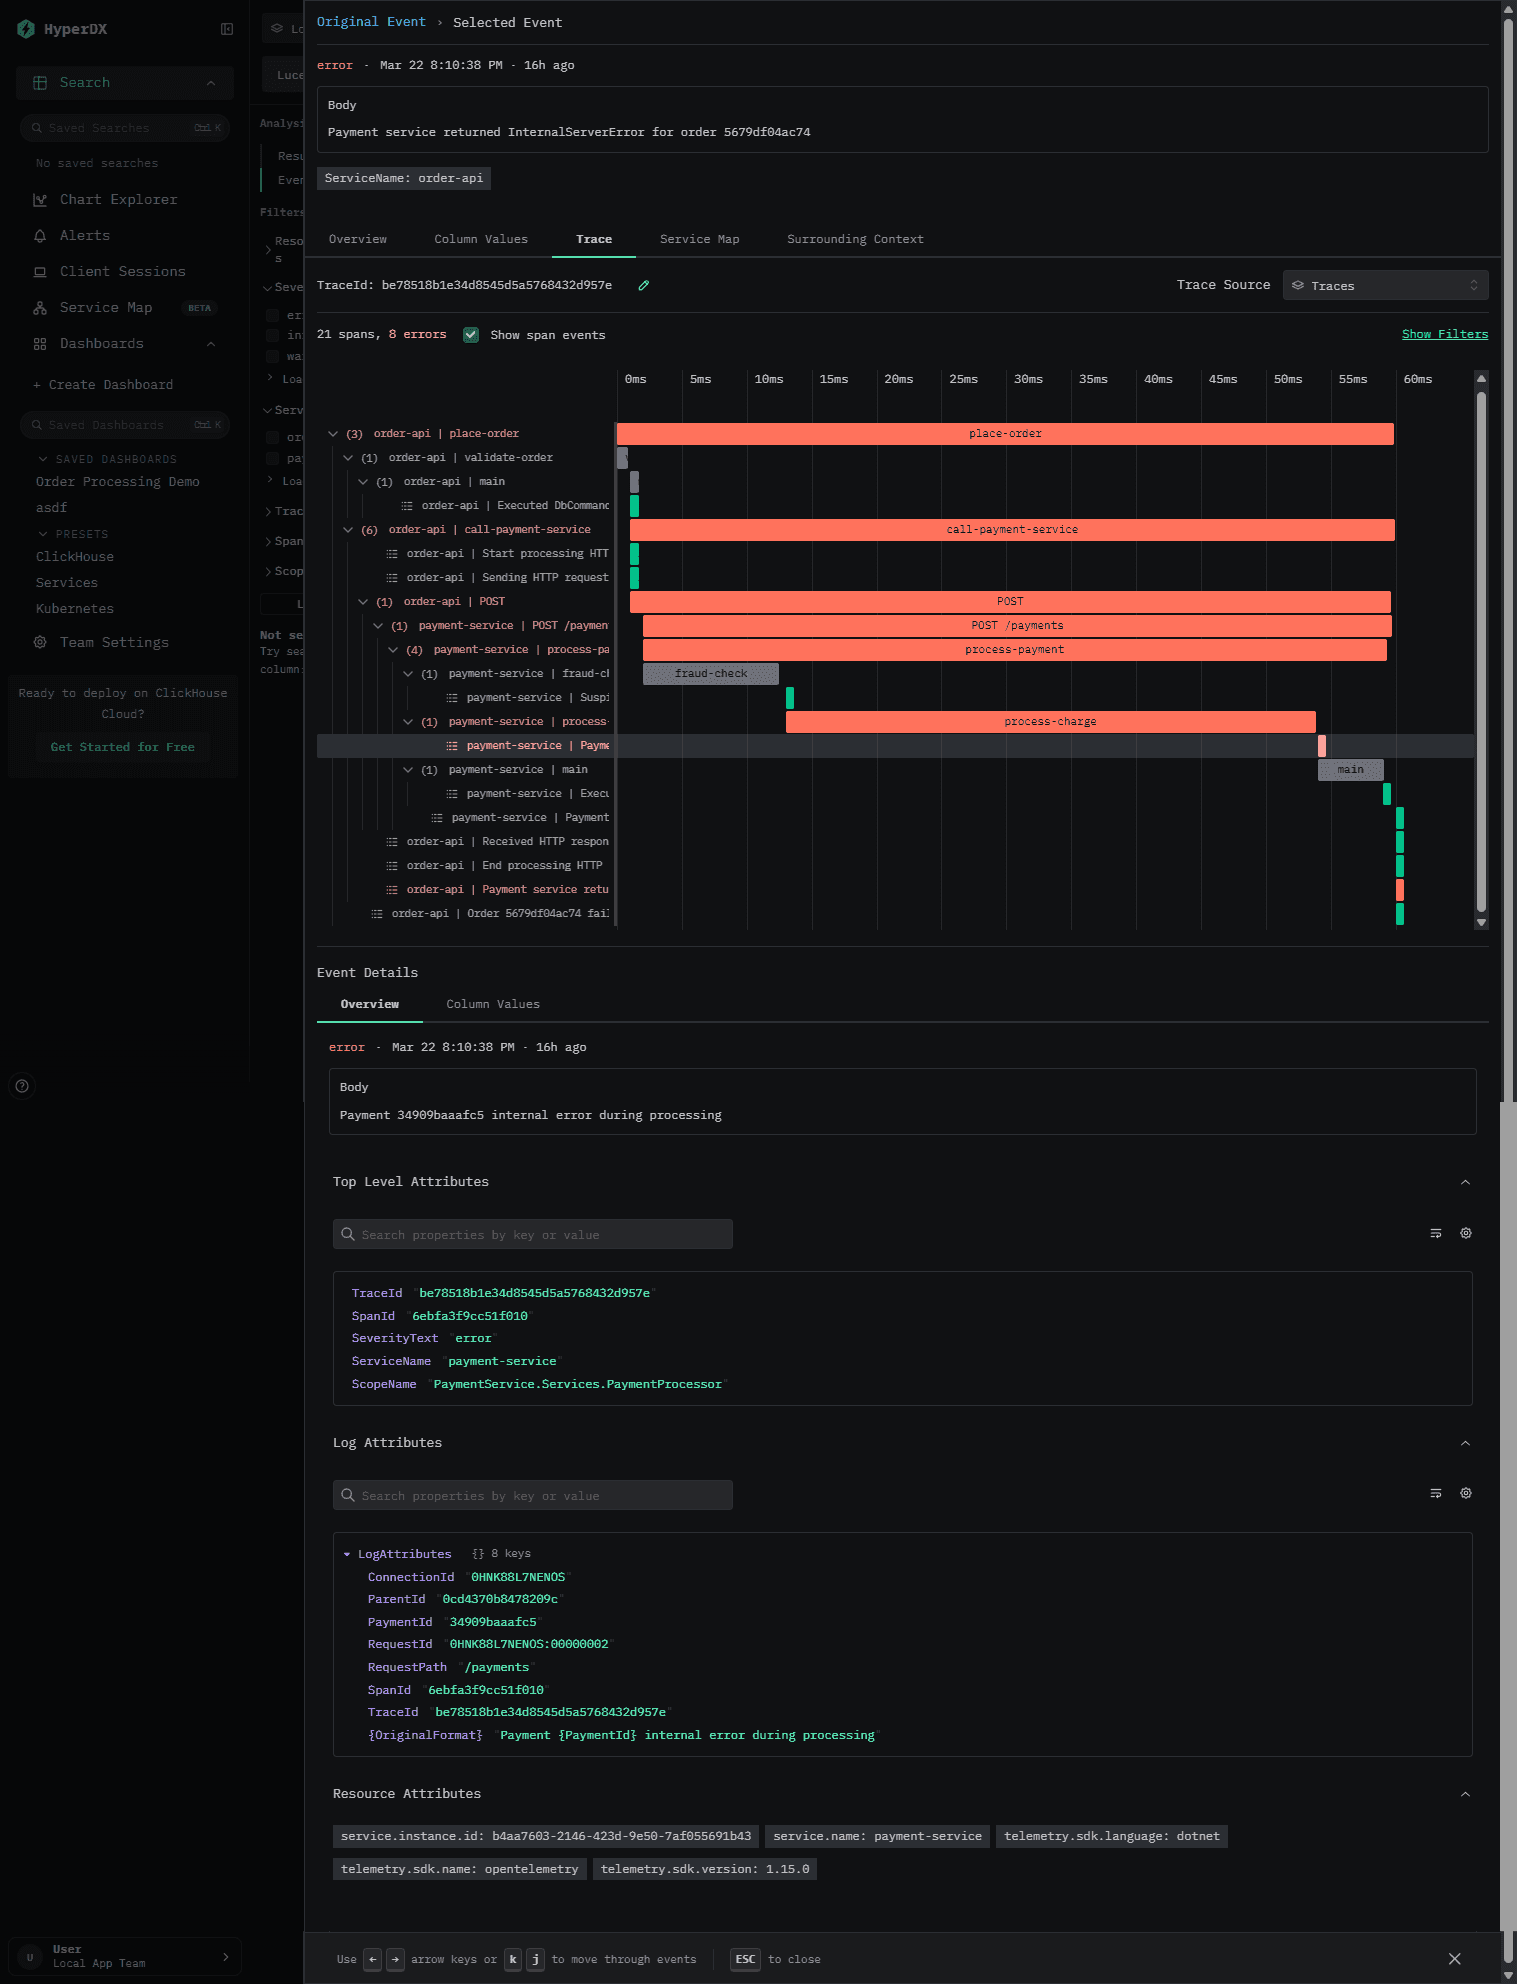
Distributed traces and logs
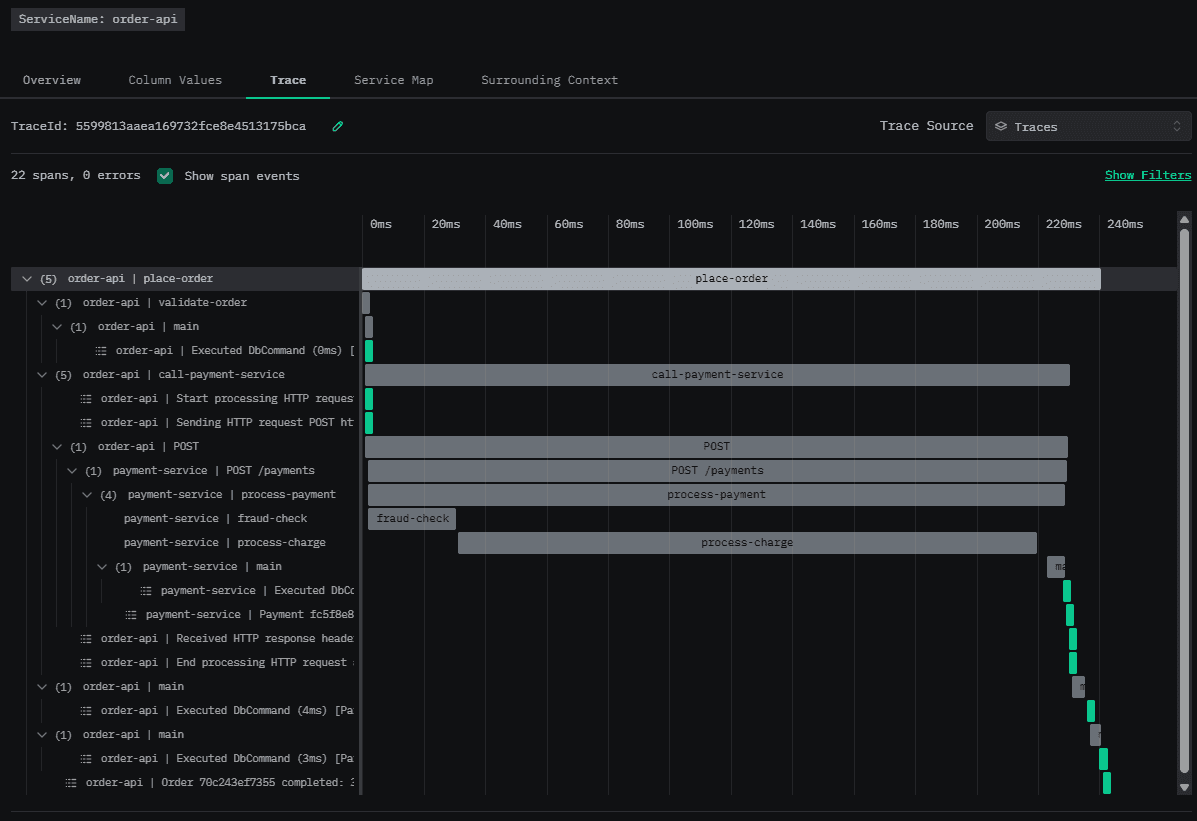
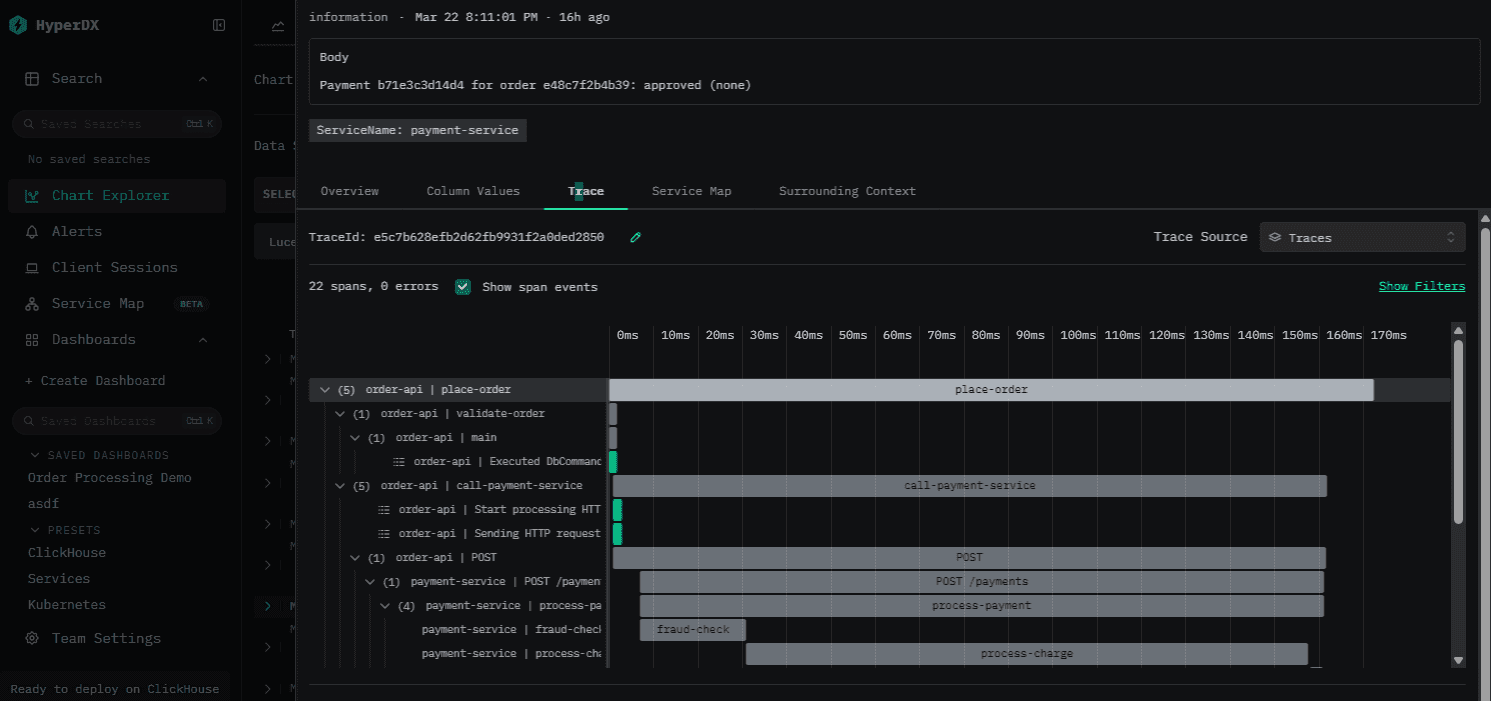
A successful order trace shows the full waterfall:
place-order(Order API)validate-order(Order API)call-payment-service(Order API)HTTP POST /payments(auto-instrumented byHttpClientInstrumentation)process-payment(Payment Service)fraud-check(Payment Service)process-charge(Payment Service)- EF Core
SaveChangesspans on both sides (auto-instrumented)
You can drill down into any span or log in the waterfall to see all of their properties.
Tracking down errors
Event patterns in ClickStack allow you to quickly identify patterns in your errors by automatically clustering similar messages together. Then you only need to review a small number of groups instead of going through millions of messages.
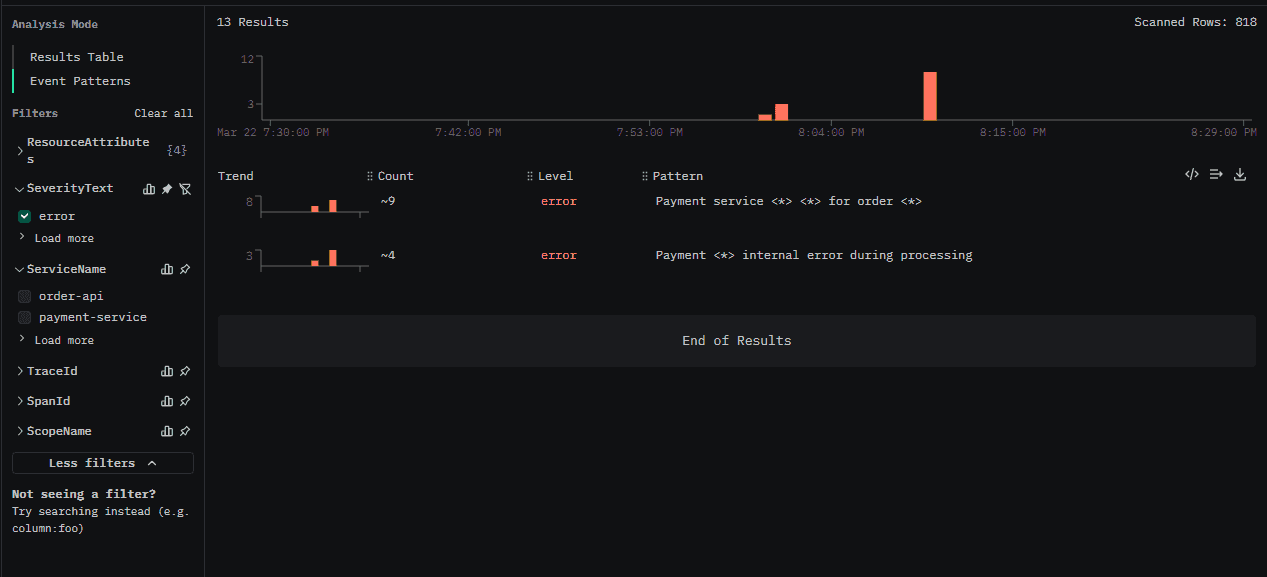
Click through to a group to see individual messages:
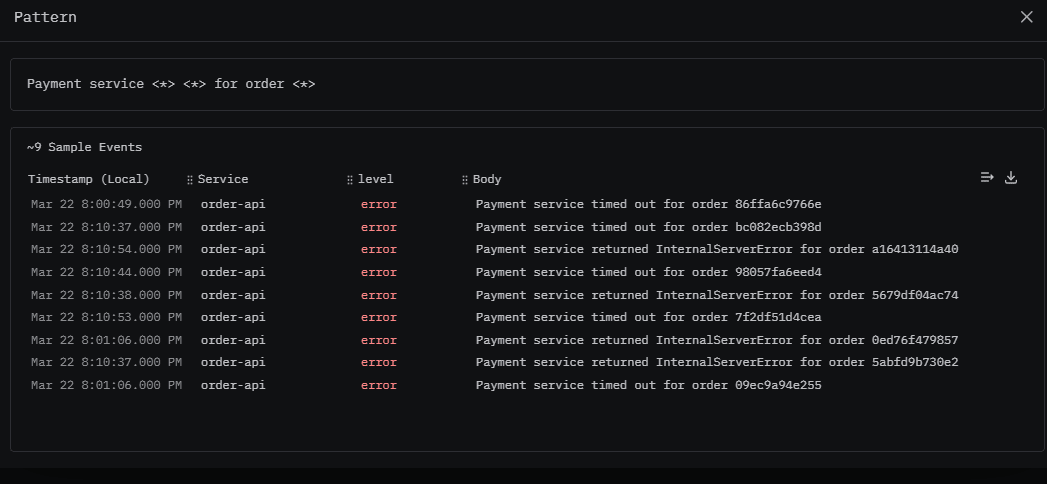
Then click on any of those to see the message properties, the trace waterfall, log context, as well as a map of the relevant services.
Log-to-Trace Correlation
Every log line emitted during a traced request automatically carries the trace ID and span ID. In ClickStack, you can click any log line and jump directly to the parent trace, no manual correlation needed. The OTel log exporter handles this automatically.
That also works the other way around: when you're viewing a trace, ClickStack automatically surfaces the logs that were emitted during that trace's execution. And since our db calls are instrumented, that means we also get every database operation in the waterfall as well. This means you don't have to manually search for logs matching a trace ID; they're right there in context. This automatic correlation is one of the biggest advantages of the OTel + ClickStack pipeline — you get the full picture without any manual plumbing.
Metrics
You can build custom dashboards based on your metrics in ClickStack. The demo comes pre-loaded with a dashboard allowing us to monitor our order processing service and providing easy access to warning and error logs.
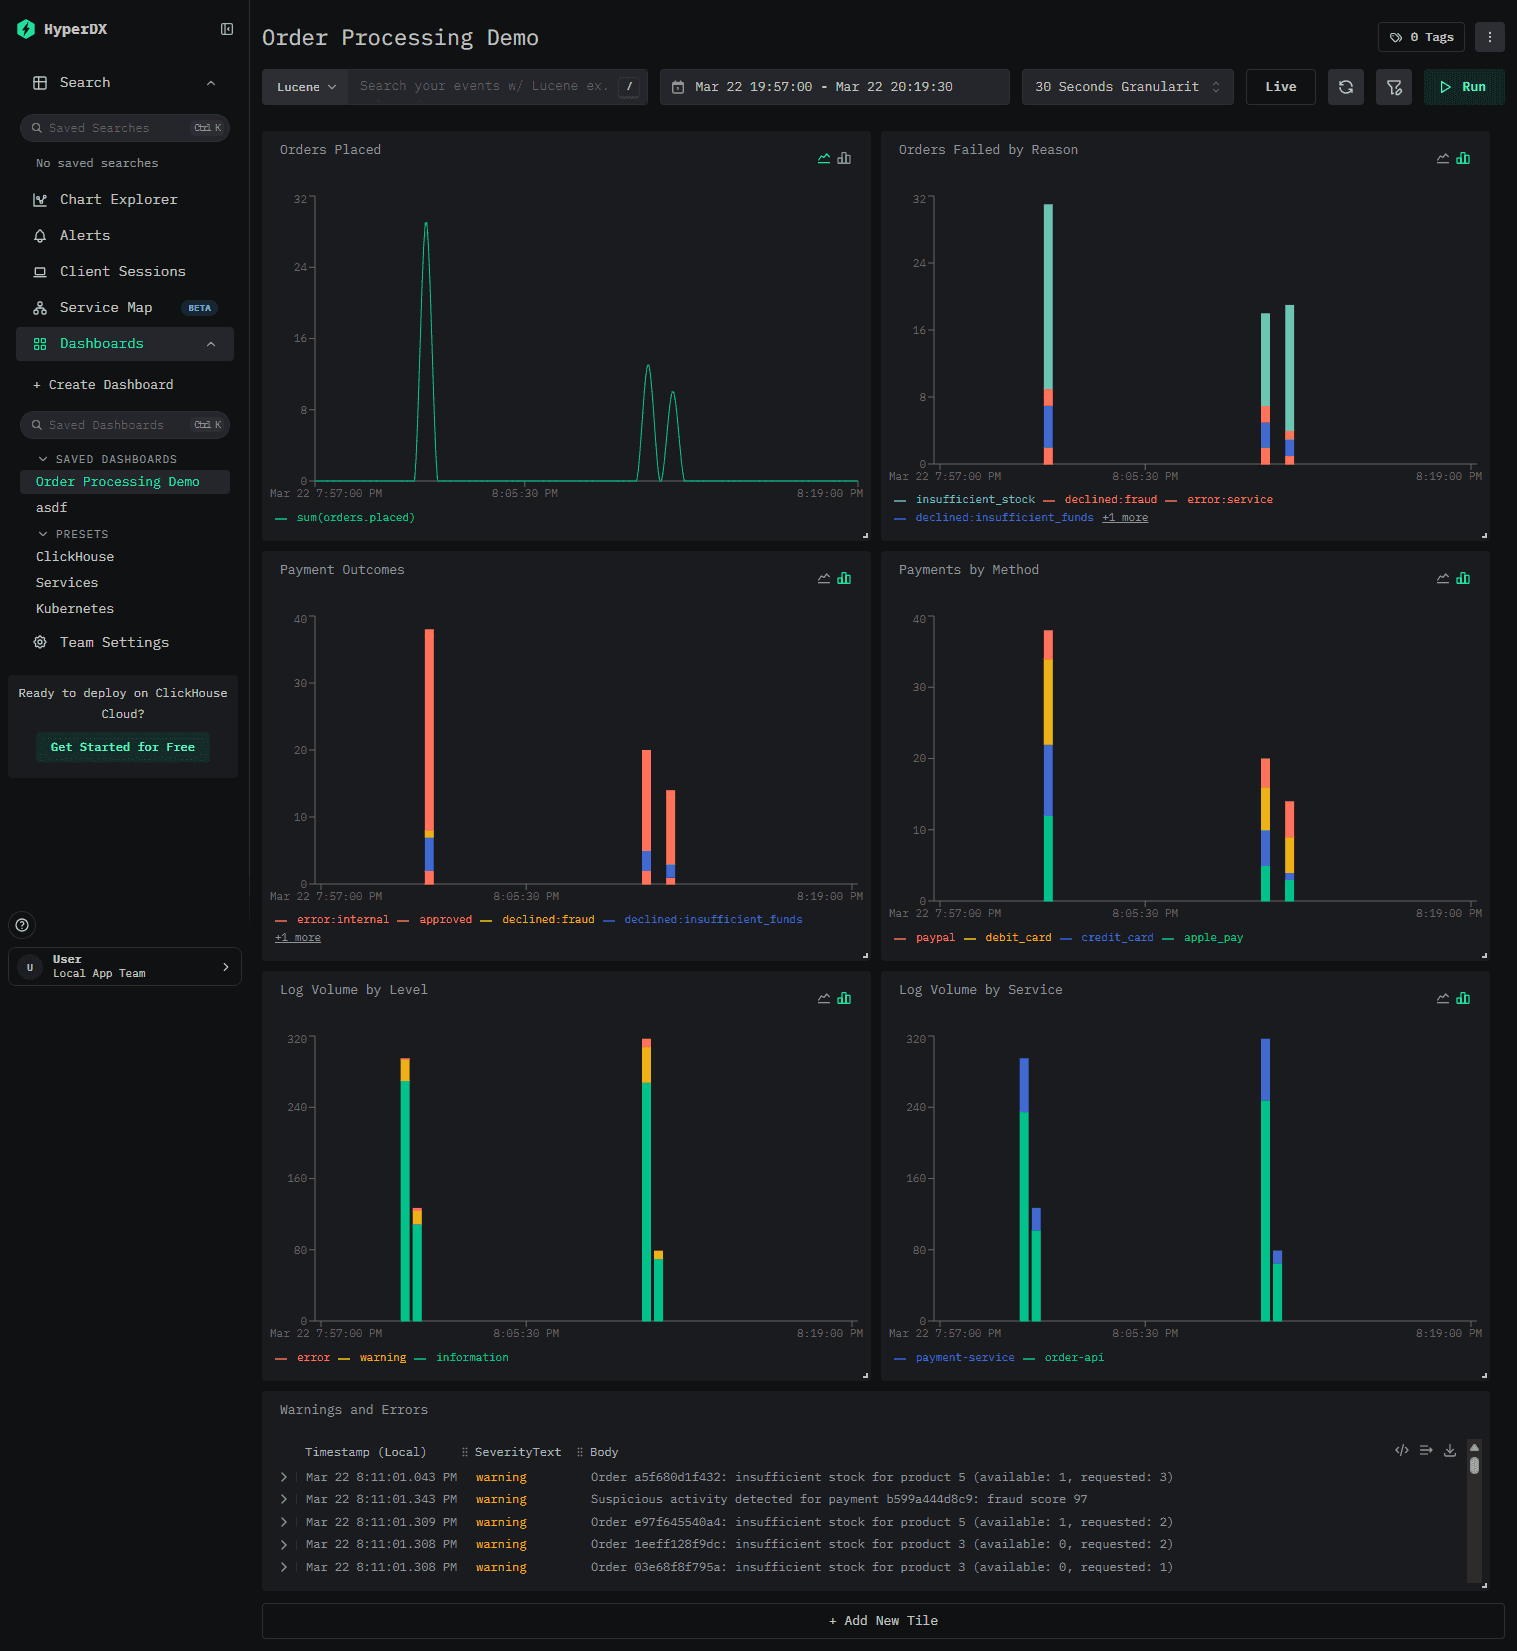
You can also define alerts based on these metrics. ClickStack supports alerting integrations with Slack, PagerDuty, or by generic webhook.
Built-in dashboards
ClickStack also comes with a number of dashboards out of the box. These allow you to monitor ClickHouse, surface the most relevant metrics for your services (auto-discovered) and database calls, and let you explore Kubernetes events.
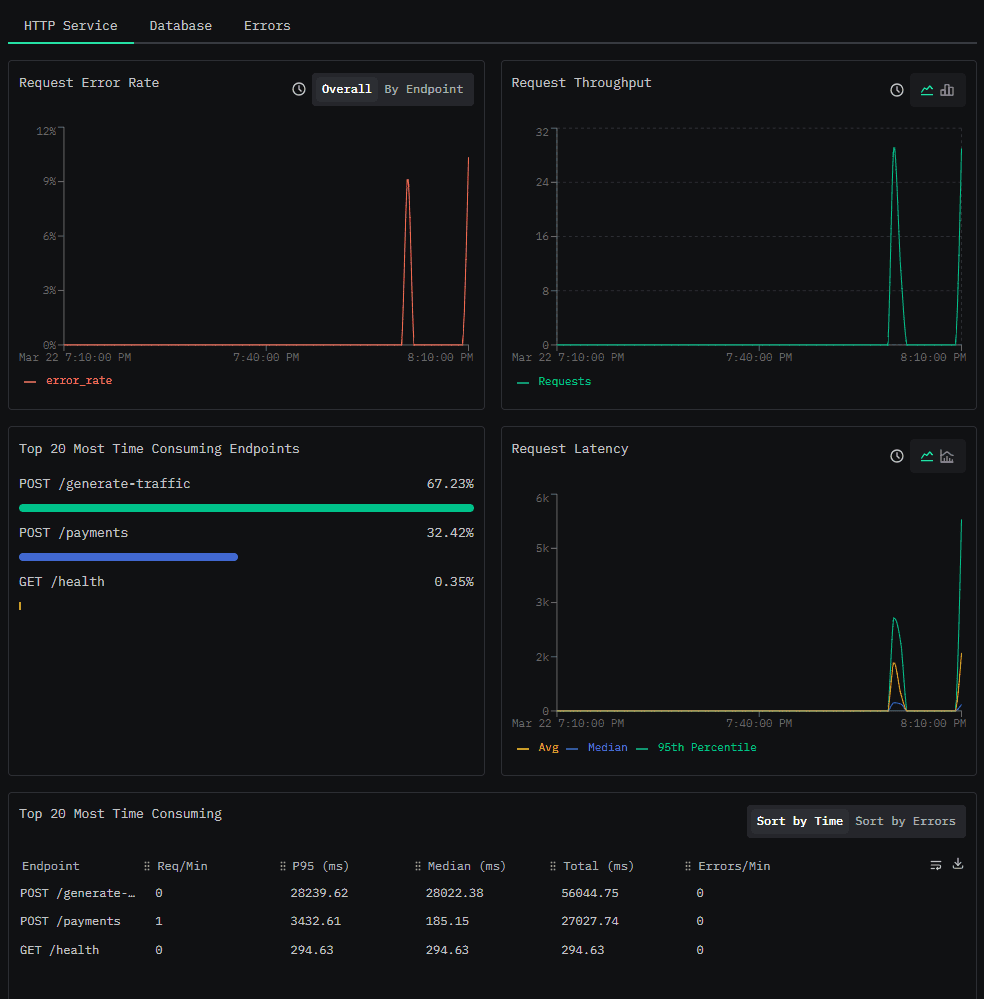
The service dashboard highlights your top endpoints, latency, and errors. The data here can be filtered using SQL or Lucene. The service map also automatically discovers the relationship between order-api and payment-service from the distributed traces. No manual configuration needed.
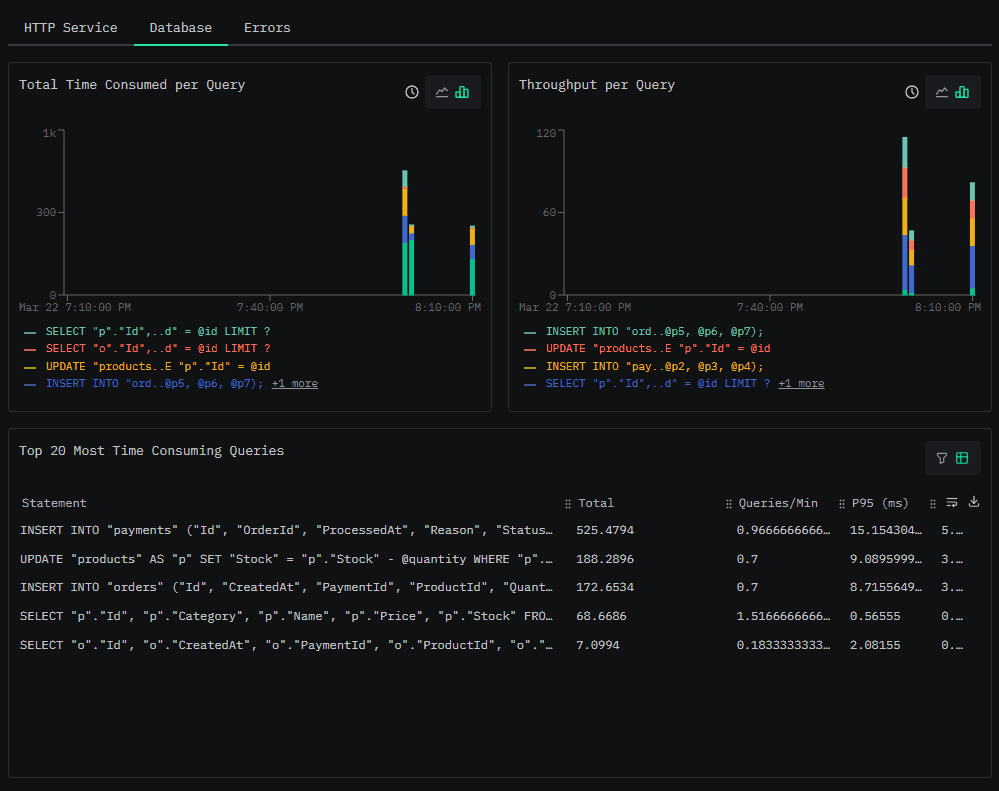
Finally, the database tab shows stats for the database operations in our services. Because we're using the EF Core auto-instrumentation, every query and save operation is captured with standard db.* attributes. You can see operation latencies, throughput, and error rates at a glance.
Production considerations
This demo prioritizes simplicity and clarity. For a comprehensive guide to optimizing ClickStack for large-scale production workloads, see the ClickStack Performance Tuning documentation. A few things you'd want to add:
- Resource attributes: Add
deployment.environment,service.version, andservice.instance.idto help filter data in production. In Kubernetes, the OTel Operator or theOTEL_RESOURCE_ATTRIBUTESenv var can automatically injectk8s.namespace.name,k8s.pod.name,k8s.deployment.name, and other cluster metadata. ClickStack's default table schema already materializes these Kubernetes attributes into dedicated columns for fast filtering; you just need to make sure they're present in your OTel resource. - Batch exporter tuning: The default batch exporter settings (512 batch size, 5s export interval) are reasonable, but you may want to tune them based on your throughput.
- Security: Enable TLS for the OTLP endpoint and add authentication headers. ClickStack supports API keys for OTLP ingestion.
- Materialized views: As data volumes grow, ClickStack can automatically exploit incremental materialized views to accelerate dashboards and alerts. You define a view that pre-aggregates data at insert time (e.g. average request duration per service per minute) and ClickStack transparently uses it for any matching visualization. No dashboard changes required.
- Alerting: Set up alerts on saved searches (e.g., error rate spikes) or dashboard charts (e.g., p99 latency crossing a threshold). ClickStack evaluates them on a recurring interval and notifies via Slack, PagerDuty, or a generic webhook.
Conclusion
With a small amount of OpenTelemetry setup in ASP.NET, we went from a single timeout log line to a complete, cross-service view of what actually happened, spanning HTTP calls, application code, and database operations. Instead of guessing which service failed or stitching together logs, we can follow a request end-to-end: see where time was spent, where errors occurred, what logs were emitted, and which database calls were involved.
ClickStack makes this straightforward by accepting standard OpenTelemetry data, correlating all signals automatically, and storing everything in ClickHouse. You get a fast, flexible backend with a UI for exploration, and SQL access when you need to go deeper.
Clone the demo, run docker compose up -d, and try it yourself. Trigger a few failures, open a trace, and follow the request.
Resources
Get started today
Interested in seeing how ClickHouse works on your data? Get started with ClickHouse Cloud in minutes and receive $300 in free credits.
Sign up


