At trip.com, we provide our users with a wide range of digital offerings, including hotel and air ticket reservations, attractions, tour packages, business travel management, and travel-related content. As you probably guessed, our need for a scalable, robust, and fast logging platform is key to the well-being of our operations.
Before we start, and to tease your curiosity a little, let me show you a few numbers highlighting the platform we built on top of ClickHouse:

This blog article will explain the story of our logging platform, why we initially built it, the technology we used, and finally, our plan for its future on top of ClickHouse leveraging some of the features like SharedMergeTree.
Here are the different topics we are going to talk about from our journey:
- How we built a centralized Logging Platform
- How we scaled up the logging platform and migrated from Elasticsearch to ClickHouse
- How we improved our operations experience
- How we tested ClickHouse Cloud in Alicloud
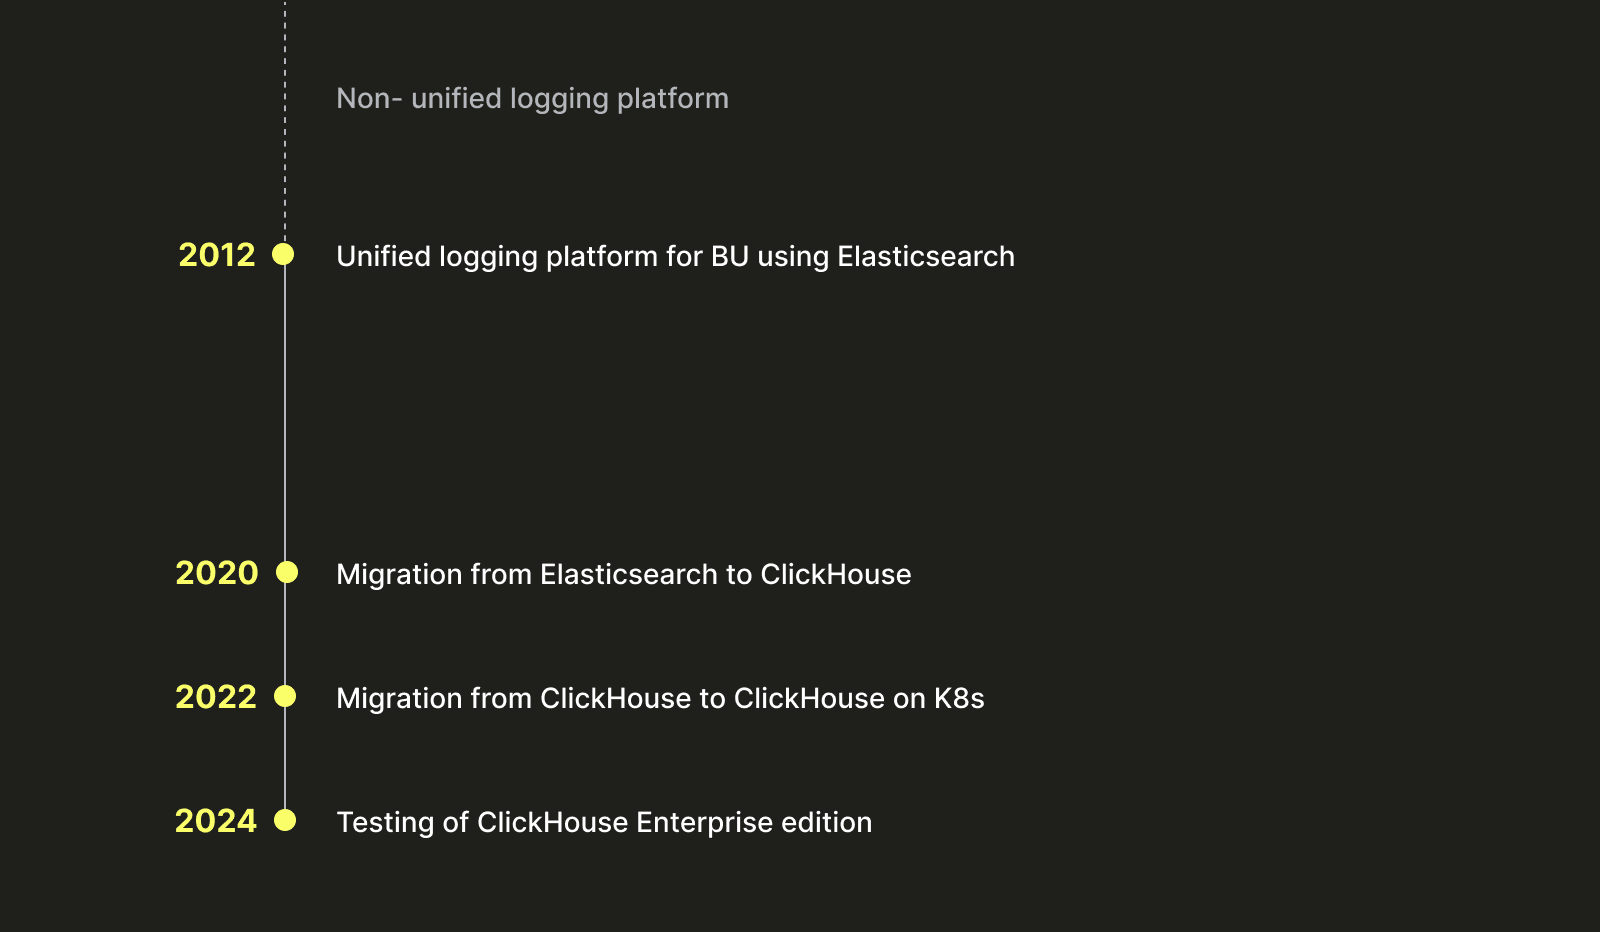
To simplify it, let’s put it on a timeline:
Building a centralized logging platform #
Every great story starts with a great problem, and in our case, this project started because, before 2012, trip.com did not have any unified or centralized logging platform. With each team and business unit (BU) collecting and managing their own logs, this presented many different challenges:
- A lot of manpower was required to develop, maintain, and operate all these environments, and this inevitably led to a lot of duplicated effort.
- Data governance and control became complicated.
- No unified standard across the company
With that set, we knew we needed to build a centralized and unified logging platform.
In 2012, we launched our first platform. It was built on top of Elasticsearch and started to define standards for ETL, storage, log access, and querying.
Even though we no longer use Elasticsearch for our logging platform, it’s probably worth exploring how we implemented our solution. It drove much of our subsequent work, which we had to consider when we later migrated to ClickHouse.
Storage #
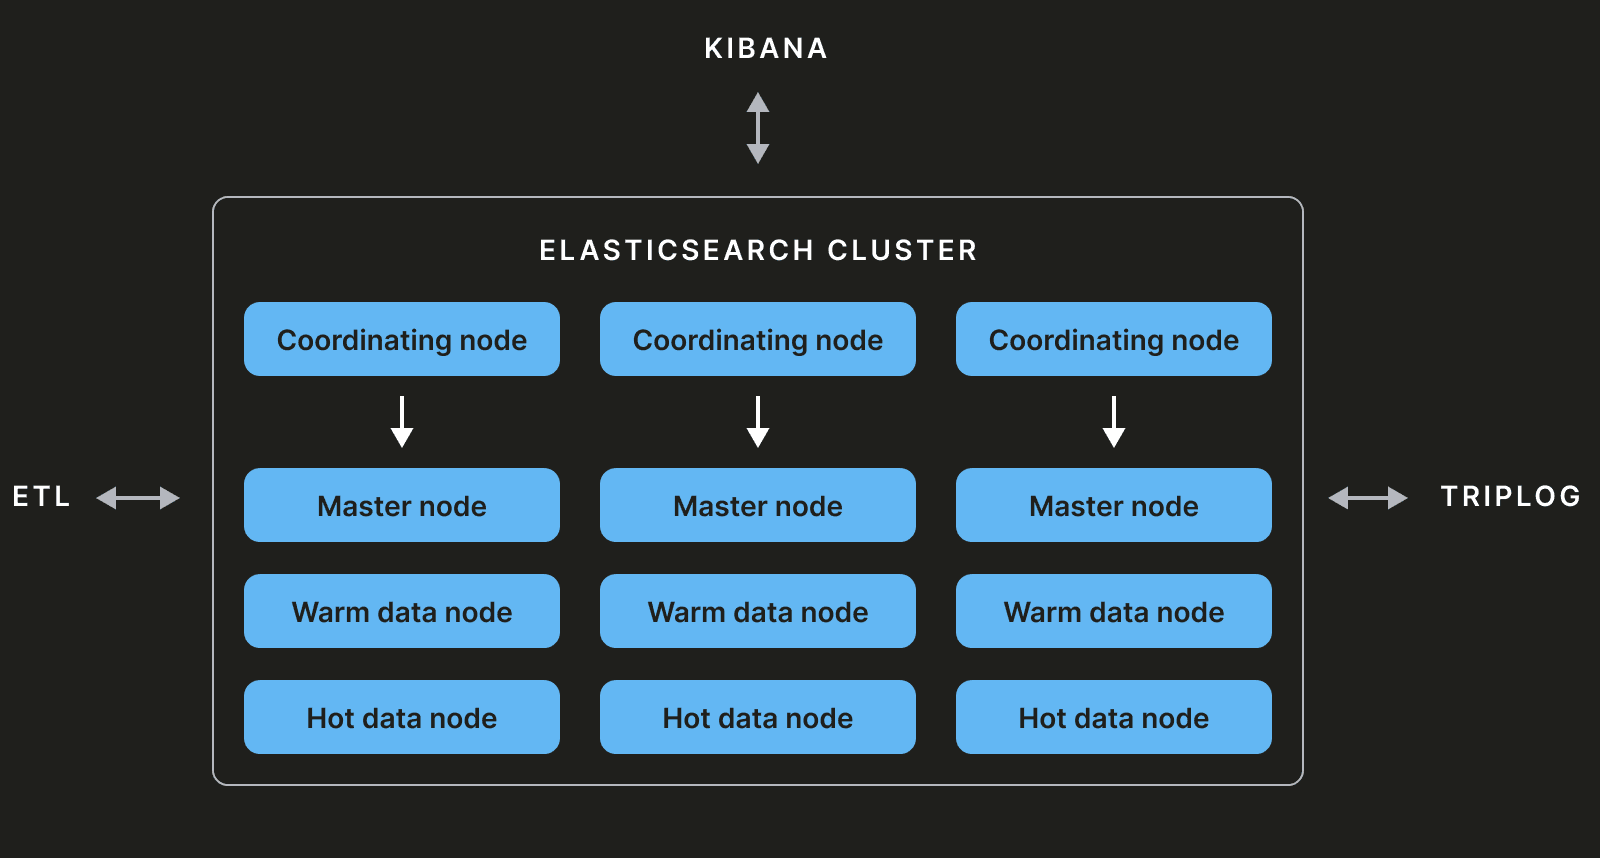
Our Elasticsearch cluster mainly comprises master nodes, coordinator nodes, and data nodes.
Master nodes #
Every Elasticsearch cluster is composed of at least three master-eligible nodes. Out of these, one will be elected master with the responsibility to maintain the cluster state. The cluster state is metadata containing information about the various indexes, shards, replicas, etc. Any operations modifying the cluster state will be executed by the master node.
Data nodes #
Data nodes store the data and will be used to perform CRUD operations. These can be divided into multiple layers: hot, warm, etc.
Coordinator nodes #
This type of node does not have any other functions (master, data, ingest, transform, etc.) and acts as a smart load-balancer by considering the cluster state. If the coordinator is receiving a query with a CRUD operation it will be sent to the data nodes. Alternatively, if they receive a query to add or remove an index it will be sent to the master node.
Visualization #
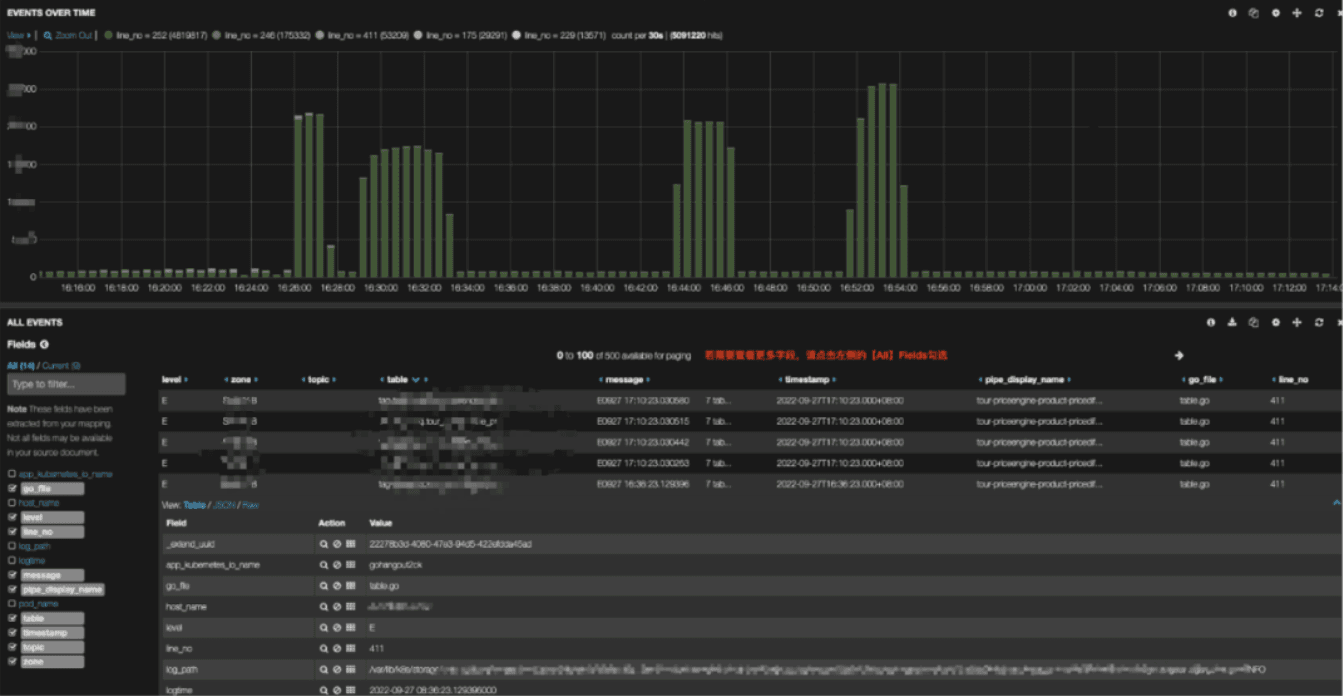
On top of Elasticsearch we used Kibana as the visualization layer. You can see an example of a visualization below:
Data insertion #
Our users have two options for sending a log to the platform: via Kafka and via the agent.
Via Kafka #
The first method involves using the company's framework, TripLog, to ingest data into the Kafka message broker (using Hermes).
private static final Logger log = LoggerFactory.getLogger(Demo.class);

public void demo (){
  TagMarker marker = TagMarkerBuilder.newBuilder().scenario("demo").addTag("tagA", "valueA").addTag("tagA", "valueA").build();
  log.info(marker, "Hello World!");
}
This gives our users a framework to ship logs to our platform easily.
Via agent #
The other approach is to use an agent such as Filebeat, Logstash, Logagent, or a custom client that will write directly to Kafka. You can see an example of a Filebeat configuration below:
filebeat.config.inputs:
  enabled: true
  path: "/path/to/your/filebeat/config"
filebeat.inputs:
  - type: log
    enabled: true
    paths:
      - /var/log/history.log
      - /var/log/auth.log
      - /var/log/secure
      - /var/log/messages
    harvester_buffer_size: 102400
    max_bytes: 100000
    tail_files: true
    fields:
      type: os
    ignore_older: 30m
    close_inactive: 2m
    close_timeout: 40m
    close_removed: true
    clean_removed: true
output.kafka:
  hosts: ["kafka_broker1", "kafka_broker2"]
  topic: "logs-%{[fields.type]}"
  required_acks: 0
  compression: none
  max_message_bytes: 1000000
processors:
  - rename:
      when:
        equals:
          source: "message"
          target: "log_message"
ETL #
Regardless of the approach selected by the user, the data ends in Kafka, where it can be pipelined to Elasticsearch using gohangout.
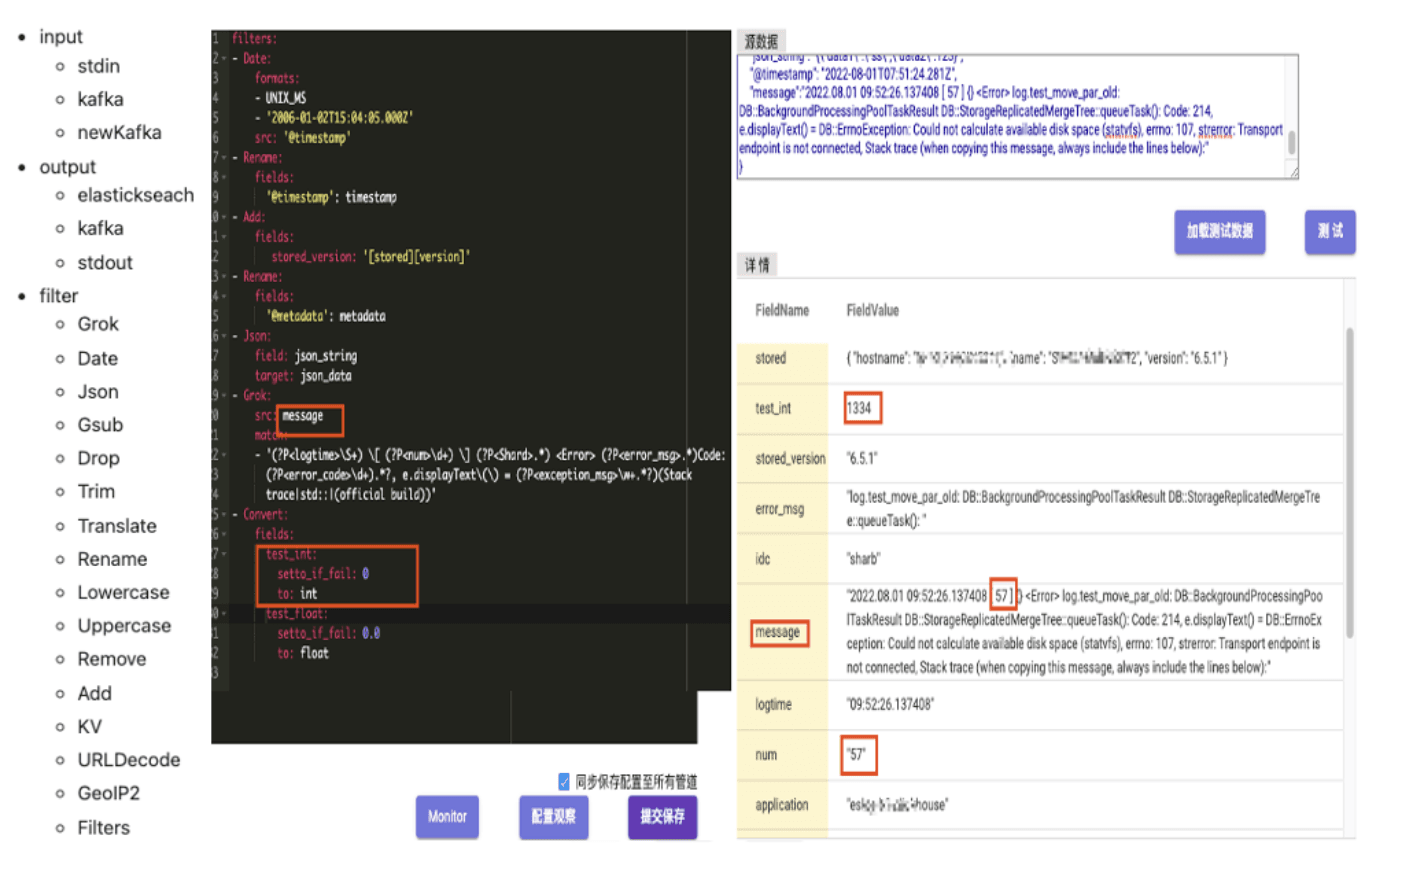
Gohangout is an open-source application developed and maintained by trip.com as an alternative to Logstash. It is designed to consume data from Kafka, perform ETL operations, and ultimately output data to various storage mediums such as ClickHouse and Elasticsearch. The data processing in the Filter module includes common functions for data cleaning, such as JSON processing, Grok pattern matching, and time conversion (as shown below). In the example below, GoHangout extracts the num data from the Message field using regular expression matching and stores it as a separate field.
Reaching a glass ceiling #
Many people use Elasticsearch for Observability, but this choice reveals a key architectural challenge for modern infrastructure monitoring tools. While it shines for smaller volumes of data, it has well-known challenges when deployed at our scale. They offer easy-to-use software, a schema-less experience, a wide range of features, and a popular UI with Kibana. However, its search-oriented architecture creates significant cost and performance challenges at scale, a core issue detailed in our observability cost optimization playbook.
When we were storing 4PB of data in Elasticsearch, we started facing multiple issues around cluster stability:
- The high load on the cluster resulted in many request rejections, write delays, and slow queries
- Daily migration of 200 TB of data from the hot nodes to the cold nodes led to significant performance degradation
- Shard allocation was a challenge and resulted in some nodes being overwhelmed
- Large queries led to out-of-memory (OOM) exceptions.
Around the cluster performance:
- Query speed was affected by the overall cluster state
- We had difficulties increasing our insert throughput because of high CPU usage during ingestion
And finally, around cost:
- The volume of data, data structure, and lack of compression led to a high volume of storage required
- The weak compression rate had business implications and forced us to have a smaller retention period
- The JVM and memory limitation that Elasticsearch led to higher TCO (total cost of ownership)
So, after realizing all of the above, we searched for alternatives, and here comes ClickHouse!
ClickHouse vs Elasticsearch #
There are some fundamental differences between Elasticsearch and ClickHouse; let's go through them.
Query DSL vs SQL #
Elasticsearch relies on a specific query language called Query DSL (Domain Specific Language). Even though there are now more options this remains the main syntax. ClickHouse on the other side relies on SQL, which is extremely mainstream and very user-friendly and compatible with many different integrations and BI tools.
Internals #
Elasticsearch and ClickHouse have some similarities in internal behavior, with Elasticsearch generating segments and ClickHouse writing parts. While both are merged asynchronously over time, creating larger parts and segments, ClickHouse differentiates itself with a columnar model where the data is sorted via an ORDER BY key. This allows for the construction of a sparse index for fast filtering and efficient storage usage due to high compression rates. You can read more about this index mechanism in this excellent guide.
Index vs table #
Data in Elasticsearch is stored in indices and broken down into shards. These need to remain in a relatively small size range (at our time, recommendations were to have shards of around 50GB). In contrast, ClickHouse data is stored in tables that can be significantly larger (in the TB range and larger when you're not limited by disk size). On top of this, ClickHouse allows you to create partition keys, which physically separate the data into a different folder. These partitions can then be efficiently manipulated if needed.
Overall we were impressed with ClickHouse features and characteristics: its columnar storage, vectorized query execution, high compression rates and high insertion throughput. These met the demands of our logging solution for performance, stability and cost-effectiveness. We, therefore, decided to use ClickHouse to replace our storage and query layer.
The next challenge was how to seamlessly migrate from one storage to the other without interruption of services.
Logs 2.0: Migrating to ClickHouse #
On deciding that we wanted to migrate to Clickhouse, we identified several different tasks that needed to be done:

Table design #
This is the initial table design that we ended up with (keep in mind that it was a few years ago, and we did not have all the data types that are present in ClickHouse today e.g. maps):
CREATE TABLE log.example
(
  `timestamp` DateTime64(9) CODEC(ZSTD(1)),
  `_log_increment_id` Int64 CODEC(ZSTD(1)),
  `host_ip` LowCardinality(String) CODEC(ZSTD(1)),
  `host_name` LowCardinality(String) CODEC(ZSTD(1)),
  `log_level` LowCardinality(String) CODEC(ZSTD(1)),
  `message` String CODEC(ZSTD(1)),
  `message_prefix` String MATERIALIZED substring(message, 1, 128) CODEC(ZSTD(1)),
  `_tag_keys` Array(LowCardinality(String)) CODEC(ZSTD(1)),
  `_tag_vals` Array(String) CODEC(ZSTD(1)),
  `log_type` LowCardinality(String) CODEC(ZSTD(1)),
   ...
   INDEX idx_message_prefix message_prefix TYPE tokenbf_v1(8192, 2, 0) GRANULARITY 16,
   ...
)
ENGINE = ReplicatedMergeTree('/clickhouse/tables/{shard}/example', '{replica}')
PARTITION BY toYYYYMMDD(timestamp)
ORDER BY (log_level, timestamp, host_ip, host_name)
TTL toDateTime(timestamp) + toIntervalHour(168)
- We use a dual-list approach to store dynamically changing tags (we intend to use maps in the future) i.e. we have two arrays storing keys and values separately.
- Partitioning by day for easy data manipulation, For our data volume, it makes sense to have daily partitioning, but most of the time a higher granularity like monthly or weekly is better.
- Depending on the filter you are going to have in your query, you might want to have an
ORDER BYkey that is different from the table above. The above key is optimized for queries usinglog_levelandtime. For example, if your query is not leveraging thelog_level, it makes sense to only have thetimecolumn in the key. - Tokenbf_v1 Bloom filter for optimizing term queries and fuzzy queries.
- A
_log_increment_idcolumn contains a globally unique incremental ID to enable efficient scrolling pagination and precise data positioning. - ZSTD data compression method, saving over 40% of storage costs.
Cluster setup #
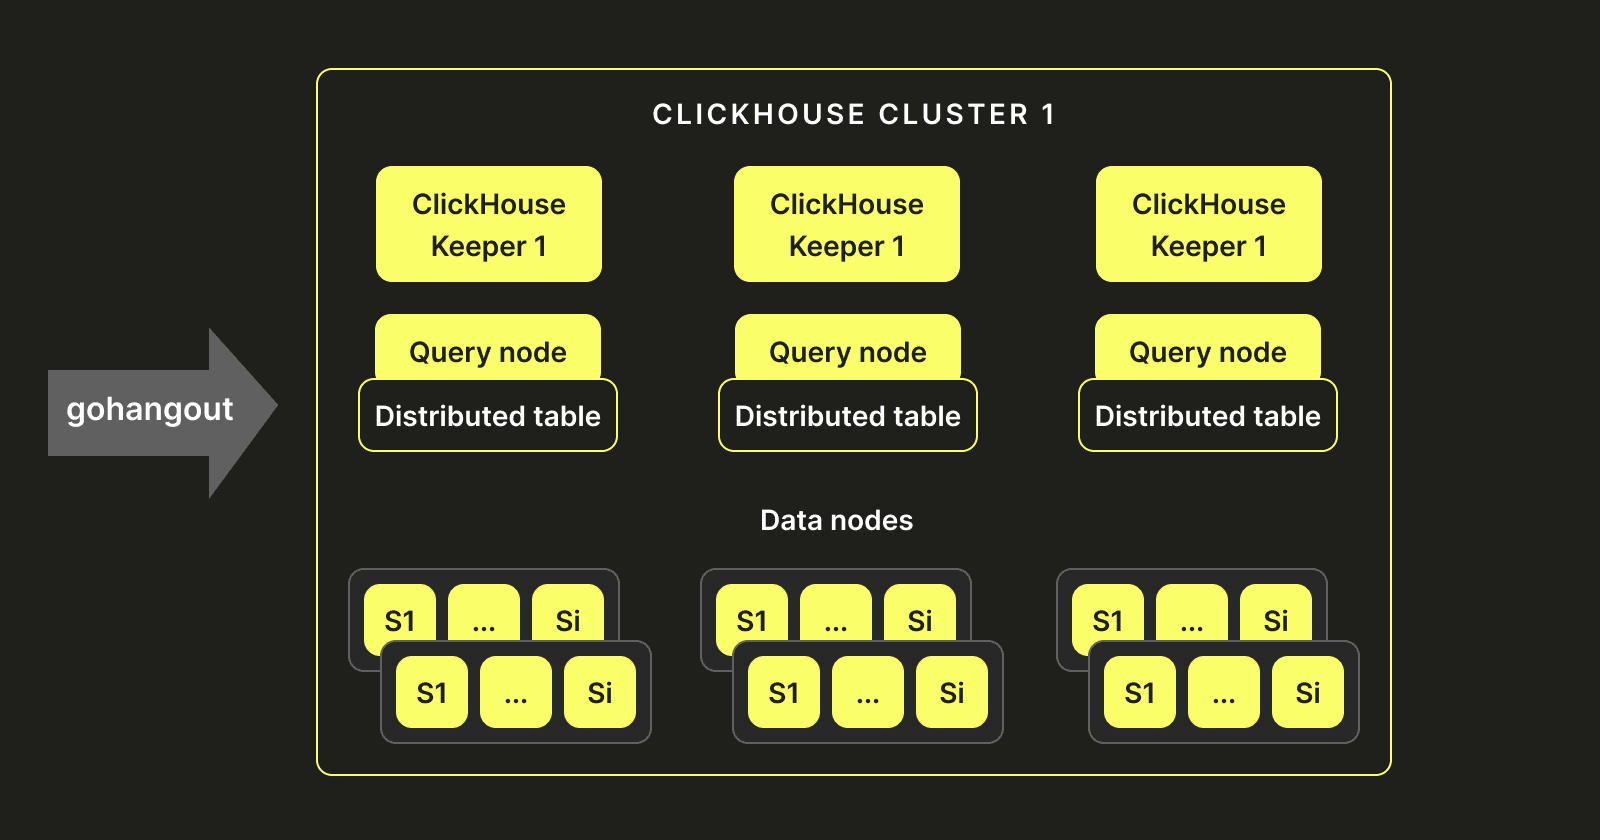
Given our historical setup and experience with Elasticsearch, we decided to replicate a similar architecture. Our ClickHouse-Keeper instances act as master nodes (similar to Elasticsearch). Multiple query nodes are deployed, which don’t store data but hold distributed tables pointing to ClickHouse servers. These servers host data nodes that store and write the data. The following shows what our architecture ended up looking like:
Data visualizations #
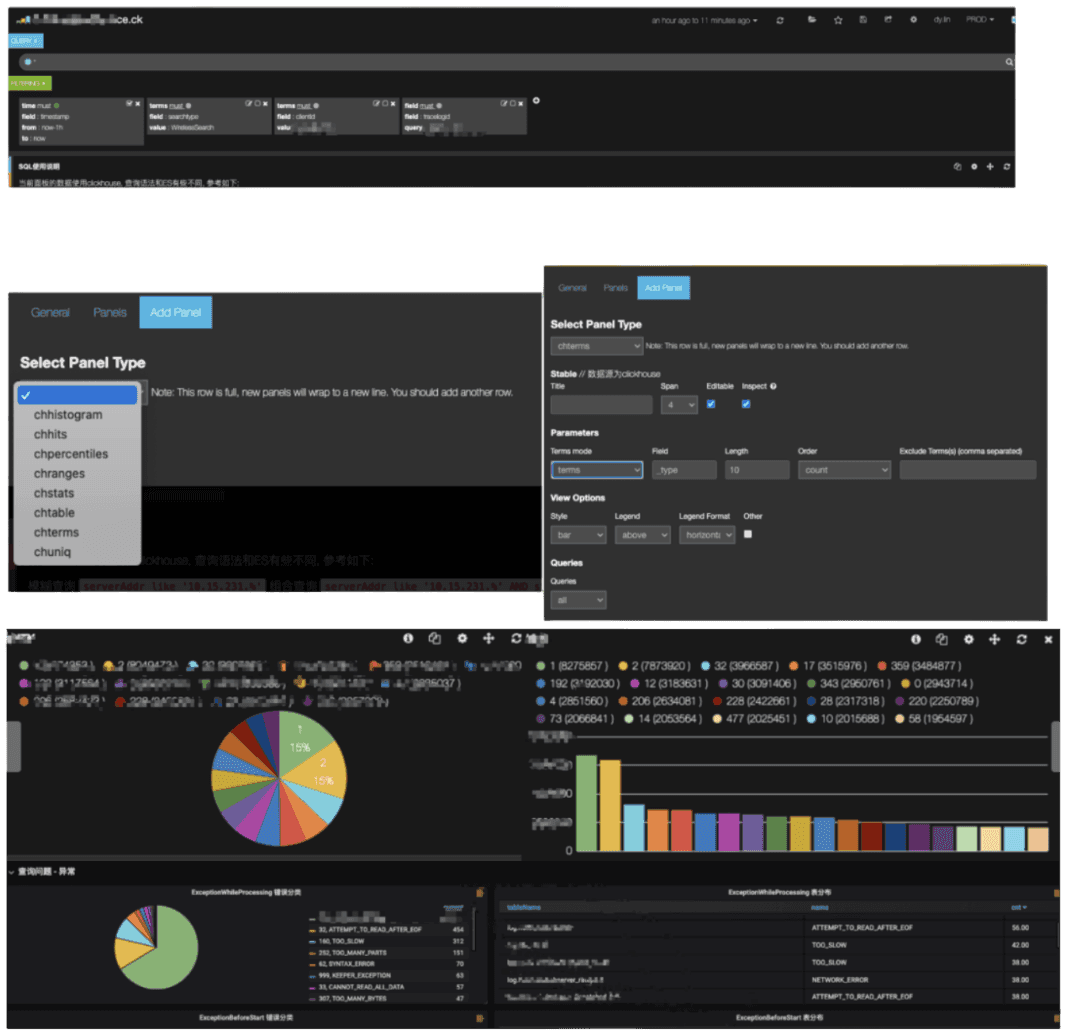
We wanted to offer our users a seamless experience after migrating to ClickHouse. In order to do this, we needed to make sure that all of their visualizations and dashboards could use ClickHouse. This presented a challenge as Kibana is a tool that was originally developed on top of Elasticsearch and does not support additional storage engines. We, therefore, had to customize it to make sure it could interface with ClickHouse. This required us to create new data panels in Kibana that could be used with ClickHouse: chhistogram, chhits, chpercentiles, chranges, chstats, chtable, chterms, and chuniq.
We then created scripts that migrated 95% of the existing Kibana dashboards to use Clickhouse. Finally, we enhanced Kibana so that users could write SQL queries.
Triplog #
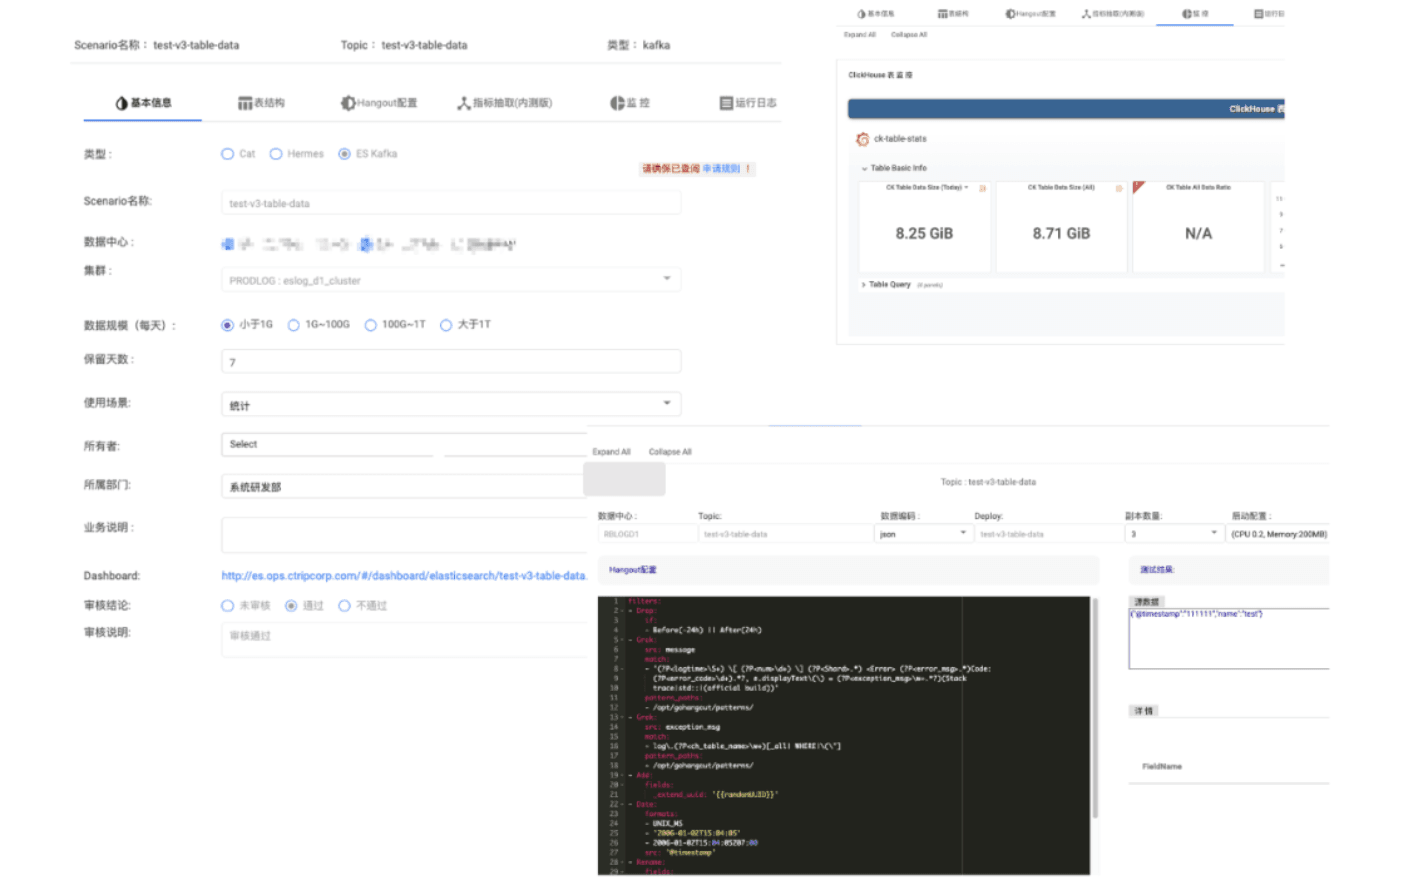
Our logging pipeline is self-service, allowing users to send logs. These users need to be able to create indexes and define ownership, permissions, and TTL policies. We, therefore, created a platform called Triplog that provides an interface for our users to manage their tables, users, and roles, monitor their data flows, and create alerts.
A retrospective #
Now that everything has been migrated, it's time to see our platform's new performance! Even though we automated 95% of our migration and achieved a seamless transition, it's important to go back to our success metrics and see how the new platform performs. The two most important ones were query performance and Total Cost of Ownership (TCO).
Total Cost of Ownership (TCO) #
A significant component of our original cost was storage. Let’s compare Elasticsearch to ClickHouse in terms of storage for the same sample of data:
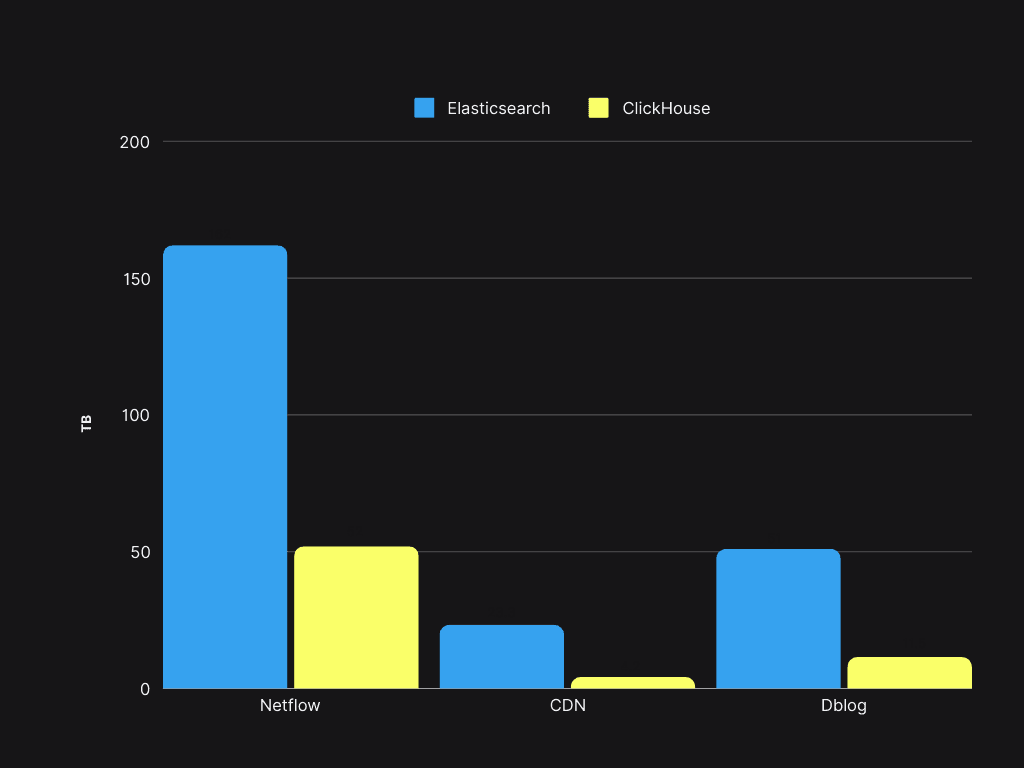
Storage space savings exceeded 50%, enabling the existing Elasticsearch servers to support a 4x increase in data volume with ClickHouse.
Query performance #
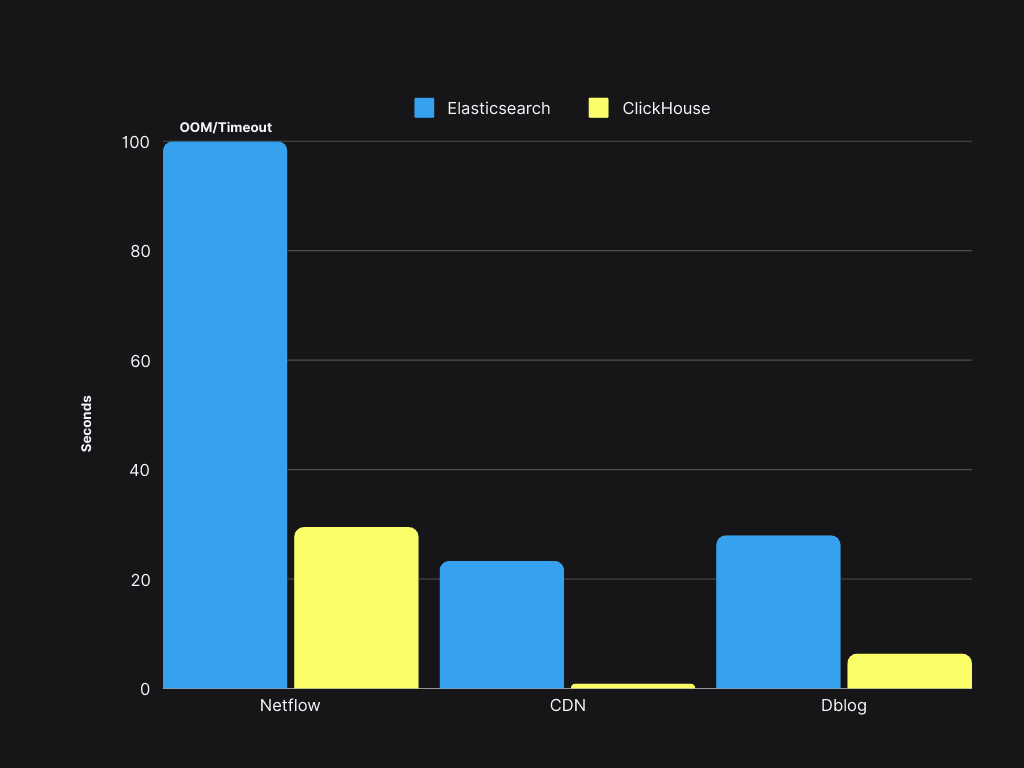
Query speed is 4 to 30 times faster than ElasticSearch, with a P90 of less than 300 ms and a P99 of less than 1.5s.
Logs 3.0: Improving our ClickHouse-based platform #
Since we completed our migration from Elasticsearch in 2022, we have added more logging use cases to our platform, growing it from 4PB to 20PB. As it continued to grow and expand towards 30PB, we faced new challenges.
Performance and functional pain points #
- A single ClickHouse cluster at this scale is challenging to manage. At the time of deployment, there was no ClickHouse-Keeper or SharedMergeTree, and we were facing performance challenges around Zookeeper, leading to DDL timeout exceptions.
- Poor index choices by our users led to suboptimal query performance and the need to re-insert the data with better schema.
- Poorly written and non-optimized queries led to performance issues.
Operational challenges #
- Cluster construction relies on Ansible, resulting in long deployment cycles (several hours).
- Our current ClickHouse instances are multiple versions behind the community version, and the current cluster deployment mode is inconvenient for performing updates.
To address the performance challenges mentioned above, we first moved away from a single cluster approach. At our scale, without SharedMergeTree and ClickHouse Keeper, the management of metadata became hard, and we would experience timeouts for DDL statements due to Zookeeper bottlenecks. So, instead of keeping a single cluster, we created multiple clusters, as shown below:
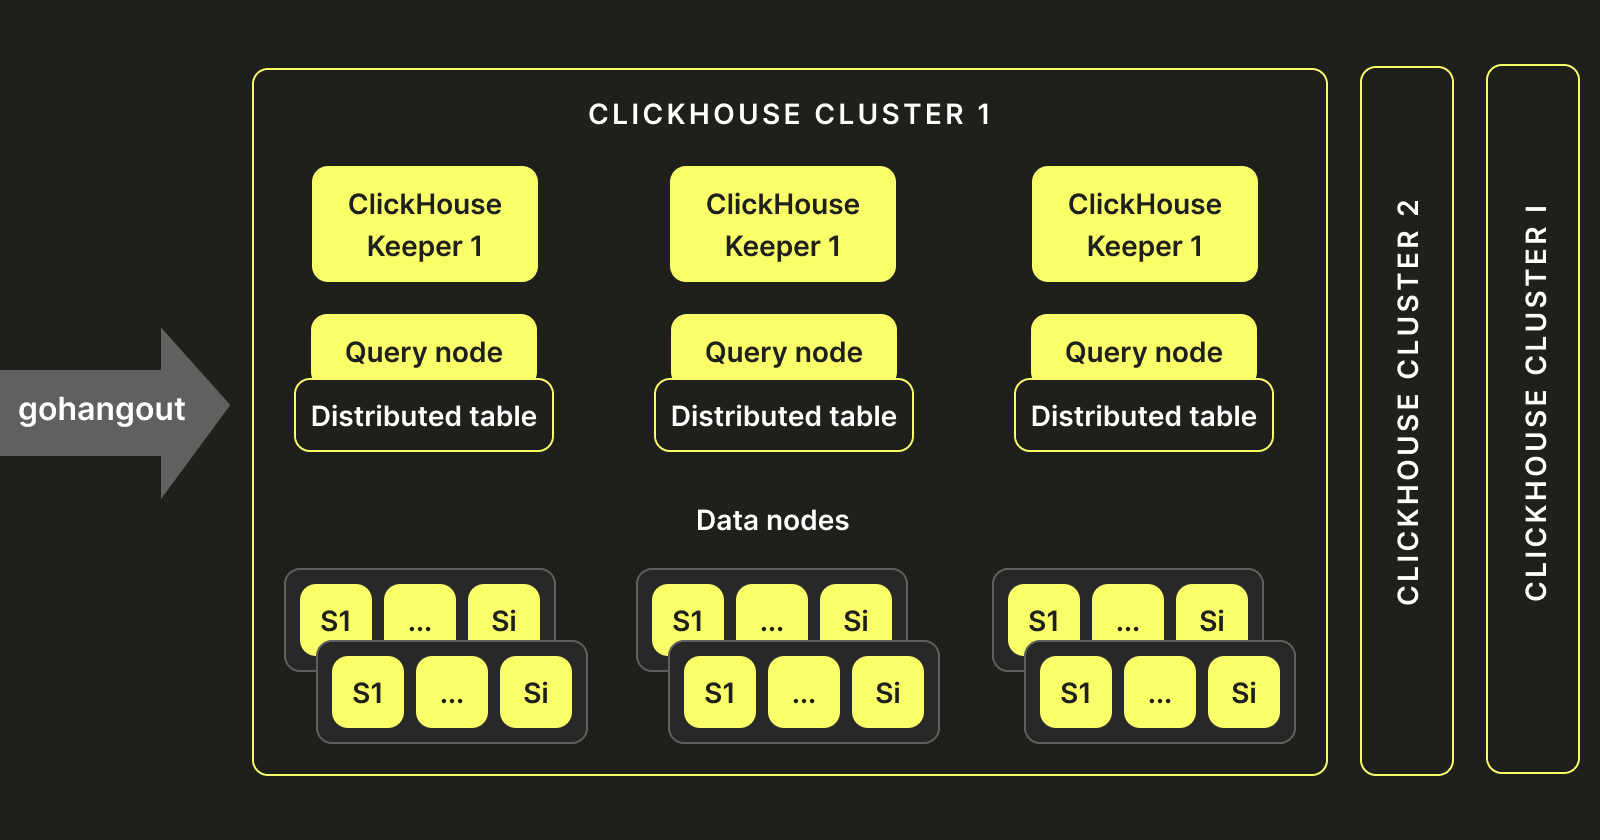
This new architecture helped us scale and overcome Zookeeper's limitations. We deploy these clusters to Kubernetes, using StatefulSets, anti-affinity, and ConfigMaps. This reduces the delivery time for a single cluster from 2 days to 5 minutes. At the same time, we standardized the deployment architecture, streamlining the deployment processes across multiple environments globally. This approach significantly reduced our operational costs and helped with the implementation of the approach mentioned above.
Query routing #
Although the above addressed a number of challenges, it introduced a new layer of complexity around how we assign queries from a user to a specific cluster.
Let's take an example to illustrate it:
Assuming we have three clusters: Cluster 1, Cluster 2, and Cluster 3, and three tables: A, B, and C. Before the implementation of the virtual table partitioning approach we describe below, a single table (like A) could only reside in one data cluster (e.g., Cluster 1). This design limitation meant that when Cluster 1's disk space became full, we had no quick way to migrate Table A's data to the relatively empty disk space of Cluster 2. Instead, we had to use dual-write to simultaneously write Table A's data to both Cluster 1 and Cluster 2. Then, after the data in Cluster 2 had expired (e.g., after seven days), we could delete Table A's data from Cluster 1. This process was cumbersome and slow, requiring significant manual effort to manage the cluster.
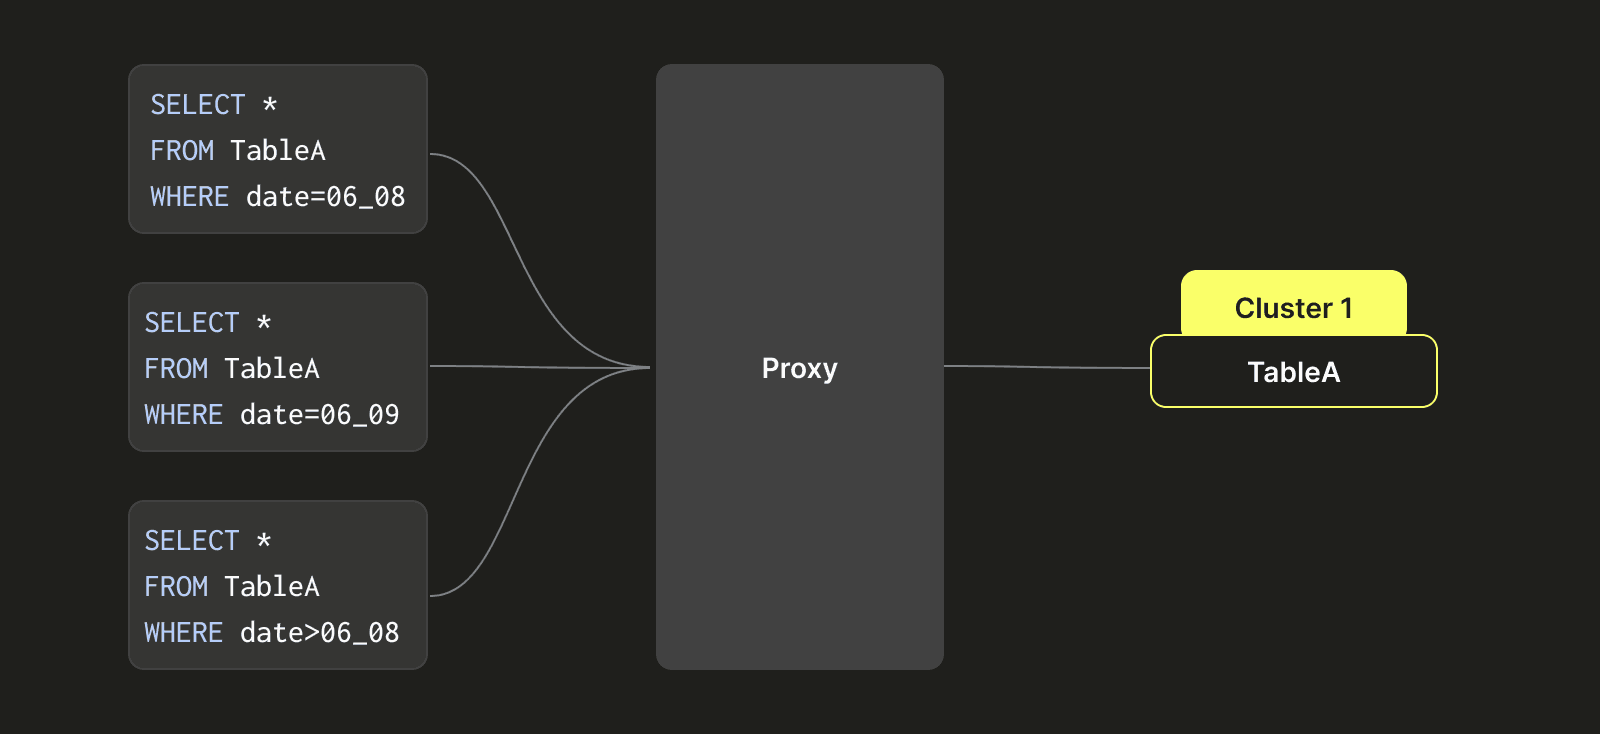
To address this issue, we designed a class-like partitioning architecture to enable Table A to move back and forth between multiple clusters (Cluster 1, Cluster 2, and Cluster 3). As shown on the right side after the transformation, Table A's data is partitioned based on time intervals (which could be precise down to seconds, but for simplicity, we use day as an example here). For example, data for the 8th of June is written to Cluster 1, data for the 9th of June is written to Cluster 2, and data for the 10th of August is written to Cluster 3. When a query hits data from the 8th of June, we only query Cluster 1's data. When a query requires data from the 9th and 10th of June, we simultaneously query data from Cluster 2 and Cluster 3.
We achieve this capability by establishing different distributed tables, with each representing data for a specific time period, and each distributed table is associated with a logical combination of clusters (e.g., Cluster 1, Cluster 2, and Cluster 3). This approach solves the problem of tables crossing clusters, and the disk usage among different clusters tends to be more balanced.
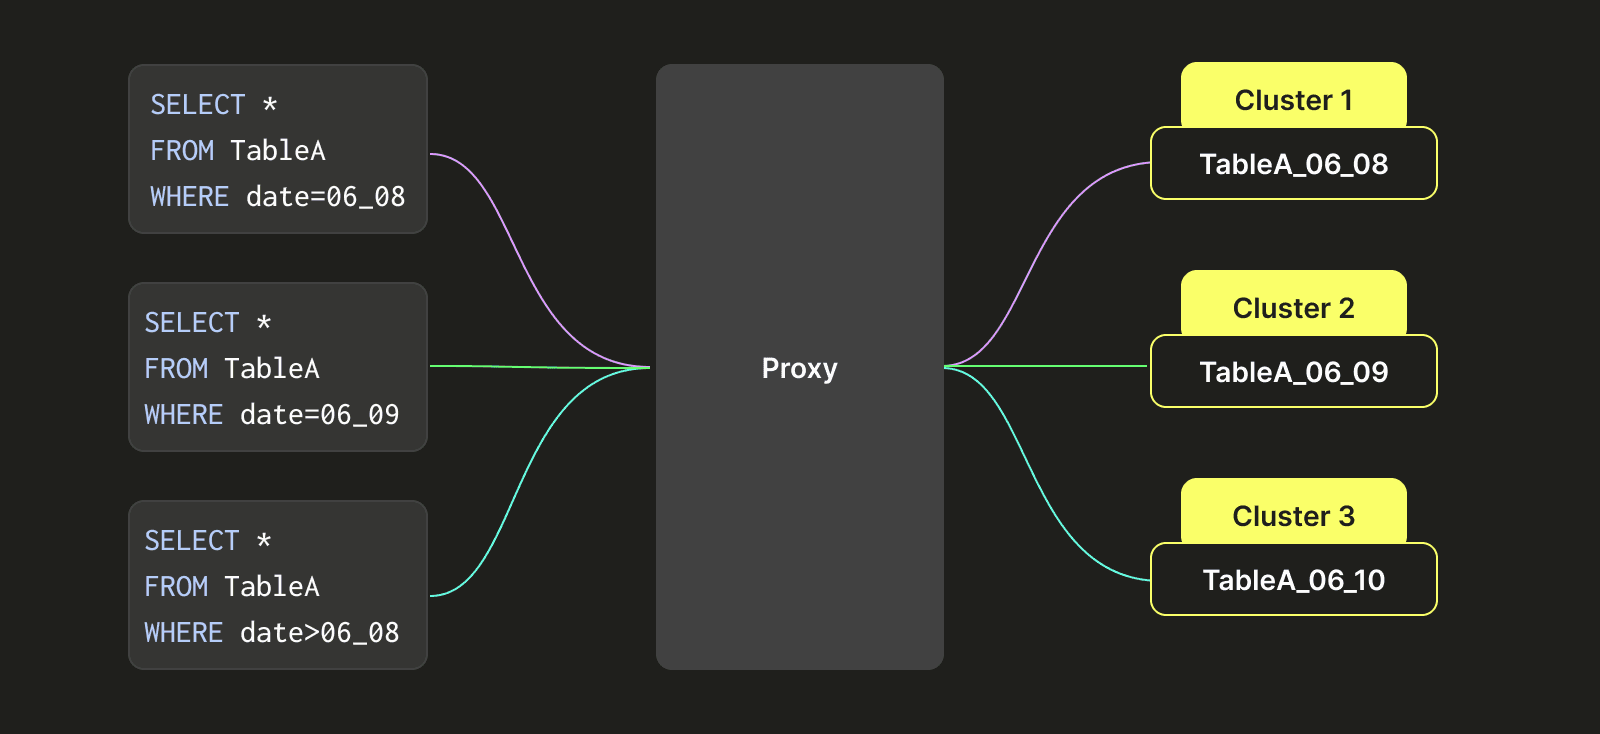
You can see in the image above that each query, depending on its WHERE clause, will be smartly redirected to the right clusters containing the required tables by the proxy.
This architecture can also help with the schema evolution over time. Since columns can be added and deleted, some tables can have more or fewer columns. The above routing can be applied at the column level to address this, with the proxy able to filter the tables that do not contain the required columns for a query.
In addition to the above, this architecture helps us support evolving ORDER BY keys - normally, with ClickHouse, you cannot dynamically change the ORDER BY key of your tables. With the approach mentioned above, you just have to change the ORDER BY key on the new tables and let the old tables expire (thanks to the TTL).
Antlr4 SQL Parsing #
In the query layer, we use Antlr4 technology to parse the user's SQL queries into an Abstract Syntax Tree (AST). With the AST tree, we can then quickly obtain information such as table names, filter conditions, and aggregation dimensions from the SQL queries. With this information at hand, we can easily implement real-time targeted strategies for SQL queries, such as data statistics, query rewriting, and governance flow control.
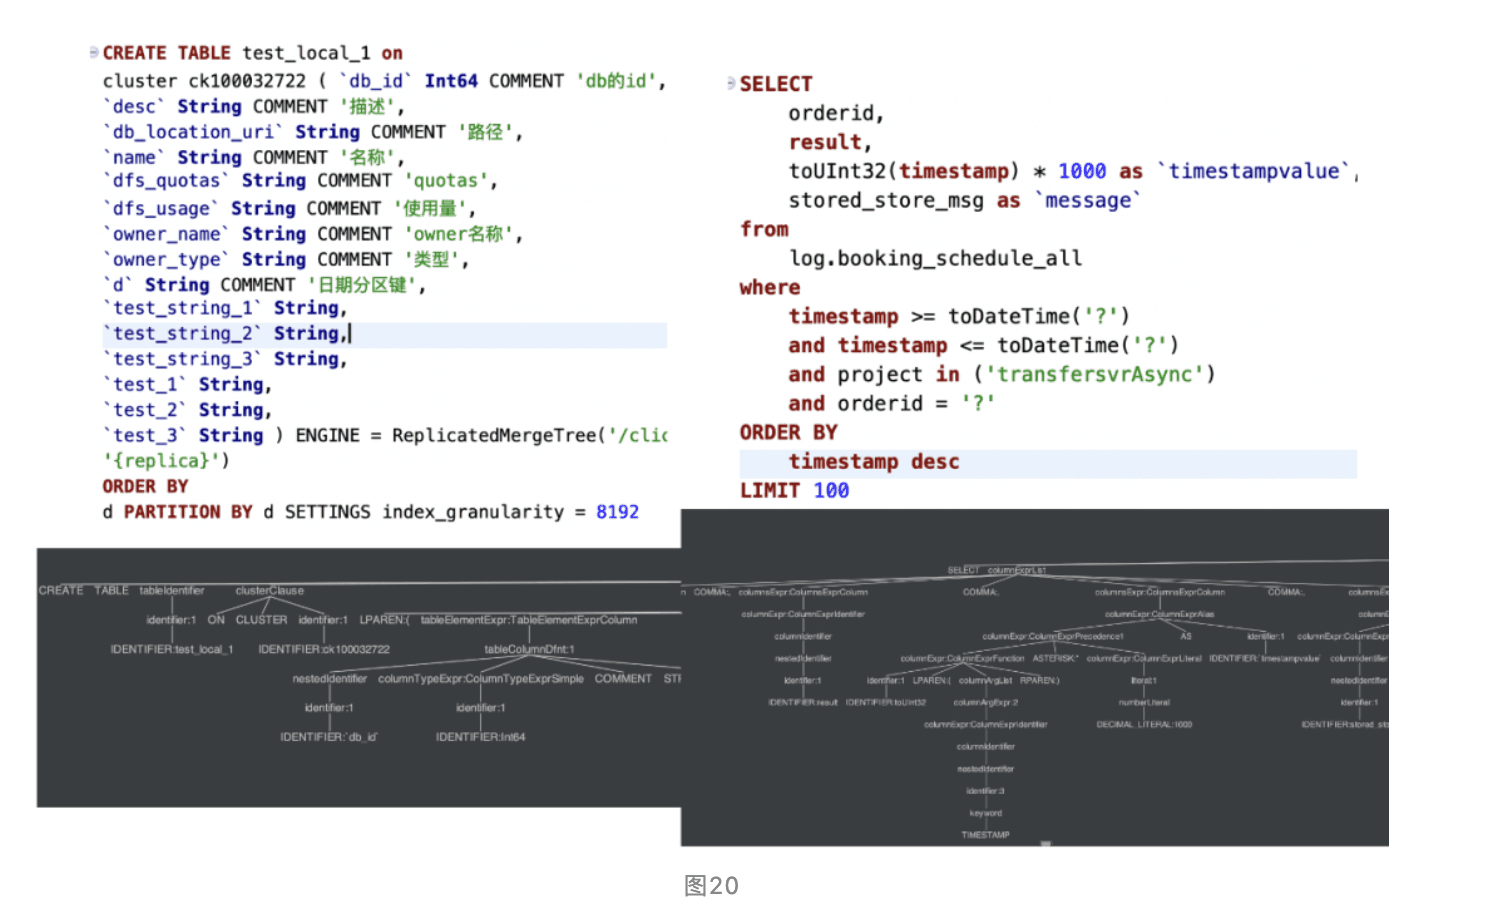
We have implemented a unified query gateway proxy for all user SQL queries. This program rewrites user SQL queries based on metadata information and policies to provide functions such as precise routing and automatic performance optimization. Additionally, it records detailed context for each query, which is used for unified governance of cluster queries, imposing limitations on QPS, large table scans and query execution time to improve system stability.
What’s the future of our platform? #
Our platform has been proven at a 40PB+ scale, but much more still needs to be improved. We want to be more dynamically scalable in order to absorb our high peak usage more gracefully around periods such as vacations. In order to handle this growth, we started exploring ClickHouse Enterprise Service (via Alibaba Cloud), which introduced the SharedMergeTree table engine. This provides a native separation of storage and compute. With this new architecture, we can offer almost unlimited storage to support more logging use cases within trip.com.
The ClickHouse Enterprise Service offered in Alibaba Cloud is the same version of ClickHouse used by ClickHouse Cloud.
Testing the ClickHouse Enterprise Service on AliCloud #
To test the ClickHouse Enterprise Service, we started by doing a dual write of our data, inserting it into both our existing deployment and a new service leveraging SharedMergeTree. To simulate a realistic workload, we:
- Loaded 3TB of data into both clusters, followed by a continuous insertion load.
- Collected a variety of query templates to use as a testing set.
- Using a script, we built queries that will query random 1hr time intervals with specific values guaranteeing a non-empty result set.
When it comes to the infrastructure used:
- 3 nodes of 32 CPU with 128 GiB of memory using object storage for the ClickHouse enterprise offering (with SMT)
- 2 nodes of 40 CPU with 176 GiB of memory with HDD for the community edition (Open-Source)
To execute our query workload, we used the clickhouse-benchmark tool (available with ClickHouse) for both services.
- Both the enterprise and community options are configured to use the filesystem cache as we want to reproduce similar conditions to the one we might have in production (we should expect a lower cache hit rate in production, given the data volume would be much larger)
- We will run the first test with a concurrency of 2, and each query will be executed in 3 different rounds.
| Testing Round | P50 | P90 | P99 | P9999 | Avg | |
|---|---|---|---|---|---|---|
| Alicloud Enterprise Edition | 1st | 0.26 | 0.62 | 7.2 | 22.99 | 0.67 |
| 2nd | 0.24 | 0.46 | 4.4 | 20.61 | 0.52 | |
| 3rd | 0.24 | 0.48 | 16.75 | 21.71 | 0.70 | |
| Avg | 0.246 40.3% | 0.52 22.2% | 7.05 71.4% | 21.77 90.3 | 0.63 51.6% | |
| Alicloud Community Edition | 1st | 0.63 | 3.4 | 11.06 | 29.50 | 1.39 |
| 2nd | 0.64 | 1.92 | 9.35 | 23.50 | 1.20 | |
| 3rd | 0.58 | 1.60 | 9.23 | 19.3 | 1.07 | |
| Avg | 0.61 100% | 2.31 100% | 9.88 100% | 24.1 100% | 1.07 100% |
The results from the ClickHouse Enterprise Service are in yellow with the results of the Alicloud community edition in red. The performance percentage relative to the community edition is in green (the lower, the better).
Now, as we increase the concurrency, the community edition quickly stops being able to handle the workload and starts returning errors. This effectively means the enterprise edition is able to effectively process three times as many concurrent queries.
Although ClickHouse’s Enterprise Service uses object storage as its means of storing data, it still performs better - particularly with respect to highly concurrent workloads. We believe this seamless in-place upgrade could remove a large operational burden for us.
As a result of this test, we decided to start migrating our business metrics to the enterprise service. This contains information about payment completion rates, order statistics, etc and we recommend all community users give the enterprise service a shot!


