50.6k
50.6k
TL;DR: Store and query Prometheus metrics in ClickHouse Cloud without rewriting the PromQL queries your team already relies on. The private preview lets you send metrics via Prometheus remote write, then query them with PromQL in ClickStack, Grafana, or ClickHouse.
Today, we are announcing the private preview of PromQL and the TimeSeries table engine on ClickHouse Cloud, alongside PromQL support in ClickStack.
ClickHouse is already where a lot of teams keep their logs and traces. Now, teams using Prometheus can store and query metrics in the same place without rewriting their existing PromQL queries in SQL.
Send metrics through Prometheus remote write, and they land in a TimeSeries table built on a ClickHouse storage engine designed specifically for time-series data. Query them with PromQL through ClickStack, Grafana, or ClickHouse. The language stays the same. The storage can change.
But supporting PromQL is about more than accepting new query syntax. The language reflects decisions made throughout the Prometheus metric lifecycle, from how metrics are exposed and scraped to how they are encoded and interpreted. To understand what ClickHouse needs to preserve, we first need to understand why Prometheus metrics benefit from their own query language.
You can sign up for the PromQL private preview waitlist.
Join the PromQL support in ClickHouse waitlist
Sign up for private preview access to PromQL support in ClickHouse
Why do Prometheus metrics benefit from their own query language?
PromQL isn't shorthand for SQL. The reason for PromQL’s existence sits in the shape of the data and the decisions made in the design of Prometheus itself; and as a metrics spec. Each decision is built on top of a decade-tenured design to be able to handle the scale and coordination required in observing distributed systems.
Prometheus began at SoundCloud in 2012, built by engineers who had just left Google and wanted the same properties they had used internally: a dimensional data model, a pull-based collection path, and a query language that understood both. Julius Volz wrote the first form of PromQL that same year, as part of a prototype that could already scrape, store, and graph. The public announcement came in January 2015. The language and the types have been a pair ever since, which is why a reader who meets PromQL today is meeting a data model that is more than a decade old.
The model spread for a reason. In May 2016, the Cloud Native Computing Foundation accepted Prometheus as its second hosted project, immediately after Kubernetes. Prometheus had been built for an environment where instances are short-lived, and identity is a set of labels rather than a hostname. That is the environment Kubernetes went on to create everywhere. A generation of platform teams inherited both at once. That is why so many organizations run PromQL dashboards and alerts that they never deliberately chose.
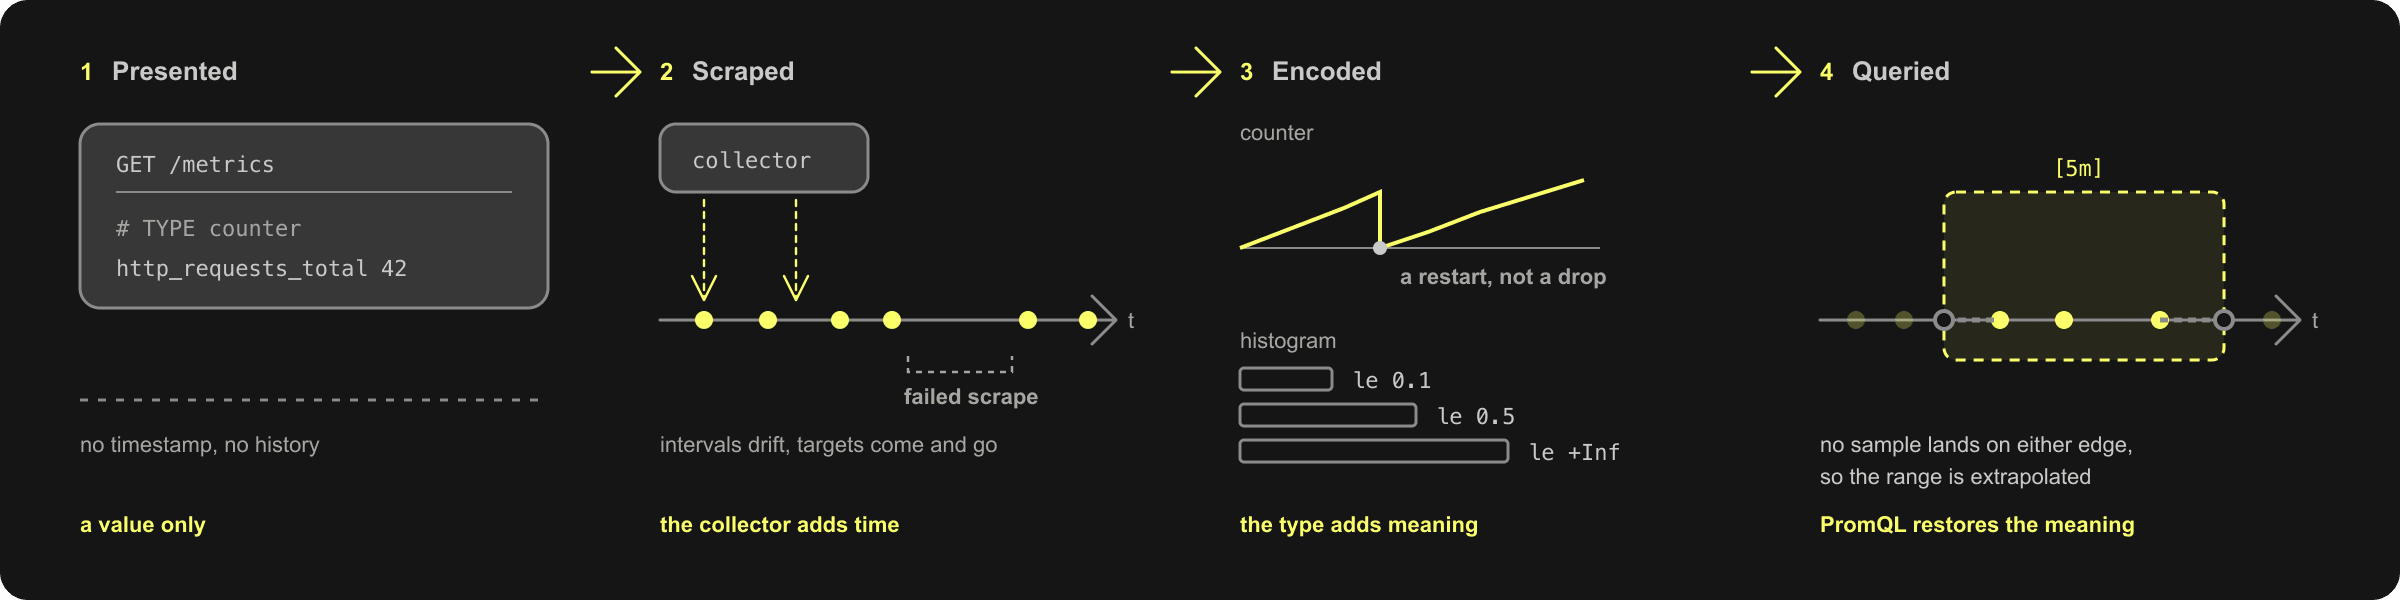
To understand why Prometheus metrics benefit from their own query language, we must understand their lifecycle. Let’s walk through the lifecycle of a Prometheus metric:
Presented for Pulling
In the Prometheus design, an application does not send its metrics explicitly to a receiver. It exposes its current state on an HTTP endpoint and waits. There are no timestamps in that payload, no history, and no promise that anyone will ever read it.
This single decision shapes almost everything about how Prometheus data is collected, stored, and queried. An instrumented service needs no delivery buffer, no backend address, and no way to handle a slow or unavailable monitoring system. It simply exposes its current state. This makes applications easy to instrument by moving the harder work, such as collection, timing, storage, and failure handling, downstream.
The tradeoff is that the application knows nothing about time, so every question about time is answered by something else, somewhere else. What begins as a simple collection choice becomes the foundation for the whole system.
Scraped for Collection
A collector pulls each endpoint on an interval, and the timeline is created at that moment. The application contributes a value. Values are either monotonically incremented as a counter, arbitrarily incremented and decremented as a gauge, bucketed measurements as a histogram, or aggregated measurements as a summary. You can find more about the four core Prometheus metric types in their official documentation here. Yet, they are all void of timestamps. It is the collector that contributes the timestamp; specifically at scrape time.
Pulling gives you target discovery, a health signal in the scrape itself, and a design that naturally protects applications in the event of a metrics system degradation. The tradeoff is that it does not give you a regular timeline. Intervals drift under load, scrapes fail and leave gaps, and targets appear and disappear with every deployment. Two series describing the same request path can hold a different number of samples over the same window.
Encoded for Storage
Because a scrape carries only the current state, the type has to carry the rest of the meaning. This is why Prometheus types look unusual next to ordinary numeric columns.
A gauge is the straightforward case, meaningful exactly as it is read. A counter is not. It only ever increases, it means nothing except as a difference between two reads, and it returns to zero when the process restarts. A histogram is even more complex: One scrape cannot carry a distribution, so a histogram is published as a family of cumulative bucket series sharing an le label (a shortening of the phrase “less than or equal to”), and the distribution exists only once those siblings are recombined.
The type is a contract. It states how the number is allowed to be interpreted, and it carries information that a column definition cannot.
Queried for Observation
By the time a query runs, the previous three decisions have already set its terms.
Take irate(http_requests_total[5m]). The reset has to be read as a restart rather than a drop of several million. The samples rarely sit on the window boundary, so the result has to reach the edges of the range by extrapolation. The spacing varies, so the window cannot assume a fixed number of samples. Each of those follows directly from presentation, scraping, and encoding.
histogram_quantile(0.95, ...) inherits the same debt from the other direction. It regroups the sibling bucket series by le, combines their counts in order, and interpolates inside the bucket holding the target rank.
This is why Prometheus metrics benefit from their own language; and why PromQL exists as a language of its own. It holds the accumulated knowledge of a data model built for unpredictable delivery, and it applies that knowledge to every query without asking the person at the keyboard to remember any of it.
Before this preview, there was no standard way to query Prometheus metrics in ClickHouse with PromQL. Teams either rewrote their queries in SQL or built and maintained their own PromQL-to-SQL translation layer.
All of this is expressible in SQL, but translating it correctly is difficult. Every PromQL function comes with boundary conditions, and even a subtle difference in reset handling can produce a query that looks plausible but returns different results. During a migration, those inconsistencies undermine confidence at exactly the wrong moment.
Evaluating PromQL inside ClickHouse puts that responsibility in the server. It lets us preserve the language’s exact semantics and produce the same results users already expect from Prometheus. That consistency gives teams confidence that they can migrate without quietly changing the meaning of their dashboards, alerts, or queries. How ClickHouse achieves this efficiently is a subject in its own right, so we will cover it in a separate post.
We’re obsessed with performance, and that extends past the boundaries of SQL. It’s not just our responsibility to transpile PromQL to SQL, but to transpile PromQL into performant SQL, and we gladly accept that responsibility.
What is in the private preview?
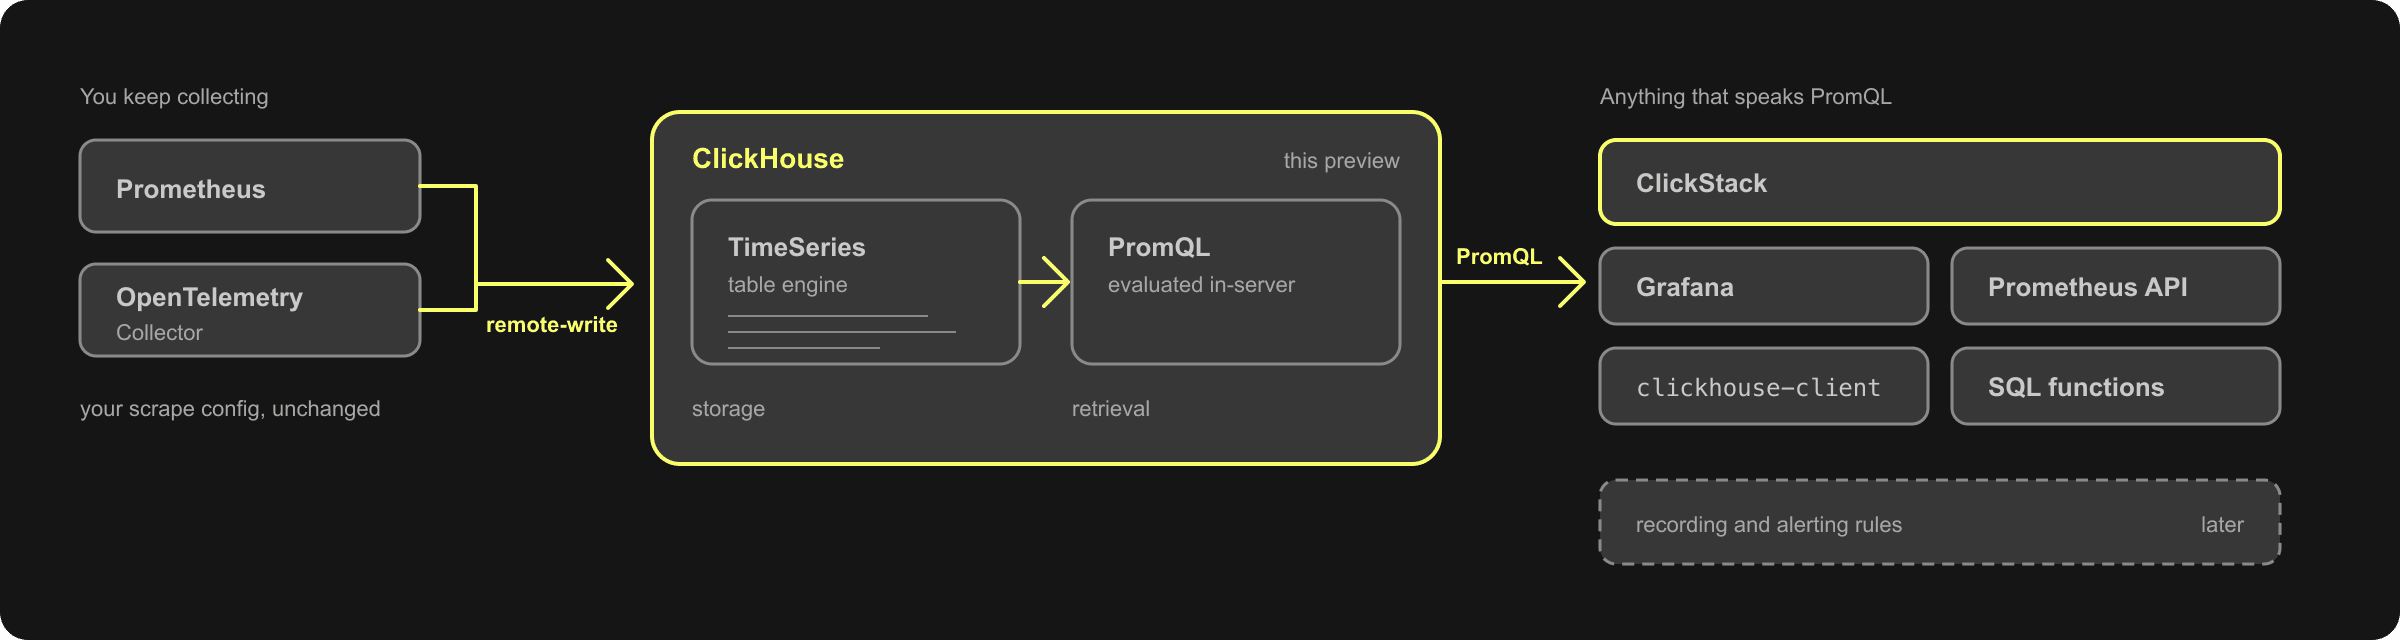
A Prometheus deployment does four jobs. Something scrapes targets, something stores the samples, something answers queries, and something evaluates rules.
This preview takes over storage and querying.
Collection is unchanged. Keep the Prometheus servers, agents, or OpenTelemetry collectors you already run, and keep the scrape configuration you tuned. ClickHouse accepts what they produce over the Prometheus remote-write v1 protocol.
The samples land in a TimeSeries table, which stores metric metadata, a set of labels, and timestamped values. Retrieval is where PromQL arrives. Any tool that already targets the Prometheus HTTP API can point at the service and query it. A Prometheus server can read the table as a remote-read backend. clickhouse-client evaluates PromQL directly through its promql dialect. SQL reaches it through the prometheusQuery and prometheusQueryRange table functions. All four run the same PromQL implementation inside the server, so a query means the same thing wherever you send it.
And finally, if you are looking for an alert evaluation tool to bring your Alerting Rules and Recording Rules into ClickHouse, stay tuned for a later announcement.
How do I get metrics in?
Once your ClickHouse Cloud service has been upgraded by our support team, create a TimeSeries table. The column list is optional, and the default is a reasonable place to start.
CREATE DATABASE prometheus;
CREATE TABLE prometheus.metrics ENGINE = TimeSeries;If you run Prometheus, add the endpoint as a remote-write target:
remote_write:
- url: https://your-service.clickhouse.cloud:8443/prometheus/api/v1/write?database=prometheus&table=metrics
basic_auth:
username: default
password: <password>If you collect metrics with the OpenTelemetry Collector, use the Prometheus remote-write exporter:
extensions:
basicauth/demo:
client_auth: { username: default, password: "<password>" }
...
exporters:
prometheusremotewrite:
endpoint: https://your-service.clickhouse.cloud:8443/prometheus/api/v1/write?database=prometheus&table=metrics
auth:
auth: { authenticator: basicauth/demo }How do I query it?
There are many ways to query a Prometheus server, all of which have their pros and cons. Here are all the ways you can do that:
Via Grafana
Point a Grafana Prometheus data source at the service. The URL stops before /api/v1, and the table selection travels as a query parameter:
apiVersion: 1
datasources:
- name: ClickHouse Prometheus
type: prometheus
access: proxy
url: https://your-service.clickhouse.cloud:8443/prometheus
basicAuth: true
basicAuthUser: default
jsonData:
httpMethod: GET
customQueryParameters: database=prometheus&table=metricsVia Curl
curl --user default:<password> --get \
"https://your-service.clickhouse.cloud:8443/prometheus/api/v1/query" \
--data-urlencode "query=rate(http_requests_total[5m])" \
--data-urlencode "database=prometheus" \
--data-urlencode "table=metrics"Via the clickhouse-client CLI
clickhouse-client \
--dialect promql \
--promql_database prometheus \
--promql_table metrics \
--query 'rate(http_requests_total[5m])'Via SQL in a ClickHouse session
SELECT
tags['service'] AS service,
time_series
FROM prometheusQueryRange(
prometheus.metrics,
'sum by (service) (rate(http_requests_total[5m]))',
now() - INTERVAL 1 HOUR,
now(),
INTERVAL 1 MINUTE
);and now announcing, via ClickStack
ClickStack exposes a TimeSeries table as a PromQL data source as part of the same private preview. Once the source is configured, you write PromQL in the chart editor, and ClickStack sends it through the Prometheus-compatible interface backed by ClickHouse.
The preview covers charting, dashboards, series queries, and scalar queries. ClickStack can also proxy PromQL to an external Prometheus-compatible endpoint, so metrics stored outside ClickHouse can be read through the same interface.
The private preview focuses on exploring metrics through charts and dashboards. You write PromQL directly in the chart editor; a visual PromQL query builder and alerting on PromQL queries are not yet supported.
ClickStack also supports variables inside PromQL queries, allowing you to pass filter values into your expressions and coordinate filtering across metrics, logs, and traces. We’re actively expanding this integration.
For ingestion, metrics destined for a TimeSeries table need the Prometheus remote-write pipeline shown above. ClickStack’s standard OTLP pipeline does not populate these tables. If you already use an OpenTelemetry Collector, configure its Prometheus remote-write exporter to send metrics to the table.
Note: ClickStack also supports OpenTelemetry metrics through a dedicated source type, which remains unchanged. In the future, we’ll explore supporting OpenTelemetry metrics via the
TimeSeriesengine - thus unifying Prometheus and OpenTelemetry metrics under a single source type and enabling querying of OTel metrics with PromQL.
What do you plan to support in the future?
Dialect Coverage coverage is over 85%, and we are marching to 100% in the order that unblocks the most dashboards at a time. If your favorite function or operator does not yet fall into support yet, reaching out to us with your unsupported queries is the best way for that support to land. You can find our entire list of what is and is not supported in our documentation here.
Downsampling is a topic that comes up, and is something that exists at a higher level of complexity beside slapping a TTL on a table and calling it feature-complete. We want to release a downsampling feature that does not store copies of your data at coarser granularity, but instead produces configurable compaction when the time comes.
Native Histograms are a newly introduced data structure in the Prometheus ecosystem, and this new data structure demands appropriate attention from us to get it right on the first try.
RecordingRules and AlertingRules are a core component of Prometheus ecosystems, and we have plans to announce our solution for migrating those rules in a later blog post.
OpenMetrics and remote-write v2 protocols are starting to emerge in similar technologies, and we plan to expand our list of supported protocols, along with supporting a direct insert method via our official OTEL ClickHouse Exporter.
Where can I read more?
You can find our resources for the PromQL interfaces in our official docs, here, and our list of supported PromQL functions and operators here.
We will be covering the technical internals of the TimeSeries table engine in a later blog post, but if you would like a preview, you can read our official docs on the table engine here.
Any questions you may have, curiosities you seek, or feedback you'd like to provide can be given in the #promql channel in our community Slack.
How do I join the private preview?
This preview brings Prometheus metrics into ClickHouse for storage and querying while preserving the PromQL semantics users already expect.
The private preview is open today, and places are limited. Register here and tell us about:
- The size and cardinality of your metrics estate.
- The PromQL your dashboards and alerts actually contain.
- What would have to be true for you to move off the metrics system you run today.
If you already work with a ClickHouse account team, mention the preview to them as well. To learn more about the feature, read the PromQL documentation.
Your feedback will help shape what comes next.
Happy monitoring!