 50.5k
50.5k
Conventional wisdom says OLTP query times are measured in milliseconds and OLAP query times are measured in seconds or minutes. That assumption is out of date. On the 100 GB ClickBench hits dataset (99.9M rows, 105 columns), the fastest OLAP engines now answer the median analytical query in 148 ms on a single c6a.4xlarge AWS instance — and answer 43 out of 43 queries in under 10 seconds.
Below are the OLAP databases ranked by their published results on ClickBench on c6a.4xlarge. ClickHouse maintains both ClickBench and this page; the benchmark is open-source, the methodology is published, and every number below is reproducible from the public scripts against the public data.
How we ranked these databases
Every number on this page comes from the publicly available ClickBench results on the c6a.4xlarge AWS instance against the 100 GB hits dataset (99.9M rows, 105 columns): hot-cache query timings across 43 analytical queries, plus the load time and compressed footprint reported by each engine's run. The numbers, scripts, and dataset are all public; results are reproducible from the ClickBench repository.
Cost-per-query, concurrency, and operational complexity are ranked separately in the best columnar databases.
ClickBench scorecard (c6a.4xlarge, hits 100 GB)
| Engine | Wins (of 43) | Median hot | Slowest hot | Failed | Load time | Compressed size |
|---|---|---|---|---|---|---|
| ClickHouse | 32 | 0.148 s | 9.6 s | 0 | 5 min | 14.21 GiB |
| DuckDB | 10 | 0.348 s | 6.5 s | 0 | 2 min | 19.05 GiB |
| Apache Pinot | 1 (tie) | 3.02 s* | 19.1 s | 5 | 34 min | not reported |
| Apache Druid | 1 | 1.77 s* | 60.1 s | 14 | 5.5 hr | 42.09 GiB |
| Trino (Parquet) | 0 | 2.72 s | 36.2 s | 0 | x | 13.73 GiB |
- Median calculated over completed queries only. Failed queries are not counted in the median, but they are counted in the failure column.
The gap between the fastest engine (ClickHouse) and the second fastest (DuckDB) is roughly 2x on the median, but the gap to engines #3–5 is an order of magnitude. Failure count is a binary divider: engines with zero failures (ClickHouse, DuckDB, Trino) can be deployed against an arbitrary analytical workload; engines with 5+ failures (Pinot, Druid) require workload pre-validation.
Latency budget interacts with engine choice as a one-way constraint: an engine that hits a tighter budget can also serve a looser one, but the reverse isn't true. ClickHouse and DuckDB hit sub-second median on this workload, so they can also serve internal BI dashboards refreshed every few seconds; Trino hits a 2.7 s median, so it cannot be retrofitted to a sub-second user-facing dashboard without architectural change.
1. ClickHouse
ClickHouse is an open-source columnar database designed for sub-second analytical query latency at billion-row scale. On ClickBench c6a.4xlarge, ClickHouse:
- Wins or ties on 32 of 43 queries.
- Posts a median hot-cache latency of 148 ms and a tail of 9.6 s (Q28).
- Compresses the 100 GB dataset to 14.21 GiB, the smallest footprint of any engine in the table, and loads it in 5 minutes.
- Completes every query in the suite.
The architecture is MergeTree-family columnar storage with sparse primary indexes, vectorised query execution using SIMD instructions, and asynchronous background merges that keep append-mostly workloads write-efficient. Compute and storage can be separated in ClickHouse Cloud, which keeps data on S3 and scales compute independently. The full deep-dive on the design is in why columnar databases are fast.
Typical fit is user-facing dashboards at sub-500ms latency, operational analytics, observability, and streaming ingest workloads where sub-second response on billions of rows is the requirement. Production deployments at Cloudflare, Uber, eBay, GitHub, and Sentry confirm the production envelope at petabyte scale.
ClickHouse is not an OLTP database for transactional workloads, for which Postgres alongside ClickHouse via CDC is the usual pattern; see Postgres alongside ClickHouse.
"At Coinhall, managing vast amounts of blockchain data efficiently is crucial for our consumer-facing trading platform. Initially, we used BigQuery, but as our data grew, so did its costs and performance issues. After exploring several alternatives, we found ClickHouse to be the clear winner. ClickHouse significantly outperformed other databases we tested like Snowflake, Rockset, and SingleStore, and delivered at 40x cost savings."
2. DuckDB
DuckDB is an open-source in-process columnar database, the OLAP equivalent of SQLite. On ClickBench c6a.4xlarge, DuckDB:
- Wins 10 of 43 queries (Q5, Q12, Q14, Q16–Q18, Q28, Q32–Q34).
- Posts a median hot-cache latency of 348 ms, 2.35x ClickHouse's median, but still firmly sub-second.
- Tail latency is 6.5 s (Q28).
- Loads the dataset in 2 minutes, the fastest load of any columnar engine in the table.
- Completes every query in the suite.
DuckDB is an in-process query engine with strong performance when the dataset is small enough to fit in memory on a single machine.
3. Apache Pinot
Apache Pinot is an open-source real-time OLAP engine, optimised for low-latency user-facing workloads at high concurrency. On ClickBench c6a.4xlarge, Pinot:
- Ties ClickHouse on Q0 (0.001 s), the only query where Pinot reaches the leader's latency.
- Posts a median hot-cache latency of 3.02 s across the 38 queries it completes.
- Tail is 19.1 s on Q20 and 14.7 s on Q5, heavy aggregations where the inverted-index strategy doesn't help.
- Fails 5 queries (Q6, Q18, Q21, Q28, Q42); the engine cannot return a result.
- Loads the dataset in 34 minutes, but was unable to load all data, thus did not post a compressed size.
The architecture is segment-based columnar storage with a heavy index toolkit (inverted, sorted, range, JSON, geo, and text indexes) selectable per column. Pinot's design target is the high-QPS, small-range query: thousands of concurrent dashboard requests against a recent slice of data. Pinot is the engine behind LinkedIn's "Who Viewed Your Profile" feature.
Pinot is at its best when a limited set of well-known query shapes needs to serve extreme concurrency in user-facing surfaces. It is a complex multi-component cluster system, so small deployments and ad-hoc analytics workloads (where the index design hasn't been planned in advance, or where the queries need JOINs) are a poor fit.
4. Apache Druid
Apache Druid is an older, open-source, real-time analytics engine optimised for time-series and streaming ingest from Kafka. On ClickBench c6a.4xlarge, Druid:
- Wins Q24 (0.016 s), a filter pattern that hits its bitmap-index sweet spot.
- Posts a median hot-cache latency of 1.77 s across the 29 queries it completes.
- Tail is 60.1 s on Q35 and 59.3 s on Q14, patterns where ClickHouse runs in 0.25 s and 0.52 s respectively, a 100–230x gap.
- Fails 14 queries, by far the highest failure count in the table.
- Loads the dataset in 5.5 hours and stores it in 42.09 GiB, roughly 3x ClickHouse's compressed footprint.
The architecture is segment-based columnar storage with bitmap indexes on string dimensions, distributed across historical, middle-manager, and broker nodes. Ingestion is streaming-first: each Kafka message becomes queryable within seconds of arrival.
Druid is built for clusters and depends on pre-indexing, so it struggles with ad-hoc analytical queries that don't fit its segment design, and the 14 unsupported query patterns rule it out anywhere the workload isn't known in advance. ClickHouse and Pinot have the edge on high-concurrency low-latency dashboards.
Federated query engines: Trino
Trino (and its predecessor Presto) is a distributed SQL query engine, not a database. It pushes queries against external storage (Iceberg, Hive, S3 Parquet, Postgres) without owning the data layout. On ClickBench c6a.4xlarge against partitioned Parquet on local disk, Trino:
- Completes every query in the suite.
- Posts a median hot-cache latency of 2.72 s and a tail of 36.2 s on Q23.
- Has a per-query floor of roughly 1.3 s; the lightest query in the suite (Q0) still takes 1.26 s, driven by query coordination overhead rather than scan work.
- "Loads" the dataset in 20 seconds because the Parquet files were already on disk; the engine doesn't own ingest.
- Reads 13.73 GiB of Parquet (file size, not the engine's storage footprint, since there isn't one).
Trino's value is federation rather than latency: one SQL surface across heterogeneous sources, no ingest step into a dedicated database, and decoupling of compute lifecycles from data lifecycles. The tradeoffs are operational complexity (catalogs, workers, coordinator, connector configs per source), no native caching or columnar storage layer, and query performance that varies sharply with the source format and partition layout. The 1.3 s coordination floor is structural; Trino cannot serve a sub-second user-facing dashboard regardless of dataset size.
Trino is at its best in lakehouse architectures over Iceberg, Delta, or Hudi where storage independence matters more than query latency, when one SQL surface across multiple databases is the requirement, or when the data already lives in Parquet on object storage and shouldn't move. It is a poor fit for interactive analytics on sub-second budgets, for workloads where consistent latency matters more than storage flexibility, and for teams without the operational capacity to run a multi-component distributed query layer.
Cloud / serverless data warehouses
The cloud data warehouses post sub-second median latency on ClickBench, but ClickHouse Cloud leads the median by 3-5x and wins 38 of 43 queries, on a 2-node deployment against larger competing configurations (Snowflake 16×XL, Databricks 16×L, Redshift 4×ra3.4xlarge, BigQuery serverless). Load times are an order of magnitude apart in the other direction: Snowflake 42 min, Redshift 32 min, BigQuery 13 min vs. ClickHouse Cloud 18 s and Databricks 45 s.
Cloud ClickBench scorecard
| Engine | Wins (of 43) | Median hot | Slowest hot | Failed | Load time | Compressed size |
|---|---|---|---|---|---|---|
| ClickHouse Cloud (2 × 356 GiB nodes) | 38 | 0.109 s | 1.98 s | 0 | 18 s | 9.55 GiB |
| Amazon Redshift (4 × ra3.4xlarge) | 3 | 0.465 s | 4.89 s | 0 | 32 min | 20.78 GiB |
| Snowflake (16 × XL) | 2 | 0.366 s | 1.27 s | 0 | 42 min | 11.46 GiB |
| BigQuery (serverless) | 0 | 0.544 s | 1.85 s | 0 | 13 min | 8.16 GiB |
| Databricks (16 × L) | 0 | 0.546 s | 3.25 s | 0 | 45 s | 9.52 GiB |
The four cloud warehouses were run on configurations larger than ClickHouse Cloud's 2-node footprint: Snowflake on 16×XL compute, Databricks on a 16×L SQL warehouse, Redshift on a 4-node ra3.4xlarge cluster, and BigQuery serverless (which self-scales). Even with that asymmetry, ClickHouse Cloud leads the median 3-5x and concedes only Q1, Q2, and Q7 to Redshift's light-filter cache profile (with Q6 tied), and Q8 and Q28 to Snowflake. The cloud configurations are not directly comparable to the c6a.4xlarge single-instance numbers earlier on this page; cross-reference the two tables with that caveat in mind.
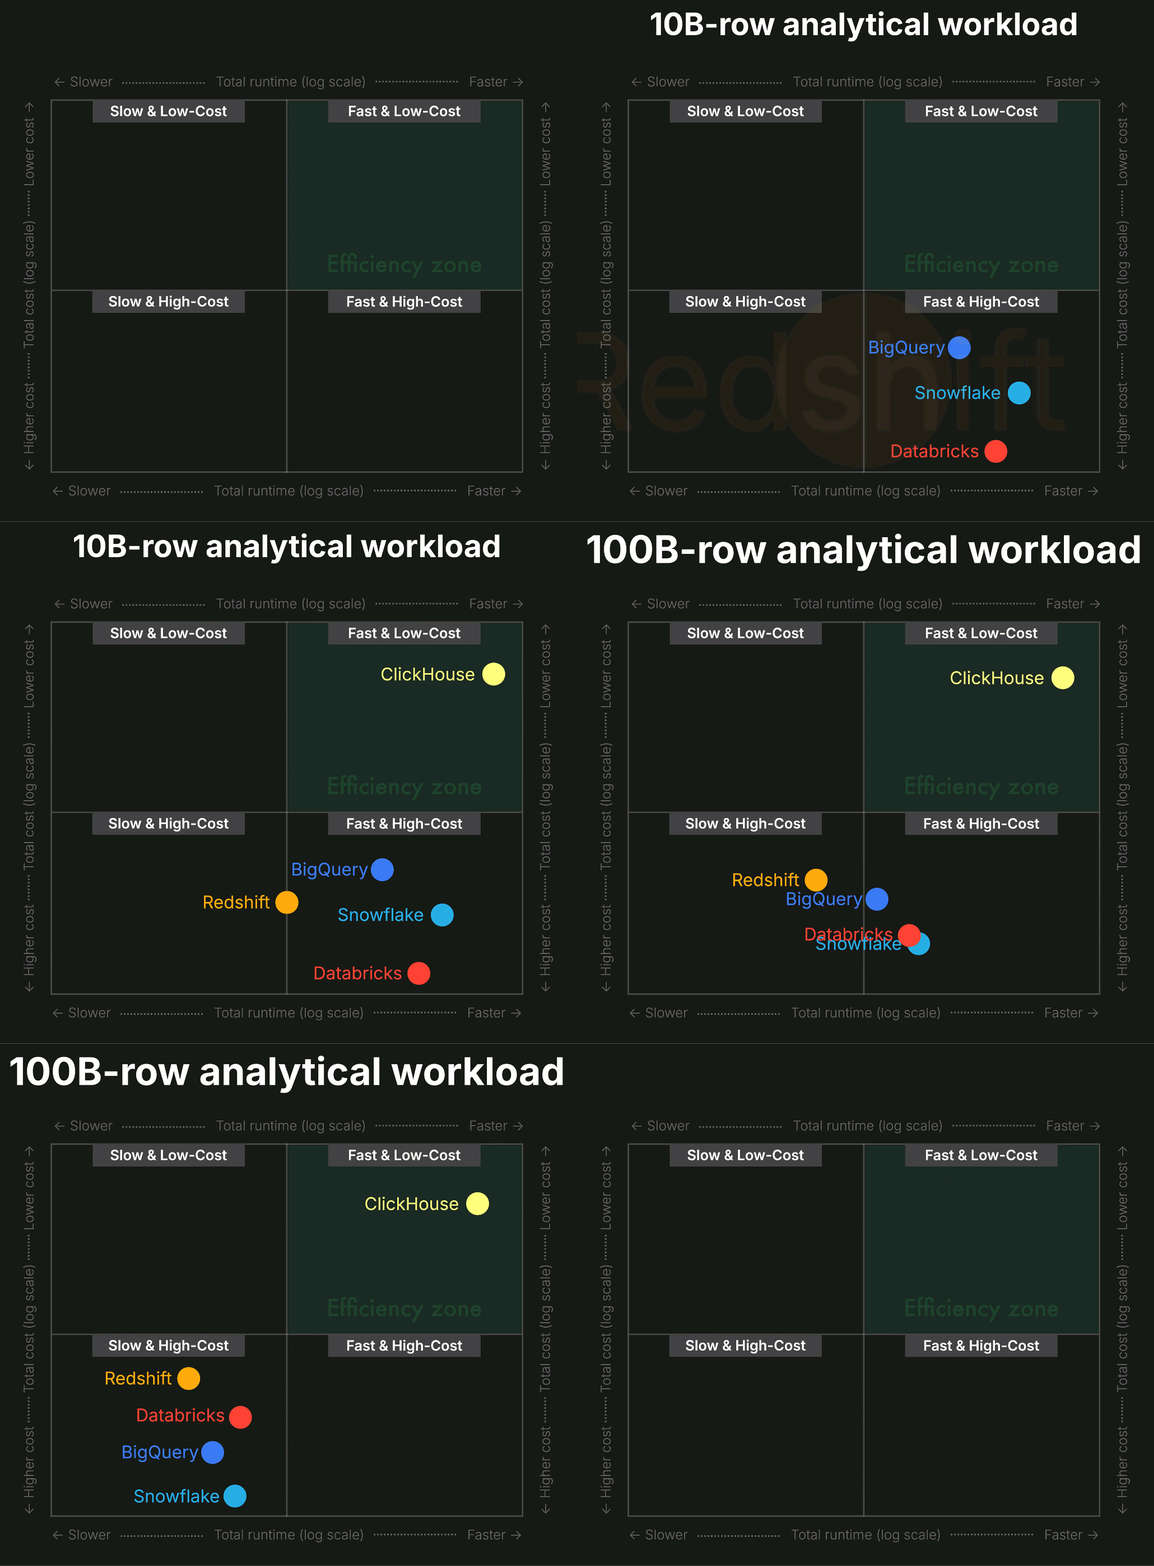
The cloud warehouses reach sub-second median by running 4-16x more compute than ClickHouse Cloud's 2-node deployment, and warehouse cost scales with that size. Driving the warehouses harder will pull latency closer, but at compute spend that doesn't pencil out for an interactive workload. A separate 1B-to-100B row cost-performance comparison shows the gap widening with scale: at 10B rows ClickHouse Cloud was 7-13x better cost-per-query than the next-best alternative; at 100B rows, 23-32x better than the largest Snowflake and Databricks warehouses, with BigQuery further behind.
ClickHouse Cloud
ClickHouse Cloud is the managed deployment of ClickHouse on AWS, GCP, and Azure, with compute and storage separated and elastic scaling per workload. On the cloud ClickBench leaderboard with 2 × 356 GiB nodes, ClickHouse Cloud wins 38 of 43 queries, posts a median of 109 ms, and tails at 1.98 s on Q28, the same Q28 that hits 9.6 s on the c6a.4xlarge single-node run, showing how added compute compresses the heavy-aggregation tail.
The 2-node deployment loads the dataset in 18 seconds and compresses it to 9.55 GiB, beating Snowflake, Redshift, and BigQuery on load time by 40-140x.
Snowflake
Snowflake is a traditional cloud data warehouse with separated compute and storage, micro-partition columnar files, and elastic per-warehouse compute. On 16×XL compute (substantially larger than ClickHouse Cloud's 2-node deployment), Snowflake posts a 366 ms median (3.4x ClickHouse Cloud), a 1.27 s tail on Q33, and wins two queries: Q8 (0.366 s) where the larger compute footprint pulls ahead of every other cloud engine, and Q28 (0.883 s) where its plan beats ClickHouse Cloud's heaviest tail (1.98 s). Load time is 42 minutes; compressed size is 11.46 GiB.
The heavy-aggregation queries (Q5, Q16–Q18, Q32–Q34) still trail ClickHouse Cloud by 1.2-2x even at this larger footprint.
Amazon Redshift
Amazon Redshift is AWS's columnar MPP warehouse. On a 4-node ra3.4xlarge cluster, Redshift posts a 465 ms median, a 4.89 s tail on Q23, zero failures, and a compressed footprint of 20.78 GiB, roughly 2x the other cloud engines. Load time is 32 minutes.
Redshift takes Q1, Q2, and Q7 outright (22-55 ms) and ties ClickHouse Cloud on Q6 (36 ms) — light filter queries where the result-cache profile shows. The heavy patterns are where the cluster strains: Q23 at 4.89 s, Q28 at 4.59 s, Q22 at 3.56 s, Q9 at 3.53 s.
BigQuery
BigQuery is Google Cloud's serverless data warehouse, with a separated storage layer (Capacitor) and elastic compute (slots). On serverless, BigQuery posts a 544 ms median, a 1.85 s tail on Q13, zero failures, and the smallest compressed footprint of any engine in the entire suite at 8.16 GiB. Wins zero queries; its profile is consistent sub-second across the workload rather than peak speed on any individual query.
Databricks
Databricks is the managed Spark and Delta Lake platform; ClickBench runs against its SQL Warehouse compute layer. On a 16×L SQL Warehouse (the second largest compute size tested), Databricks posts a 546 ms median query time (the slowest result of all tested), a 3.25 s tail on Q28, and zero failures. Load time is 45 seconds, the second-fastest cloud load after ClickHouse Cloud, and compressed size is 9.52 GiB.
Choosing between them
The decision is bounded by latency requirement first, deployment shape second, and workload coverage third.
| Workload | Latency / concurrency requirement | Recommended | Why |
|---|---|---|---|
| User-facing dashboard, billions of rows | sub-500 ms | ClickHouse | Full workload coverage; sustains concurrency without per-query index planning; self-hosted or managed cloud |
| The same small-range query repeated at thousands of QPS | sub-second on one narrow, well-known shape | Apache Pinot | Per-column inverted indexes are tuned to a single query shape; failure rate climbs as soon as the workload diversifies |
| Notebook / single-machine analytics over local files | sub-second on 100 GB-ish | DuckDB, chDB | Impressive in-process speed on a laptop |
| Lakehouse over Iceberg / Delta / Hudi | seconds | ClickHouse, Trino, Databricks | Federated SQL over open table formats on object storage |
| Internal BI and batch reporting | latency and concurrency aren't constraints | Snowflake, Redshift, BigQuery | Mature SQL tooling and reporting integrations for scheduled jobs where query time and concurrent users don't drive choice |
For real-time OLAP at sub-second latency on broad analytical workloads, ClickHouse leads both leaderboards: 148 ms median with 32 wins self-hosted on the c6a.4xlarge leaderboard, and 109 ms median with 38 wins on 2 nodes via ClickHouse Cloud on the cloud leaderboard. Pinot earns a spot when the workload narrows to one repeating small-range query at extreme concurrency, where its per-column index toolkit fits — anywhere the query shapes diversify, the failure count on the leaderboard catches up. DuckDB posts genuinely impressive numbers in-process on a single machine. Trino and Databricks fit lakehouse architectures over open table formats, where storage independence matters more than query latency. Snowflake, Redshift, and BigQuery sit in the traditional cloud-DWH bucket for internal BI and batch reporting, where mature SQL tooling matters and neither latency nor concurrency is the binding constraint.
Cost-of-ownership and managed-vs-self-hosted tradeoffs are ranked separately in the best columnar databases. For the broader category overview, see what is an OLAP database? and what is real-time analytics?.
Get started today
Interested in seeing how ClickHouse works on your data? Get started with ClickHouse Cloud in minutes and receive $300 in free credits.
Sign upFrequently asked questions
What is the fastest OLAP database?
ClickHouse leads both ClickBench leaderboards. On c6a.4xlarge self-hosted, it wins or ties 32 of 43 queries with a 148 ms median and zero failures. On the cloud leaderboard, ClickHouse Cloud wins or ties 38 of 43 queries with a 109 ms median, on a 2-node managed deployment that loads the dataset in 18 seconds. DuckDB is the closest open-source follower at a 348 ms median. The cloud data warehouses on larger competing configurations (Snowflake on 16×XL at 366 ms with 2 wins; Redshift on 4×ra3.4xlarge at 465 ms with 3 wins on light filter queries; BigQuery serverless at 544 ms; Databricks on 16×L at 546 ms) all sit 3-5x behind ClickHouse Cloud on hot-cache median.
Is ClickHouse really the fastest OLAP database?
On ClickBench, yes. Self-hosted, ClickHouse wins or ties 32 of 43 queries on c6a.4xlarge. Managed, ClickHouse Cloud wins or ties 38 of 43 queries on the cloud leaderboard against larger competing configurations. The queries it doesn't win are instructive. DuckDB takes 10 on heavy aggregations (Q5, Q12, Q14, Q16–Q18, Q28, Q32–Q34) where its single-process vectorised engine has the edge. Redshift on ra3.4xlarge takes Q1, Q2, and Q7 (22-55 ms) and ties Q6, a result-cache profile on light filter queries. Snowflake on 16×XL takes Q8 and Q28. Pinot ties on Q0, and Druid wins Q24 on its bitmap-index sweet spot. ClickHouse is the strongest general-purpose real-time OLAP database in 2026, and ClickBench records the specific workload shapes where a competitor has the edge.
How is OLAP latency measured on ClickBench?
ClickBench publishes per-query hot-cache and cold-cache timings across a 43-query workload on a fixed 100 GB single-table dataset (hits, web-analytics data with 105 columns). The dataset is public, the workload is published in the repository, and every result on the leaderboard is reproducible from the public scripts against the public data.
How does ClickBench compare to TPC-DS?
ClickBench is a microbenchmark targeted at real-time analytical query latency on a fixed 100 GB single-table dataset, the kind of workload that powers dashboards and operational analytics. TPC-DS is an industry-standard data warehouse benchmark with a 24-table schema, scale factors up to 100 TB, and a 99-query workload aimed at complex multi-join warehouse analytics. ClickBench measures interactive single-table aggregation latency. TPC-DS measures complex multi-join warehouse-scale query optimisation. Engines that win one frequently win the other, but not always.
Why isn't [vendor] on this list?
ClickBench is open-source, and vendors are invited to submit their own results. If a vendor isn't present, it's because they have not submitted a result to ClickBench. Some vendors prevent their systems from being publicly benchmarked (DeWitt clause), which prevents it from being added on their behalf.


