50.6k
50.6k
ClickHouse Cloud vertically autoscales services for you. Behind the scenes, a recommendation service watches how each service behaves and decides how much CPU and memory it should have. When your workload grows, it scales up. When your workload quiets down, it scales back down so you are not paying for capacity you no longer use. These decisions are driven by our two-window recommender.
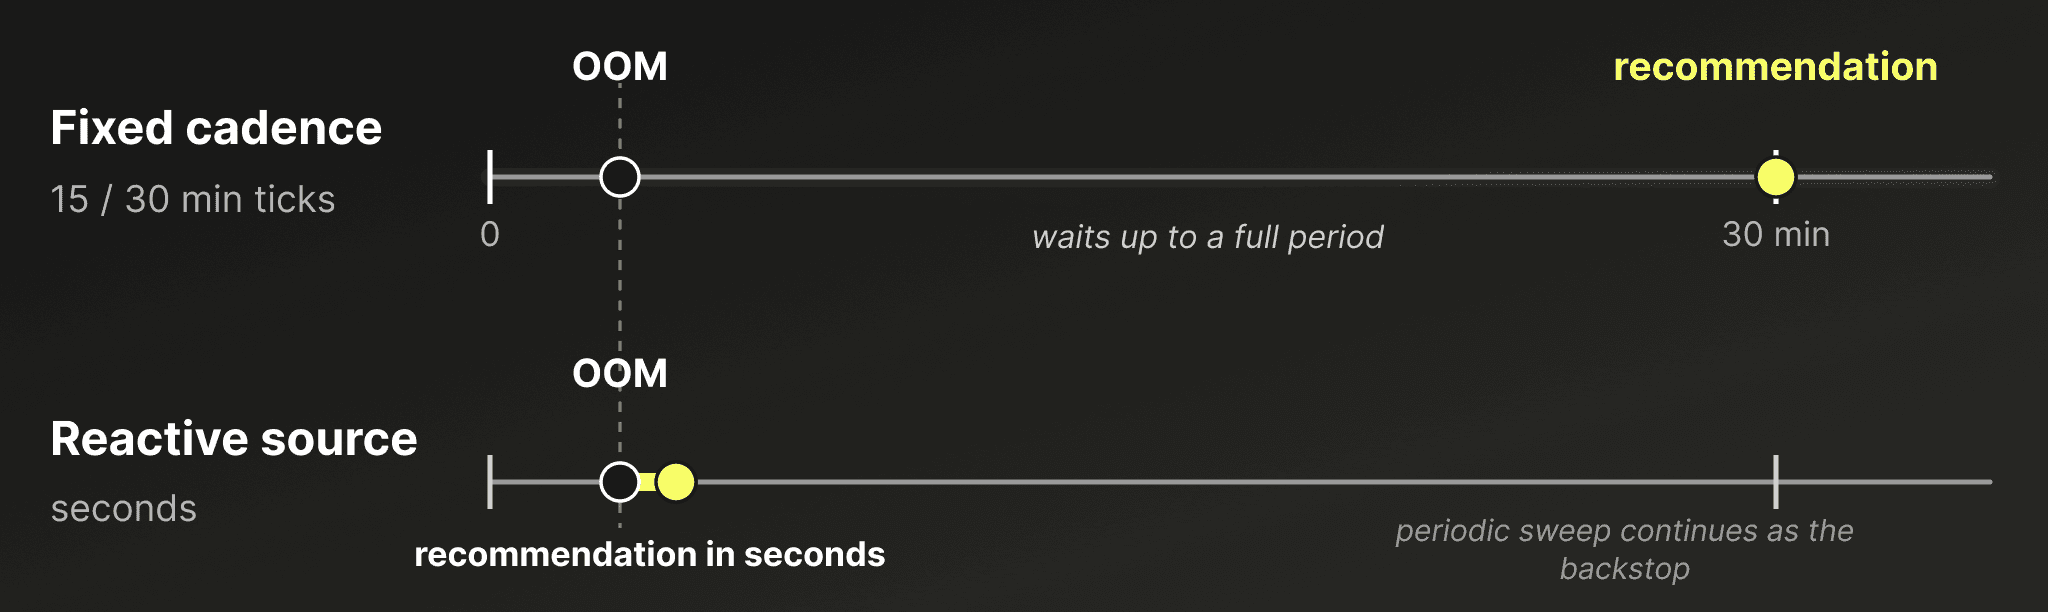
For a long time, that recommendation service did its work on a fixed schedule. It woke up on a timer, looked at every service (slotting the full list of services across the time window), produced recommendations, and went back to sleep until the next tick. That design is simple and predictable, but a fixed schedule meant that we weren't able to scale up services immediately if they needed it.
To solve this problem, we rebuilt the orchestration layer on top of a production-proven library that software engineers associate strictly with Kubernetes, controller-runtime. In doing so, we got reactivity, deduplication, backoff, and concurrency control without writing any of them ourselves. And when it came time to feed that machinery with near real-time signals, we reached for the obvious choice: ClickHouse itself.
Noticeable latency on a schedule
Think of a service that suddenly gets hit with a heavy query workload at the start of an hour. It needs more memory, but the recommender already ran a few minutes ago and is not scheduled to run again for a while. Until the next tick, the service is undersized for what it is being asked to do. Queries are slower and might even be rejected due to lack of available memory.
Autoscaling would eventually kick in and issue a recommendation addressing the resource shortage. The problem is purely latency. For the events that matter most, for example an out-of-memory event, waiting for the next scheduled pass is suboptimal.
We had two requirements for evolving our recommendation logic:
- Keep the periodic, timer-based pass, because a steady, predictable sweep over every service is a safety net you do not want to give up. Usage patterns need to be continuously verified and resources adjusted. This is especially important for scaling down, which is not something that is urgent, but something we want to still do as soon as reasonable to optimize our customers' spending on resources they no longer use.
- Add a fast path, so that when a service clearly needs attention right now, it gets a recommendation in seconds rather than waiting for the next scheduled run.
The starting point
The original recommender was a self-contained binary with a bespoke control loop. A timer fired, the loop iterated over services, and the work (combining data from different sources) happened as part of that loop. That design is sufficient for a periodic pass at creating recommendations.
But this makes adding the "fast path" hard as it wasn't part of the original design. As soon as work can arrive from more than one trigger, you inherit a list of problems that have nothing to do with autoscaling and everything to do with building a job processor:
- If the periodic pass and the fast path both decide that a service needs attention at nearly the same moment, you shouldn't process it twice.
- If producing a recommendation fails, you want to retry, but not instantly and not forever. You want to back off.
- You cannot let an unbounded number of recommendations run at once, or you risk overwhelming the systems you read metrics from.
- You need clean startup and shutdown and handover of responsibilities between old and new instances of the job process.
These aren't particularly exotic problems, in fact it is the same machinery every queue-based worker system needs. We did not want to write it, test it, and own it by building on our existing implementation. Hand-rolled versions of this machinery are where subtle production bugs tend to exist.
controller-runtime is an events engine already
ClickHouse Cloud runs on Kubernetes, and our platform code already leans heavily on controller-runtime, the library that sits underneath most third-party Kubernetes controllers and operators. If you have written an operator, you know the general process: you watch some resources and a reconcile function is called to drive the world toward the state you want.
However, underneath the Kubernetes-specific surface, controller-runtime can be used as a general-purpose event-processing engine. Without the Kubernetes-specific terminology, it boils down to:
- One or more sources produce items that need attention.
- Those items land in a rate-limited work queue.
- A reconciler pulls items off the queue, one logical item at a time, and does the work.
The work queue in controller-runtime isn't really tied to Kubernetes. It deduplicates by key, so the same item queued twice while it is still waiting is processed once. It rate-limits and applies exponential backoff, so a failing item is retried later rather than hammered immediately. It supports bounded concurrency, so you decide how many items are processed in parallel instead of hoping for the best. And it integrates with leader election and metrics that the library already provides.
Translating our previous implementation to Kubernetes language, the reconcile function answers one question for one service: given everything we know about it right now, what size should it be? Defining that function as the single, idempotent unit of work makes it clear that controller-runtime is a solid fit for this. In addition, we solve all of the problems mentioned above by using battle-tested solutions to them.
Sources are general purpose watchers
Our "triggers" are (not only) Kubernetes objects — thankfully, controller-runtime is easily extensible. In controller-runtime, a source is just something that starts putting items into a given queue. The library ships sources that watch the Kubernetes API, but nothing about the interface for a source requires that.
Breaking it down, the interface for a source consists of a single method:
type Source interface {
Start(context.Context, workqueue.TypedRateLimitingInterface[reconcile.Request]) error
}That is the whole implementation of a source: given a queue, start putting requests into it. A minimal polling source, for instance, could look like this:
// pollingSource enqueues whatever needsAttention reports, on a fixed interval.
type pollingSource struct {
interval time.Duration
needsAttention func(context.Context) ([]reconcile.Request, error)
}
func (s *pollingSource) Start(ctx context.Context, q workqueue.TypedRateLimitingInterface[reconcile.Request]) error {
go func() {
ticker := time.NewTicker(s.interval)
defer ticker.Stop()
for {
select {
case <-ctx.Done():
return
case <-ticker.C:
reqs, err := s.needsAttention(ctx)
if err != nil {
continue
}
for _, req := range reqs {
q.Add(req) // dedup, backoff and rate limiting are the queue's job
}
}
}
}()
return nil
}Both of our triggers (a periodic sweep of all services and the reactive "fast-path") are this shape. They differ only in what needsAttention actually does. That let us express both of our triggers as sources feeding one shared queue, with one shared reconciler behind it.
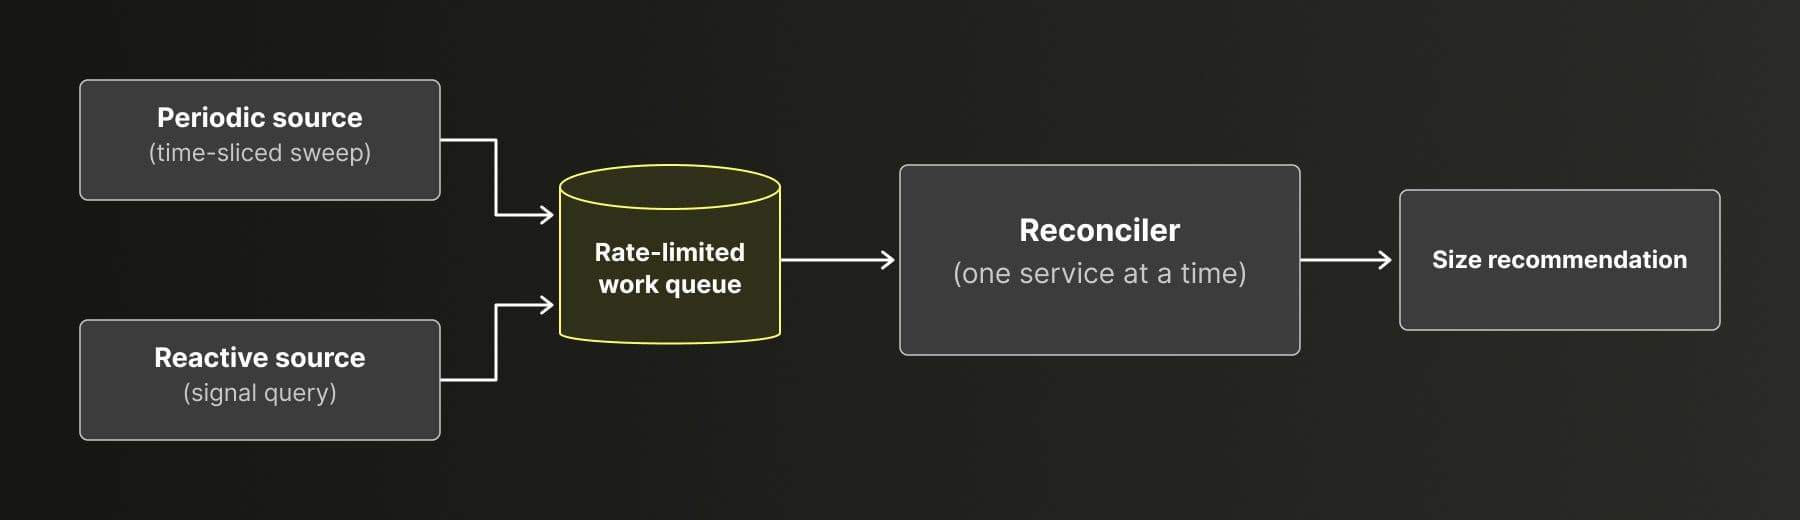
The queue in the middle is where deduplication, backoff, and bounded concurrency live, so neither source has to know the other exists.
The first source is the periodic one, the periodic recommendation loop. It is the renewed implementation of the old timer: Each service is assigned a slot deterministically and then enqueued when it's time for that particular slot, so the periodic load is smoothed out rather than a spike at the top of every cycle.
The second source is the reactive one, and it is basically why we started all of this work in the first place. It watches a stream of signals that indicate a service needs attention right now, the kinds of events described earlier. When such a signal appears, the source enqueues that service immediately. The reconciler runs within seconds, and the recommendation that used to wait for the next tick happens almost as soon as the triggering event does.
But where should that stream of signals live? We did not want to invent a bespoke message bus or bolt on yet another queue. The signals are simply rows in a ClickHouse table. As services across the fleet breach a signal threshold (such as running out of memory) those events are written as rows, each tagged with which service it belongs to and when it happened. The reactive source does nothing more than run a small query against that table on a short interval, asking a standard analytical question: which services have produced a relevant signal in the last few minutes?
The important thing is that neither of these sources is a Kubernetes watch. Both are plain triggers built on the same contract, one driven by a clock and one by a ClickHouse query. And yet, they fit well into controller-runtime.
ClickHouse reacting to ClickHouse
The system that keeps ClickHouse Cloud services right-sized is, at its reactive core, of course powered by ClickHouse.
Events stream into a table continuously from across the entire fleet. Every few seconds, the source runs a query over a short, recent time window and asks which services need attention. This is a solid example of real-time analytics: high-rate event ingestion on one side, low-latency windowed queries on the other, with the answer expected in milliseconds even as the table grows.
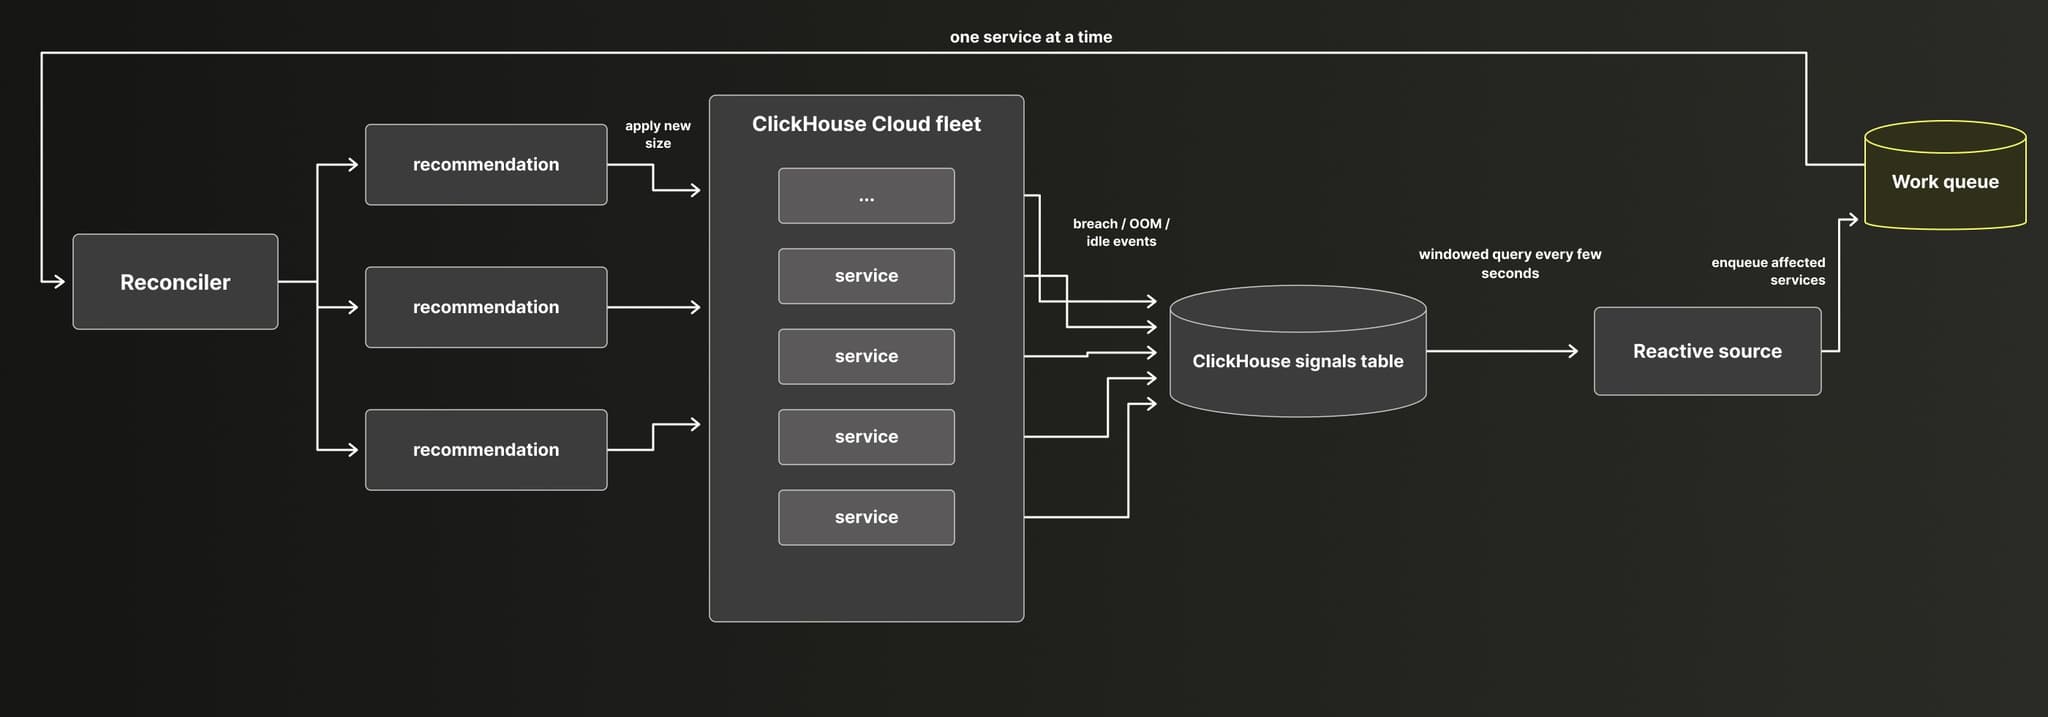
This is exactly what ClickHouse is built for, and the shape of the data leans into that. The reactive source reads from a small, purpose-built table that holds nothing but signal rows:
CREATE TABLE recommendation_signals
(
scrape_ts DateTime,
service_name LowCardinality(String),
metric_name LowCardinality(String),
metric_value Float64
)
ENGINE = SharedMergeTree
ORDER BY (scrape_ts, service_name)
TTL scrape_ts + INTERVAL 1 HOUR;There is nothing exotic here (which is the whole point, after all). The table is ordered by scrape_ts, so the only query the source ever runs is a tight time-range scan that touches roughly a single granule, and a one-hour TTL keeps it from growing unbounded.
Next is the query that the reactive source runs against this table:
SELECT DISTINCT service_name, metric_name
FROM recommendation_signals
WHERE scrape_ts > now() - INTERVAL 5 MINUTE;That five-minute window is the source's lookback, and it is the entire reactive query. Each service_name it returns becomes an item enqueued for reconciliation.
The one piece of ClickHouse finesse is how rows get into that table. We already ingest a firehose of Prometheus metrics into a much larger table, ordered for the access patterns it was built for, roughly (service_name, metric_name, scrape_ts). A fleet-wide poll that filters only on scrape_ts cannot use that primary key and would scan an entire partition on every tick. So rather than query the firehose directly, a materialized view does the filtering once, at insert time, and writes only breach rows into the small signals table:
CREATE MATERIALIZED VIEW recommendation_signals_mv
TO recommendation_signals
AS
SELECT
scrape_ts,
service_id,
metric_name,
metric_value
FROM prometheus_metrics
WHERE metric_name IN ('soft_memory_rejections') -- more signal types go here
AND metric_value > 0;The materialized view helps a lot for several reasons:
- The expensive filtering happens incrementally as data arrives, not on every poll.
- The read side stays a cheap, granule-sized scan over a table that only ever holds recent breaches.
- Adding a new kind of signal later is easy. A memory OOM, a CPU threshold, anything expressed in data fed into our pipeline is one more entry in that
INlist, with no change to the read path and none to the source. The SQL deliberately carries no recommendation logic: it decides what counts as a signal, and the source decides what to do about it.
The reactive source can afford to poll every few seconds because, by the time it asks the question in form of a query, the data is already shaped for the question.
The source only considers signals inside the recent window, so it reacts to what is happening now rather than querying a long historical time window, which is naturally expressed as a time predicate on the query. And in addition, our recommendation logic is optimized for speed and can be run several times in succession, producing deterministic results. Those two rules keep the fast path responsive without turning it into a source of noise.
The recursion is quite neat: The product is best in class for real-time analytics; the mechanism that makes the product elastic is, itself, real-time analytics. When we needed a fast, continuously updated view of which services were in trouble, the answer was the same one we give our customers: put the events in ClickHouse and query them.
Strengths of building on controller-runtime
Because both sources feed the same queue and the same reconciler, the hard parts are handled in one place, by code refined by a global community of Kubernetes practitioners. And as it is open source, we can contribute any improvements right back into it.
Deduplication is a "side effect" of migrating to controller-runtime. When the periodic source and the reactive source both decide the same service needs attention at nearly the same time, the queue collapses them into a single unit of work. We never built a coordination mechanism between the two triggers, because the queue makes it not necessary.
Backoff and retries are handled the same way. If a recommendation cannot be produced because a dependency is briefly unavailable, the item goes back into the queue with an increasing delay instead of being lost or retried in a tight loop. Bounded concurrency means we cap how many recommendations run at once, which protects the systems we read metrics from regardless of how many signals arrive in a burst.
We did not rewrite the orchestration (instead, we built on top of the existing library primitives) and we did not touch the logic that decides what size a service should be. We added a new source, wired it to the existing queue, and the reactive path inherited deduplication, backoff, concurrency limits, and metrics on day one. The next signal type we want to react to is (by virtue of following the established pattern) just another source or just an update to the existing Materialized View.
Reactivity also changes the rollout decision process in our favor. A new source can be introduced cautiously, in an observe-only mode, so we can watch what it would do before letting it actually drive scaling. Because the source is cleanly separated from the reconcile logic, that kind of staged rollout is a simple configuration switch to flip later on.
Lessons Learned
controller-runtime is a strong choice if your software already interacts with Kubernetes anyway, even if you reach beyond Kubernetes event sources.
If you have a system whose job is to process things that periodically and reactively need attention, you have what controller-runtime was built for. The reconcile pattern, an idempotent function that takes one item and drives it toward a desired state, is not Kubernetes-specific. The work queue, with its deduplication, backoff, and bounded concurrency, is a genuinely good general-purpose queue. By expressing your triggers as sources over that queue, you get a well-understood, battle-tested foundation for free, and you get to spend your own effort on the logic that is actually unique to your problem.
controller-runtime is not, however, a data pipeline, and it is worth being clear about that and its limitations. Its work queue lives in memory, inside a single process (unless you shard it). There is no durability and no replay: an item is deduplicated only while it sits in the queue, and if the manager restarts, whatever was queued is simply gone. It is a level-triggered reconcile engine, not a stream processor, so it has no notion of event-time windows, joins, or aggregation across events. Logic like "react only if an OOM and a sustained CPU breach happen within the same ten minutes" has to live in our query or our reconciler code obviously.
Our reactive source polls a table rather than subscribing to a push stream, so the poll interval is the floor on how fast it can react. If a reactive enqueue is dropped because the process restarted, nothing is permanently lost. The next source query against the events table enqueues the service again.
Obviously there are other ways to build this. Our signal volume is modest in comparison to data pipelines usually wired up to ClickHouse, recommendations are idempotent and cheap to recompute, and the periodic reconcile covers any gaps. The day a signal needs guaranteed delivery, strict ordering, or correlation across a stateful window is the day we will likely move that part of the path onto a data streaming platform built for it.
We reached for controller-runtime because we already ran it in production, our team knew it, and the reconcile model fits autoscaling quite well: idempotent work driven toward a desired state, with a periodic pass that makes the whole thing self-correcting. The learning from this was discovering how little of it was actually tied to Kubernetes.
Where we are headed
The reactive path is rolling out with a safety-first posture: the periodic sweep remains the main driver, and reactive triggers are being brought online deliberately, starting in an observe-only mode so we can validate them against the steady state before they drive real decisions. From here, the work is mostly additive. More signal types become more sources. Each one tightens the gap between what a service is provisioned for and what its workload actually demands.
Our goal from the beginning was straightforward: right-size at the speed of the workload, not at the speed of a timer. Critical events (such as OOM) will soon immediately trigger a scale-up instead of waiting on the next scheduled run of our recommendation pipeline. Same recommendations but much faster, making ClickHouse Cloud autoscaling an even better experience.
Get started today
Interested in seeing how ClickHouse works on your data? Get started with ClickHouse Cloud in minutes and receive $300 in free credits.
Sign up