This post shows how to use log clustering with Drain3 and ClickHouse UDFs to automatically structure raw application logs. By identifying log templates and extracting key fields into columns, we achieved nearly 50x compression while keeping logs queryable and fully reconstructable.
Summary
In a recent blog, we achieved over 170x log compression on a sample Nginx access log dataset. We did this by turning raw logs into structured data that can be stored efficiently in a columnar database. Each column was optimized and sorted to achieve the best possible compression
This was relatively straightforward because Nginx logs are well-defined. Each line follows a consistent pattern, which makes it easy to extract key fields and map them into a structured format.
This blog explores an approach for automating log clustering in ClickHouse to improve compression. While it's technically feasible, turning it into a production-ready feature is a different challenge, one the ClickStack team is considering for future product development.
Beyond structured logs: Application logs #
The next question was: how can we apply the same approach to any kind of application log that an observability platform ingests? While third-party systems like Nginx use predictable log formats, custom application logs are rarely consistent. They come in many shapes and often lack a predefined structure.
The challenge is to automatically detect patterns across large volumes of unstructured logs, extract meaningful information, and store it efficiently in a columnar format. Interestingly, log clustering is a strong technique for identifying such patterns at scale.
In this post, we'll explore how to use log clustering to transform unstructured logs into structured data suitable for columnar storage and how to automate the process for production use.
What is log clustering? #
Log clustering is a technique that automatically groups similar log lines based on their structure and content. The goal is to find recurring patterns in large volumes of unstructured logs without relying on predefined parsing rules.
Let's look at a concrete example. Below are a few logs from a custom application:
AddItemAsync called with userId=ea894cf4-a9b8-11f0-956c-4a218c6deb45, productId=0PUK6V6EV0, quantity=4
GetCartAsync called with userId=7f3e16e6-a9f9-11f0-956c-4a218c6deb45
AddItemAsync called with userId=a79c1e20-a9a0-11f0-956c-4a218c6deb45, productId=LS4PSXUNUM, quantity=3
GetCartAsync called with userId=9a89945c-a9f9-11f0-8bd1-ee6fbde68079
Looking at these, we can see two distinct categories of logs, each following a specific pattern.
First pattern: AddItemAsync called with userId={*}, productId={*}, quantity={*}
Second pattern: GetCartAsync called with userId={*}
Each pattern defines a cluster, and the variable parts (inside {*}) represent the dynamic fields that can be extracted as separate columns for structured storage. This technique sounds very promising for our experiment, let's see how we can implement it at scale and automate it.
Log clustering has several benefits beyond compression. It helps detect unusual patterns early and makes troubleshooting faster by grouping similar events. In this post, though, we'll focus on how it improves compression by turning repetitive logs into structured data for efficient storage.
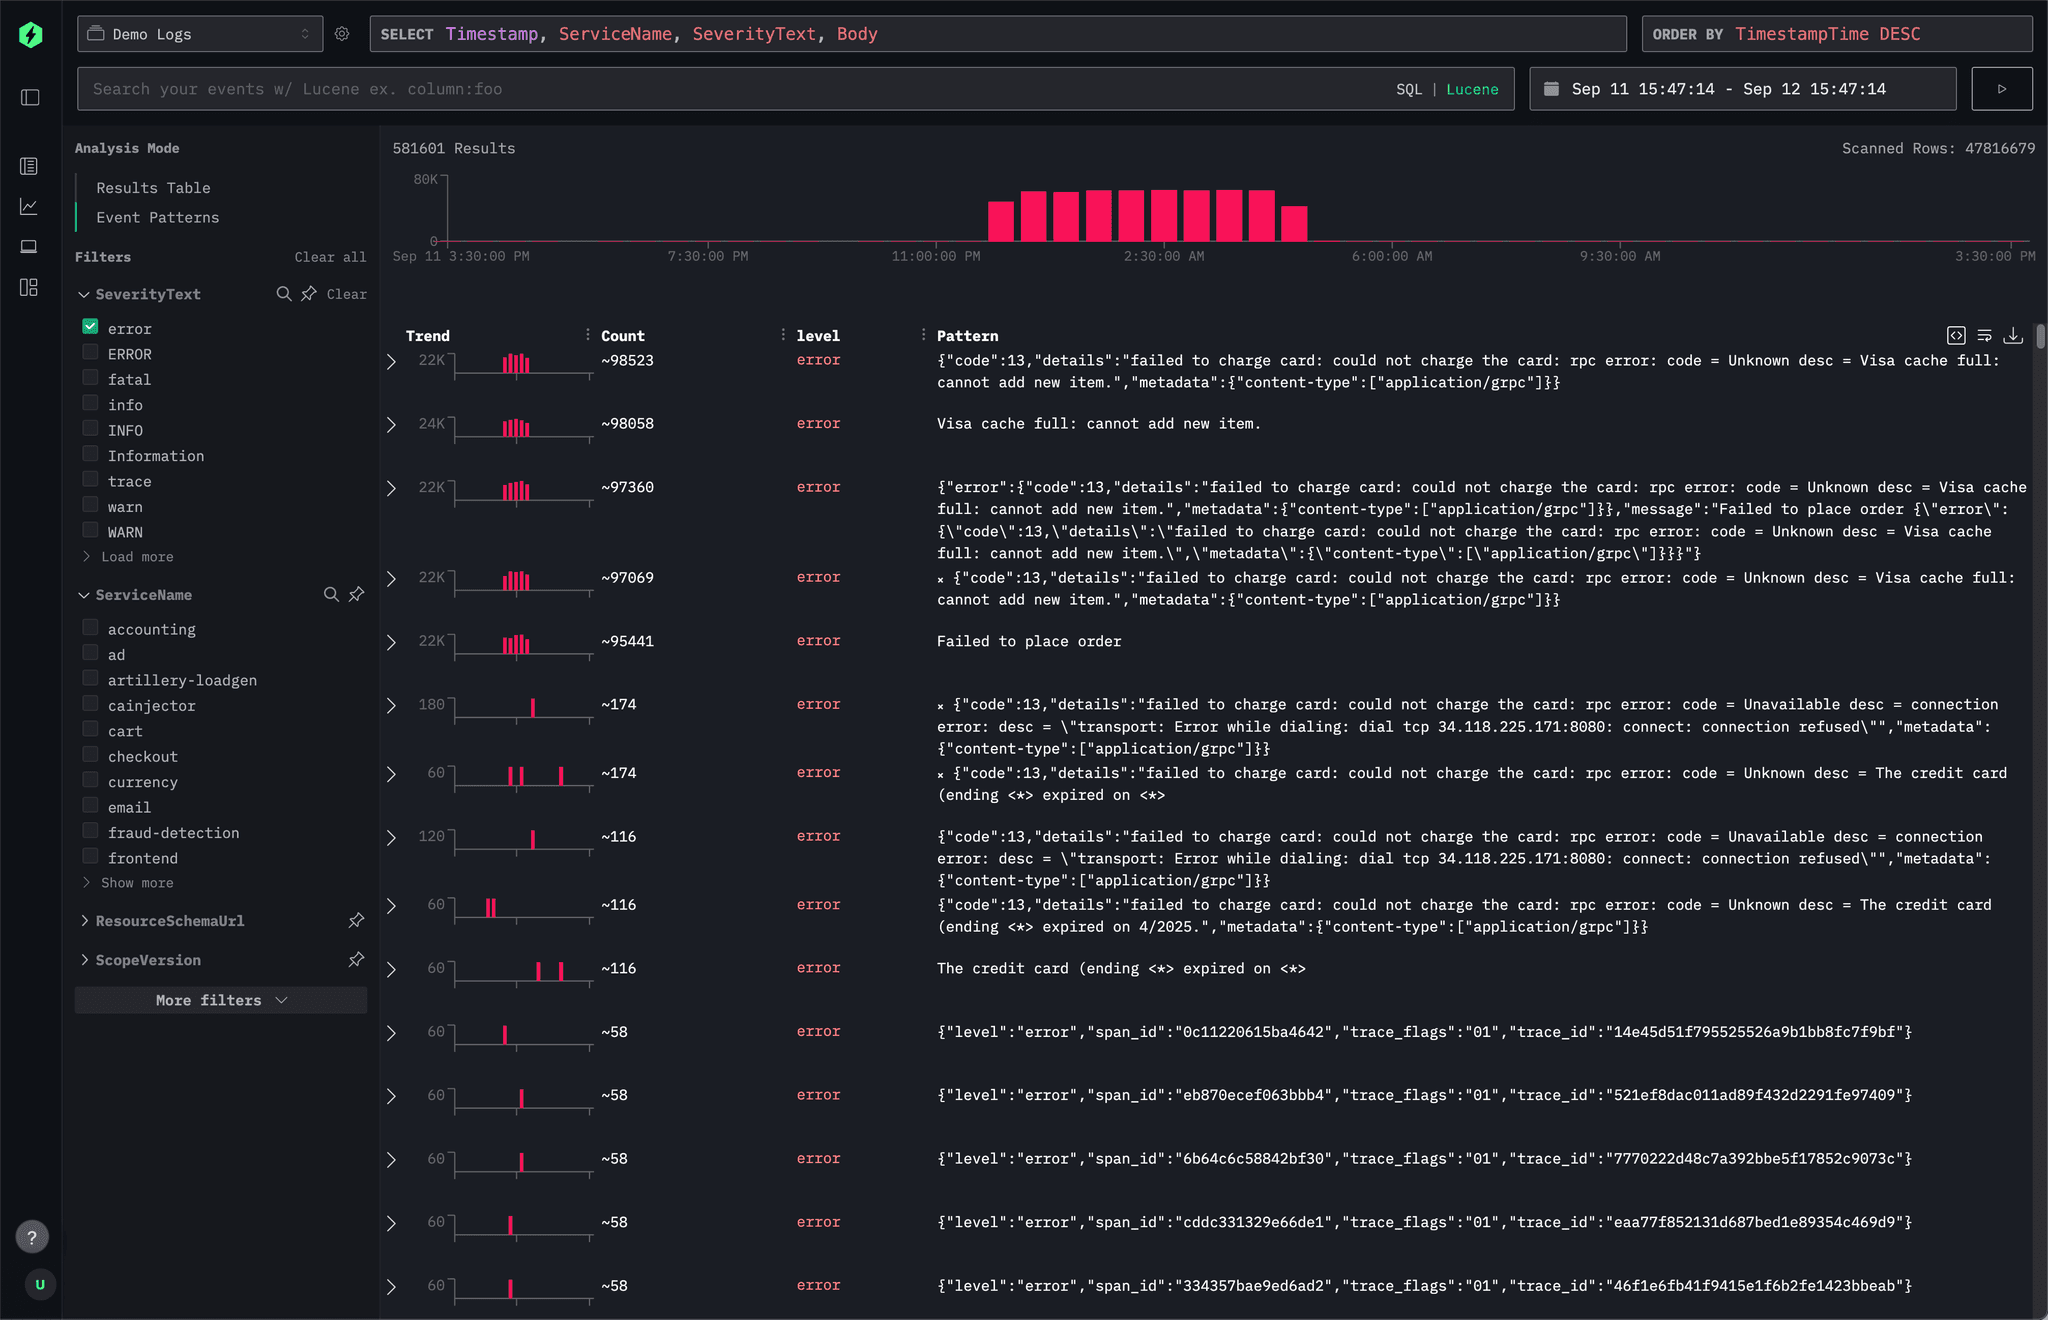
ClickStack already uses event pattern identification to help with root cause analysis. It automatically groups similar logs and tracks how these clusters change over time, making it easier to spot recurring issues and see when and where anomalies occur. This can speed up log analysis.
Below is a screenshot of event pattern identification in HyperDX.

Try ClickStack today #
Getting started with the world’s fastest and most scalable open source observability stack, just takes one command.
Mining patterns with Drain3 #
Depending on the use case, implementing log clustering can involve building a full log ingestion pipeline that performs semantic and syntactic comparisons, sentiment analysis, and pattern extraction. In our case, we're only interested in identifying patterns to structure logs efficiently for storage. Drain3, a Python package, is the perfect tool for the task. Drain3 is a streaming log template miner that can extract templates from a stream of log messages at scale. And this is the package used in ClickStack to implement event pattern identification.
You can test Drain3 locally on your machine to see how quickly it can extract log templates from a set of logs.
Let's download a log sample to use. These log lines have been produced using the OpenTelemetry demo.
wget https://datasets-documentation.s3.eu-west-3.amazonaws.com/otel_demo/logs_recommendation.sample
Then write a simple Python script to use Drain3 to mine logs from stdin.
#!/usr/bin/env python3
import sys
from collections import defaultdict
from drain3 import TemplateMiner
from drain3.template_miner_config import TemplateMinerConfig

def main():
    lines = [ln.strip() for ln in sys.stdin if ln.strip()]
    cfg = TemplateMinerConfig(); cfg.config_file = None
    miner = TemplateMiner(None, cfg)

    counts, templates, total = defaultdict(int), {}, 0
    for raw in lines:
        r = miner.add_log_message(raw)
        cid = r["cluster_id"]; total += 1
        counts[cid] += 1
        templates[cid] = r["template_mined"]

    items = [ (cnt, templates[cid]) for cid, cnt in counts.items() ]
    items.sort(key=lambda x: (-x[0], x[1]))

    for cnt, tmpl in items:
        cov = (cnt / total * 100.0) if total else 0.0
        print(f"{cov:.2f}\t{tmpl}")

if __name__ == "__main__":
    main()
Now let’s run the Python script using our log sample.
$ cat logs_recommendation.sample | python3 drain3_min.py
50.01	2025-09-15 <*> INFO [main] [recommendation_server.py:47] <*> <*> resource.service.name=recommendation trace_sampled=True] - Receive ListRecommendations for product <*> <*> <*> <*> <*>
49.99	Receive ListRecommendations for product <*> <*> <*> <*> <*>
The output indicates two log templates and the percentage of logs covered by each of them. Great, this is working locally, let's move on to implementing this on ClickHouse.
Mining logs in ClickHouse #
Running Drain3 locally is useful for testing, but ideally, we want to perform pattern identification directly in ClickHouse, where the logs already are.
ClickHouse supports running custom code, including Python code, through user-defined functions (UDFs).
The example below uses ClickHouse Server locally, but the same approach works in ClickHouse Cloud.
Deploy the UDF function #
To deploy a UDF locally, define it in an XML file (for example, /etc/clickhouse-server/drain3_miner_function.xml). The following example shows how to register a Python-based log template miner using Drain3. The function takes an array of strings (raw logs) as input and returns an array of extracted templates.
<functions>
  <function>
    <type>executable_pool</type>
    <name>drain3_miner</name>
    <return_type>Array(String)</return_type>
    <return_name>result</return_name>
    <argument>
      <type>Array(String)</type>
      <name>values</name>
    </argument>
    <format>JSONEachRow</format>
    <command>drain3_miner.py</command>
    <execute_direct>1</execute_direct>
    <pool_size>1</pool_size>
    <max_command_execution_time>100</max_command_execution_time>
    <command_read_timeout>100000</command_read_timeout>
    <send_chunk_header>false</send_chunk_header>
  </function>
</functions>
Next, copy the Python script to /var/lib/clickhouse/user_scripts/drain3_miner.py. This script is a more complete version than the earlier example and too long to include here. You can find the full source at this link.
Make sure the Drain3 Python package is installed on the ClickHouse server. It must be installed system-wide so it's available to all users. In ClickHouse Cloud, you can simply provide a requirements.txt file that lists the required dependencies.
# Install drain3 for all users
sudo pip install drain3

# Verify the clickhouse user has access to it
sudo -u clickhouse python3 -c "import drain3"
Ingest raw logs #
To illustrate our example, let’s ingest sample logs. We’ve provisioned a sample dataset that combines Nginx access logs with logs from various services running in the OpenTelemetry demo. Below are the SQL statements to ingest the logs into a simple table.
1-- Create table
2CREATE TABLE raw_logs
3(
4    `Body` String,
5    `ServiceName` String
6)
7ORDER BY tuple();
8
9-- Insert nginx access logs
10INSERT INTO raw_logs SELECT line As Body, 'nginx' as ServiceName FROM s3('https://datasets-documentation.s3.eu-west-3.amazonaws.com/http_logs/nginx-66.log.gz', 'LineAsString')
11
12-- Insert recommendation service logs
13INSERT INTO raw_logs SELECT line As Body, 'recommendation' as ServiceName FROM s3('https://datasets-documentation.s3.eu-west-3.amazonaws.com/otel_demo/logs_recommendation.log.gz', 'LineAsString')
14
15-- Insert cart service logs
16INSERT INTO raw_logs SELECT line As Body, 'cart' as ServiceName FROM s3('https://datasets-documentation.s3.eu-west-3.amazonaws.com/otel_demo/logs_cart.log.gz', 'LineAsString')
Mine log templates #
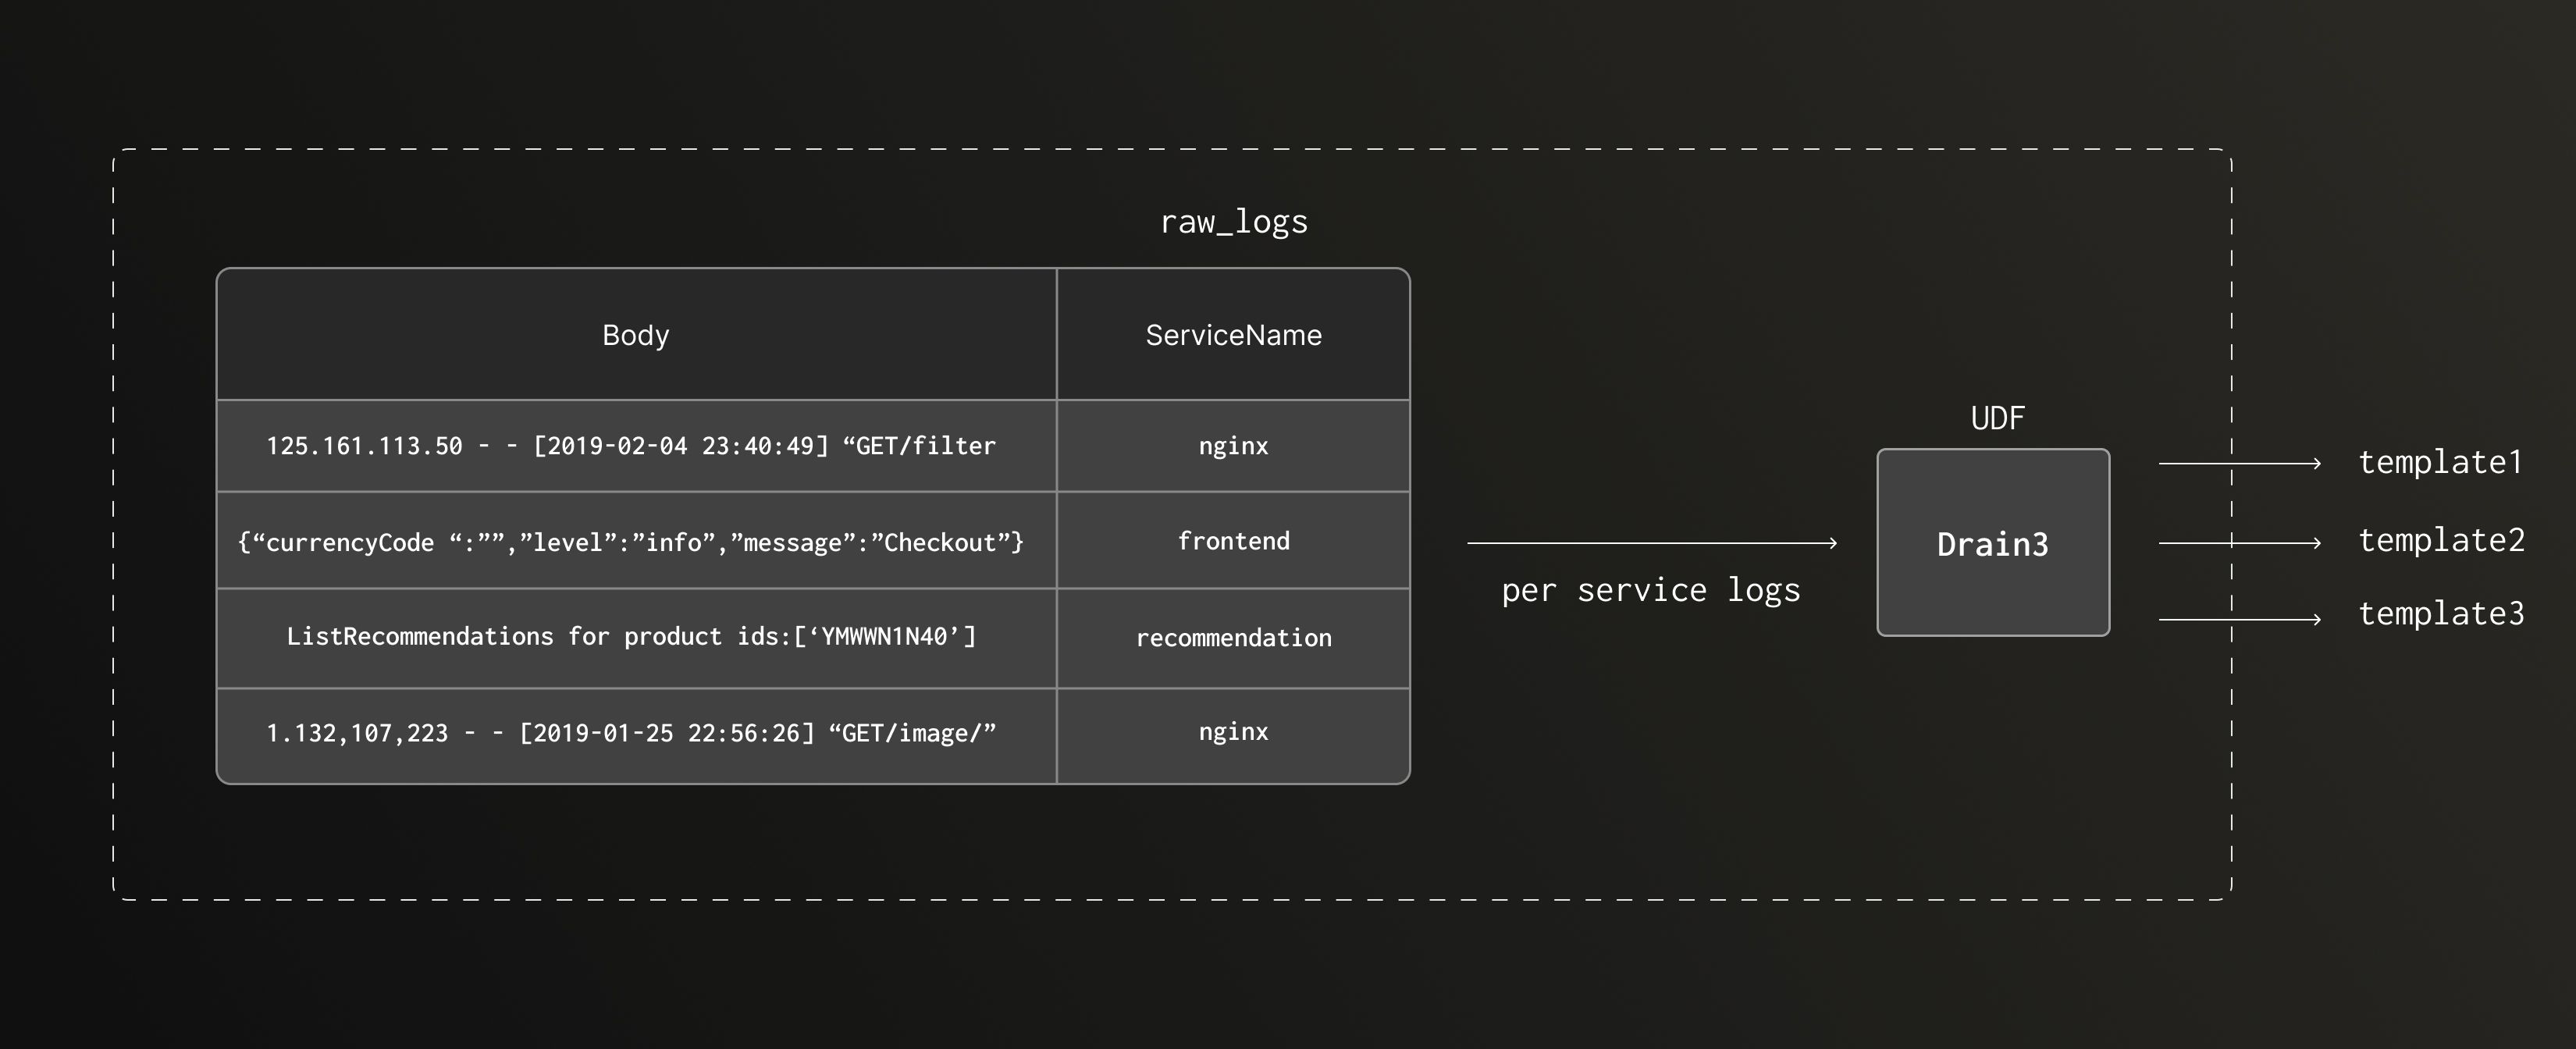
Now that the UDF is ready and the raw logs from different services are ingested into a single table, we can start experimenting. The diagram below shows a high-level overview of the pipeline.

Let’s have a look at how to execute this. Below is the SQL statement to extract a log template for the recommendation service.
1WITH drain3_miner(groupArray(Body)) AS results
2SELECT
3    JSONExtractString(arrayJoin(results), 'template') AS template,
4    JSONExtractUInt(arrayJoin(results), 'count') AS count,
5    JSONExtractFloat(arrayJoin(results), 'coverage') AS coverage
6FROM
7(
8    SELECT Body
9    FROM raw_logs
10    WHERE (ServiceName = 'recommendation') AND (randCanonical() < 0.1)
11    LIMIT 10000
12)
13FORMAT VERTICAL
Row 1:
──────
template: <*> <*> INFO [main] [recommendation_server.py:47] <*> <*> resource.service.name=recommendation trace_sampled=True] - Receive ListRecommendations for product <*> <*> <*> <*> <*>
count:    5068
coverage: 50.68

Row 2:
──────
template: Receive ListRecommendations for product <*> <*> <*> <*> <*>
count:    4931
coverage: 49.31

Row 3:
──────
template: 2025-09-27 02:00:00,319 WARNING [opentelemetry.exporter.otlp.proto.grpc.exporter] [exporter.py:328] [trace_id=0 span_id=0 resource.service.name=recommendation trace_sampled=False] - Transient error StatusCode.UNAVAILABLE encountered while exporting logs to my-hyperdx-hdx-oss-v2-otel-collector:4317, retrying in 1s.
count:    1
coverage: 0.01
We can see that we have two log templates that cover 99.99% of the log dataset for the recommendation service. Let’s use these two log templates. The long tail of logs not covered by the log templates can be retained as is.
Structure logs on the fly #
Now that we know how to identify log templates from stored logs, we can use them to automatically turn the incoming raw logs into structured data and store them more efficiently.
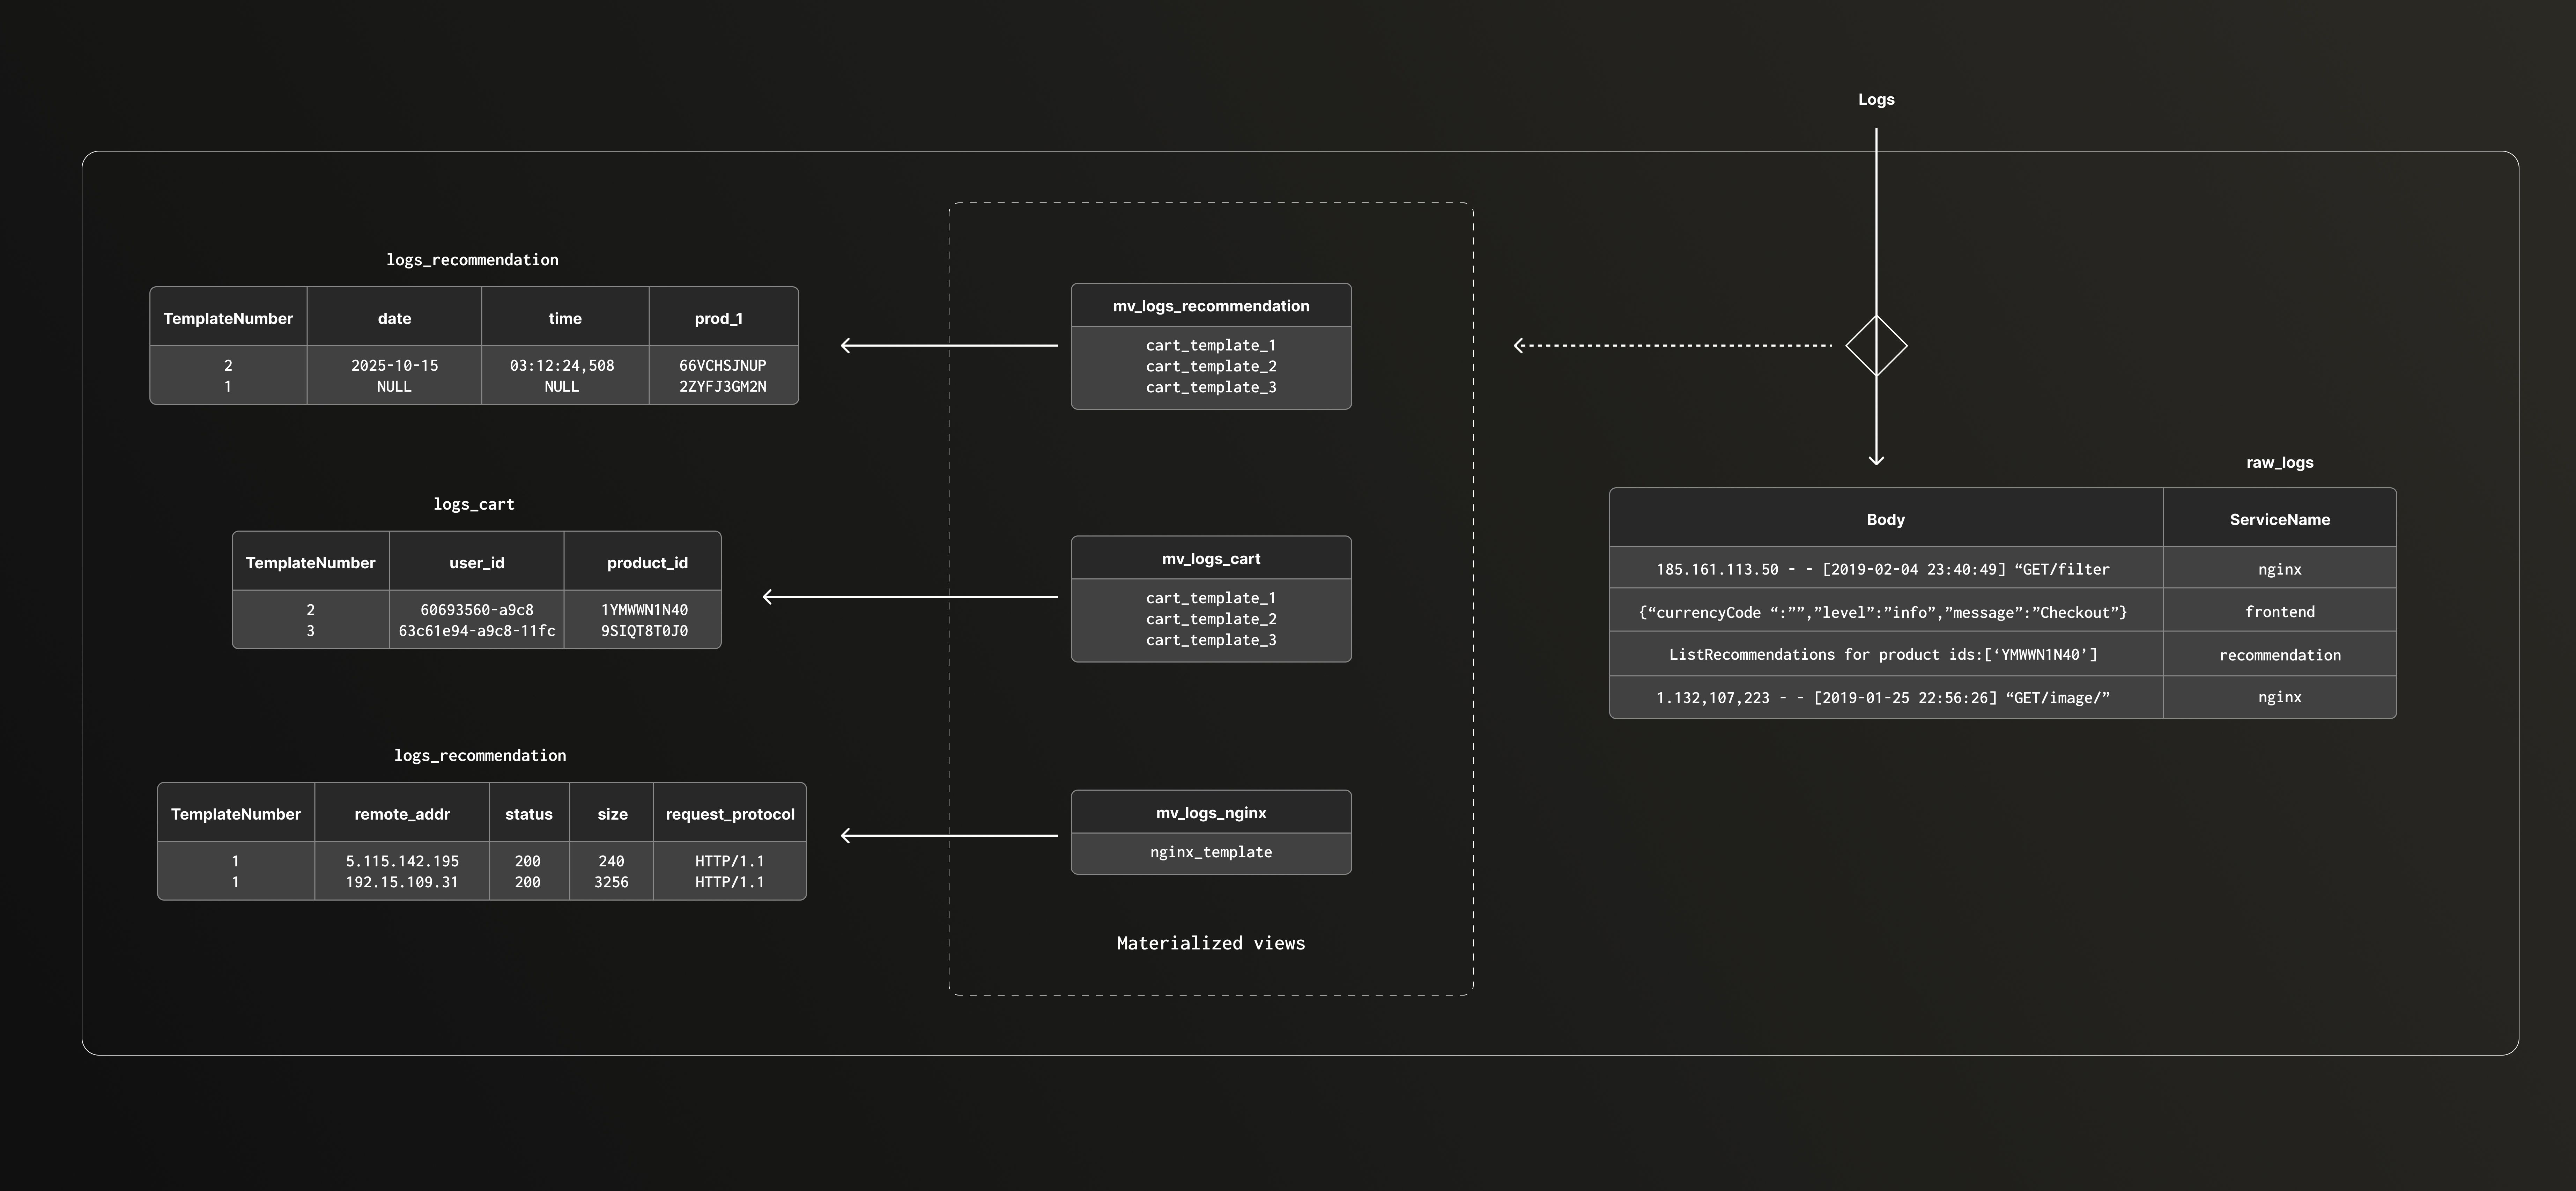
Below is a high level overview of the ingest pipeline that we use to achieve this at scale.

Apply log templates #
We define a Materialized view that runs automatically whenever new logs are ingested into the raw table. This MV uses the previously identified log templates to extract value groups from each log and store them in separate fields. In this example, all the structured logs are written in the same table, with extracted values kept in a Map(K,V).
Before we can create the view, let's create the target table, logs_structured.
1CREATE TABLE logs_structured
2(
3    `ServiceName` LowCardinality(String),
4    `TemplateNumber` UInt8,
5    `Extracted` Map(LowCardinality(String), String)
6) ORDER BY (ServiceName, TemplateNumber)
Now we can create the view. Below is a minimal version that supports only one service, for the SQL statement that covers all of them, follow this link.
1CREATE MATERIALIZED VIEW IF NOT EXISTS mv_logs_structured_min
2TO logs_structured
3AS
4SELECT
5    ServiceName,
6    /* which template matched */
7   multiIf(m1, 1, m2, 2, 0) AS TemplateNumber,
8    /* extracted fields as Map(LowCardinality(String), String) */
9    CAST(
10    multiIf(
11      m1,
12      map(
13        'date',           g1_1,
14        'time',           g1_2,
15        'service_name',   g1_3,
16        'trace_sampled',  g1_4,
17        'prod_1',         g1_5,
18        'prod_2',         g1_6,
19        'prod_3',         g1_7,
20        'prod_4',         g1_8,
21        'prod_5',         g1_9
22      ),
23      m2,
24      map(
25        'prod_1', g2_1,
26        'prod_2', g2_2,
27        'prod_3', g2_3,
28        'prod_4', g2_4,
29        'prod_5', g2_5
30      ),
31      map()                   -- else: empty map
32    ),
33    'Map(LowCardinality(String), String)'
34  ) AS Extracted
35FROM
36(
37    /* compute once per row */
38    WITH
39        '^([^\\s]+) ([^\\s]+) INFO \[main\] \[recommendation_server.py:47\] \[trace_id=([^\\s]+) span_id=([^\\s]+) resource\.service\.name=recommendation trace_sampled=True\] - Receive ListRecommendations for product ids:\[([^\\s]+) ([^\\s]+) ([^\\s]+) ([^\\s]+) ([^\\s]+)\]$' AS pattern1,
40        '^Receive ListRecommendations for product ([^\\s]+) ([^\\s]+) ([^\\s]+) ([^\\s]+) ([^\\s]+)$' AS pattern2
41
42    SELECT
43        *,
44        match(Body, pattern1) AS m1,
45        match(Body, pattern2) AS m2,
46
47        extractAllGroups(Body, pattern1) AS g1,
48        extractAllGroups(Body, pattern2) AS g2,
49
50        /* pick first (and only) match’s capture groups */
51        arrayElement(arrayElement(g1, 1), 1) AS g1_1,
52        arrayElement(arrayElement(g1, 1), 2) AS g1_2,
53        arrayElement(arrayElement(g1, 1), 3) AS g1_3,
54        arrayElement(arrayElement(g1, 1), 4) AS g1_4,
55        arrayElement(arrayElement(g1, 1), 5) AS g1_5,
56        arrayElement(arrayElement(g1, 1), 6) AS g1_6,
57        arrayElement(arrayElement(g1, 1), 7) AS g1_7,
58        arrayElement(arrayElement(g1, 1), 7) AS g1_8,
59        arrayElement(arrayElement(g1, 1), 7) AS g1_9,
60
61        arrayElement(arrayElement(g2, 1), 1) AS g2_1,
62        arrayElement(arrayElement(g2, 1), 2) AS g2_2,
63        arrayElement(arrayElement(g2, 1), 3) AS g2_3,
64        arrayElement(arrayElement(g2, 1), 4) AS g2_4,
65        arrayElement(arrayElement(g2, 1), 5) AS g2_5
66
67    FROM raw_logs where ServiceName='recommendation'
68) WHERE m1 OR m2;
In the full version, this approach may not scale efficiently because every pattern is evaluated against all logs, even when no match is possible. Later, we’ll look at an optimized approach that helps with this.
We reingest the data to the raw_logs table to execute the materialized view.
1CREATE TABLE raw_logs_tmp as raw_logs
2EXCHANGE TABLES raw_logs AND raw_logs_tmp
3INSERT INTO raw_logs SELECT * FROM raw_logs_tmp
Using the complete materialized view, we can see the result in our logs_structured table. For each service, we managed to parse most of the logs. The logs with TemplateNumber=0 are the ones that could not be parsed. These could be processed separately.
1SELECT
2    ServiceName,
3    TemplateNumber,
4    count()
5FROM logs_structured
6GROUP BY
7    ServiceName,
8    TemplateNumber
9ORDER BY
10    ServiceName ASC,
11    TemplateNumber ASC
┌─ServiceName────┬─TemplateNumber─┬──count()─┐
│ cart           │              0 │    66162 │
│ cart           │              3 │ 76793139 │
│ cart           │              4 │ 61116119 │
│ cart           │              5 │ 41877952 │
│ cart           │              6 │  1738375 │
│ nginx          │              0 │       16 │
│ nginx          │              7 │ 66747274 │
│ recommendation │              0 │     5794 │
│ recommendation │              1 │ 10537999 │
│ recommendation │              2 │ 10565640 │   └────────────────┴────────────────┴──────────┘
Reconstruct raw log at query time #
We managed to extract the significant value from our logs in an automated way, but we lost the raw message in the process. This is not great. Luckily, ClickHouse supports a feature called ALIAS, which will be very useful here.
An alias column defines an expression that's evaluated only when queried. It doesn't store any data on disk; instead, its value is computed at query time.
Let's have a look at how we can leverage this feature to reconstruct the original log message at query time, using the same log template we used for parsing them.
We can add the Alias column to our existing logs_structured table.
1ALTER TABLE logs_structured
2ADD COLUMN  Body String ALIAS multiIf(
3        TemplateNumber=1,
4        format('{0} {1} INFO [main] [recommendation_server.py:47] resource.service.name={2} trace_sampled={3}] - Receive ListRecommendations for product {4} {5} {6} {7} {8}',Extracted['date'],Extracted['time'],Extracted['service_name'],Extracted['trace_sampled'],Extracted['prod_1'],Extracted['prod_2'],Extracted['prod_3'],Extracted['prod_4'],Extracted['prod_5']),
5        TemplateNumber=2,
6        format('Receive ListRecommendations for product {0} {1} {2} {3} {4}',Extracted['prod_1'],Extracted['prod_2'],Extracted['prod_3'],Extracted['prod_4'],Extracted['prod_5']),
7        TemplateNumber=3,
8        format('GetCartAsync called with userId={0}',Extracted['user_id']),
9        TemplateNumber=4,
10        'info: cart.cartstore.ValkeyCartStore[0]',
11        TemplateNumber=5,
12        format('AddItemAsync called with userId={0}, productId={1}, quantity={2}', Extracted['user_id'], Extracted['product_id'], Extracted['quantity']),
13        TemplateNumber=6,
14        format('EmptyCartAsync called with userId={0}',Extracted['user_id']),
15        TemplateNumber=7,
16        format('{0} - {1} [{2}] "{3} {4} {5}" {6} {7} "{8}" "{9}"', Extracted['remote_addr'], Extracted['remote_user'], Extracted['time_local'], Extracted['request_type'], Extracted['request_path'], Extracted['request_protocol'], Extracted['status'], Extracted['size'], Extracted['referer'], Extracted['user_agent']),
17        '')
Now, we can query our logs as we did originally to obtain a similar result.
1SELECT Body
2FROM logs_structured
3WHERE ServiceName = 'nginx'
4LIMIT 1
5FORMAT vertical
Row 1:
──────
Body: 66.249.66.92 - - [2019-02-10 03:10:02] "GET /static/images/amp/third-party/footer-mobile.png HTTP/1.1" 200 62894 "-" "Googlebot-Image/1.0"
And compare this to the raw logs.
1SELECT Body
2FROM raw_logs
3WHERE Body = '66.249.66.92 - - [2019-02-10 03:10:02] "GET /static/images/amp/third-party/footer-mobile.png HTTP/1.1" 200 62894 "-" "Googlebot-Image/1.0"'
4LIMIT 1
5FORMAT vertical
Row 1:
──────
Body: 66.249.66.92 - - [2019-02-10 03:10:02] "GET /static/images/amp/third-party/footer-mobile.png HTTP/1.1" 200 62894 "-" "Googlebot-Image/1.0"
Compression result #
We’ve completed the end-to-end process: raw logs were transformed into structured data, and we can now reconstruct the original log transparently. Now the question is, what’s the impact on compression?
Let’s have a look at the tables logs_structured and raw_logs to understand the impact of our work.
A very small portion of logs (around 0.03%) weren’t parsed in this example, so we can consider this to have no meaningful effect on the compression results.
1SELECT
2    `table`,
3    formatReadableSize(sum(data_compressed_bytes)) AS compressed_size,
4    formatReadableSize(sum(data_uncompressed_bytes)) AS uncompressed_size
5FROM system.parts
6WHERE ((`table` = 'raw_logs') OR (`table` = 'logs_structured')) AND active
7GROUP BY `table`
8FORMAT VERTICAL
Row 1:
──────
table:             raw_logs
compressed_size:   2.00 GiB
uncompressed_size: 37.67 GiB

Row 2:
──────
table:             logs_structured
compressed_size:   1.71 GiB
uncompressed_size: 29.95 GiB
Well, this is underwhelming, while we managed to store the data in a columnar format the gain in compression is minimal. Let’s run the numbers.
Uncompressed original size: 37.67 GiB
Compressed size on raw logs: 2.00 GiB - (18x compression ratio)
Compressed size on structured logs: 1.71 GiB - (22x compression ratio)
We achieved a 3x compression gain, not exactly what we're aiming for, but not completely surprising. As shown in the previous blog, the largest compression gain comes from picking the right data type for the log fields and sorting the data efficiently.
One table per service #
Let's push the experiment and apply what we learned previously here.To do this, we need to store the parsed logs in separate tables, one per service, so we can customize data types and the sorting key by service.
The process is similar to storing all structured logs in a single table, except we split it into one table and one materialized view per service. This approach also helps with scalability since each service's logs are processed only against its own set of patterns, rather than applying every pattern to every log line.

Let’s have a look at the cart service table and materialized view.
1-- Create table for cart service logs
2CREATE TABLE logs_service_cart
3(
4    TemplateNumber UInt8,
5    `user_id` Nullable(UUID),
6    `product_id` String,
7    `quantity` String,
8    Body ALIAS multiIf(
9        TemplateNumber=1, format('GetCartAsync called with userId={0}',user_id),
10        TemplateNumber=2, 'info: cart.cartstore.ValkeyCartStore[0]',
11        TemplateNumber=3, format('AddItemAsync called with userId={0}, productId={1}, quantity={2}', user_id, product_id, quantity),
12        TemplateNumber=4, format('EmptyCartAsync called with userId={0}',user_id),
13        '')
14)
15ORDER BY (TemplateNumber, product_id, quantity)
16
17
18-- Create materialized view for cart service logs
19CREATE MATERIALIZED VIEW IF NOT EXISTS mv_logs_cart
20TO logs_service_cart
21AS
22SELECT
23   multiIf(m1, 1, m2, 2, m3, 3, 0) AS TemplateNumber,
24   multiIf(m1, g1_1, m2, Null, m3, g3_1, m4, g4_1, Null) AS user_id,
25   multiIf(m1, '', m2, '', m3, g3_2, '') AS product_id,
26   multiIf(m1, '', m2, '', m3, g3_3, '') AS quantity
27
28FROM
29(
30    WITH
31        '^[\\s]*GetCartAsync called with userId=([^\\s]*)$' AS pattern1,
32        '^info\: cart.cartstore.ValkeyCartStore\[0\]$' AS pattern2,
33        '^[\\s]*AddItemAsync called with userId=([^\\s]+), productId=([^\\s]+), quantity=([^\\s]+)$' AS pattern3,
34        '^[\\s]*EmptyCartAsync called with userId=([^\\s]*)$' AS pattern4
35    SELECT
36        *,
37        match(Body, pattern1) AS m1,
38        match(Body, pattern2) AS m2,
39        match(Body, pattern3) AS m3,
40        match(Body, pattern4) AS m4,
41        extractAllGroups(Body, pattern1) AS g1,
42        extractAllGroups(Body, pattern2) AS g2,
43        extractAllGroups(Body, pattern3) AS g3,
44        extractAllGroups(Body, pattern4) AS g4,
45
46        arrayElement(arrayElement(g1, 1), 1) AS g1_1,
47        arrayElement(arrayElement(g3, 1), 1) AS g3_1,
48        arrayElement(arrayElement(g3, 1), 2) AS g3_2,
49        arrayElement(arrayElement(g3, 1), 3) AS g3_3,
50        arrayElement(arrayElement(g4, 1), 1) AS g4_1
51    FROM raw_logs where ServiceName='cart'
52);
Now we can customize the data type and order key for the type of logs stored in this table. For services with multiple log templates, the first column in the sorting key is always the template number. This groups similar logs together, which improves compression efficiency.
You can find in this link the complete instructions to build one table per service and their associated materialized views.
Once all the structured logs are stored in their respective tables, we can check the compression ratio again.
1WITH (
2        SELECT sum(data_uncompressed_bytes)
3        FROM system.parts
4        WHERE (`table` = 'raw_logs') AND active
5    ) AS raw_uncompressed
6SELECT
7    label AS `table`,
8    formatReadableSize(sum(data_uncompressed_bytes)) AS uncompressed_bytes,
9    formatReadableSize(sum(data_compressed_bytes)) AS compressed_bytes,
10    sum(rows) AS nb_of_rows,
11    toUInt32(round(raw_uncompressed / sum(data_compressed_bytes))) AS compression_from_raw
12FROM
13(
14    SELECT
15        if(match(`table`, '^logs_service_'), 'logs_service_*', `table`) AS label,
16        data_uncompressed_bytes,
17        data_compressed_bytes,
18        rows
19    FROM system.parts
20    WHERE active AND ((`table` IN ('raw_logs', 'logs_structured')) OR match(`table`, '^logs_service_'))
21)
22GROUP BY label
23ORDER BY label ASC
┌─table───────────┬─uncompressed─┬─compressed─┬─nb_of_rows─┬─compression_from_raw─┐
│ logs_service_*  │ 16.58 GiB    │ 865.16 MiB │  269448454 │                   45 │
│ logs_structured │ 29.95 GiB    │ 1.71 GiB   │  269448470 │                   22 │
│ raw_logs        │ 37.71 GiB    │ 2.01 GiB   │  269448470 │                   19 │   └─────────────────┴──────────────┴────────────┴────────────┴──────────────────────┘
The ratio is much better. In this case, we can achieve up to a 45x compression ratio.
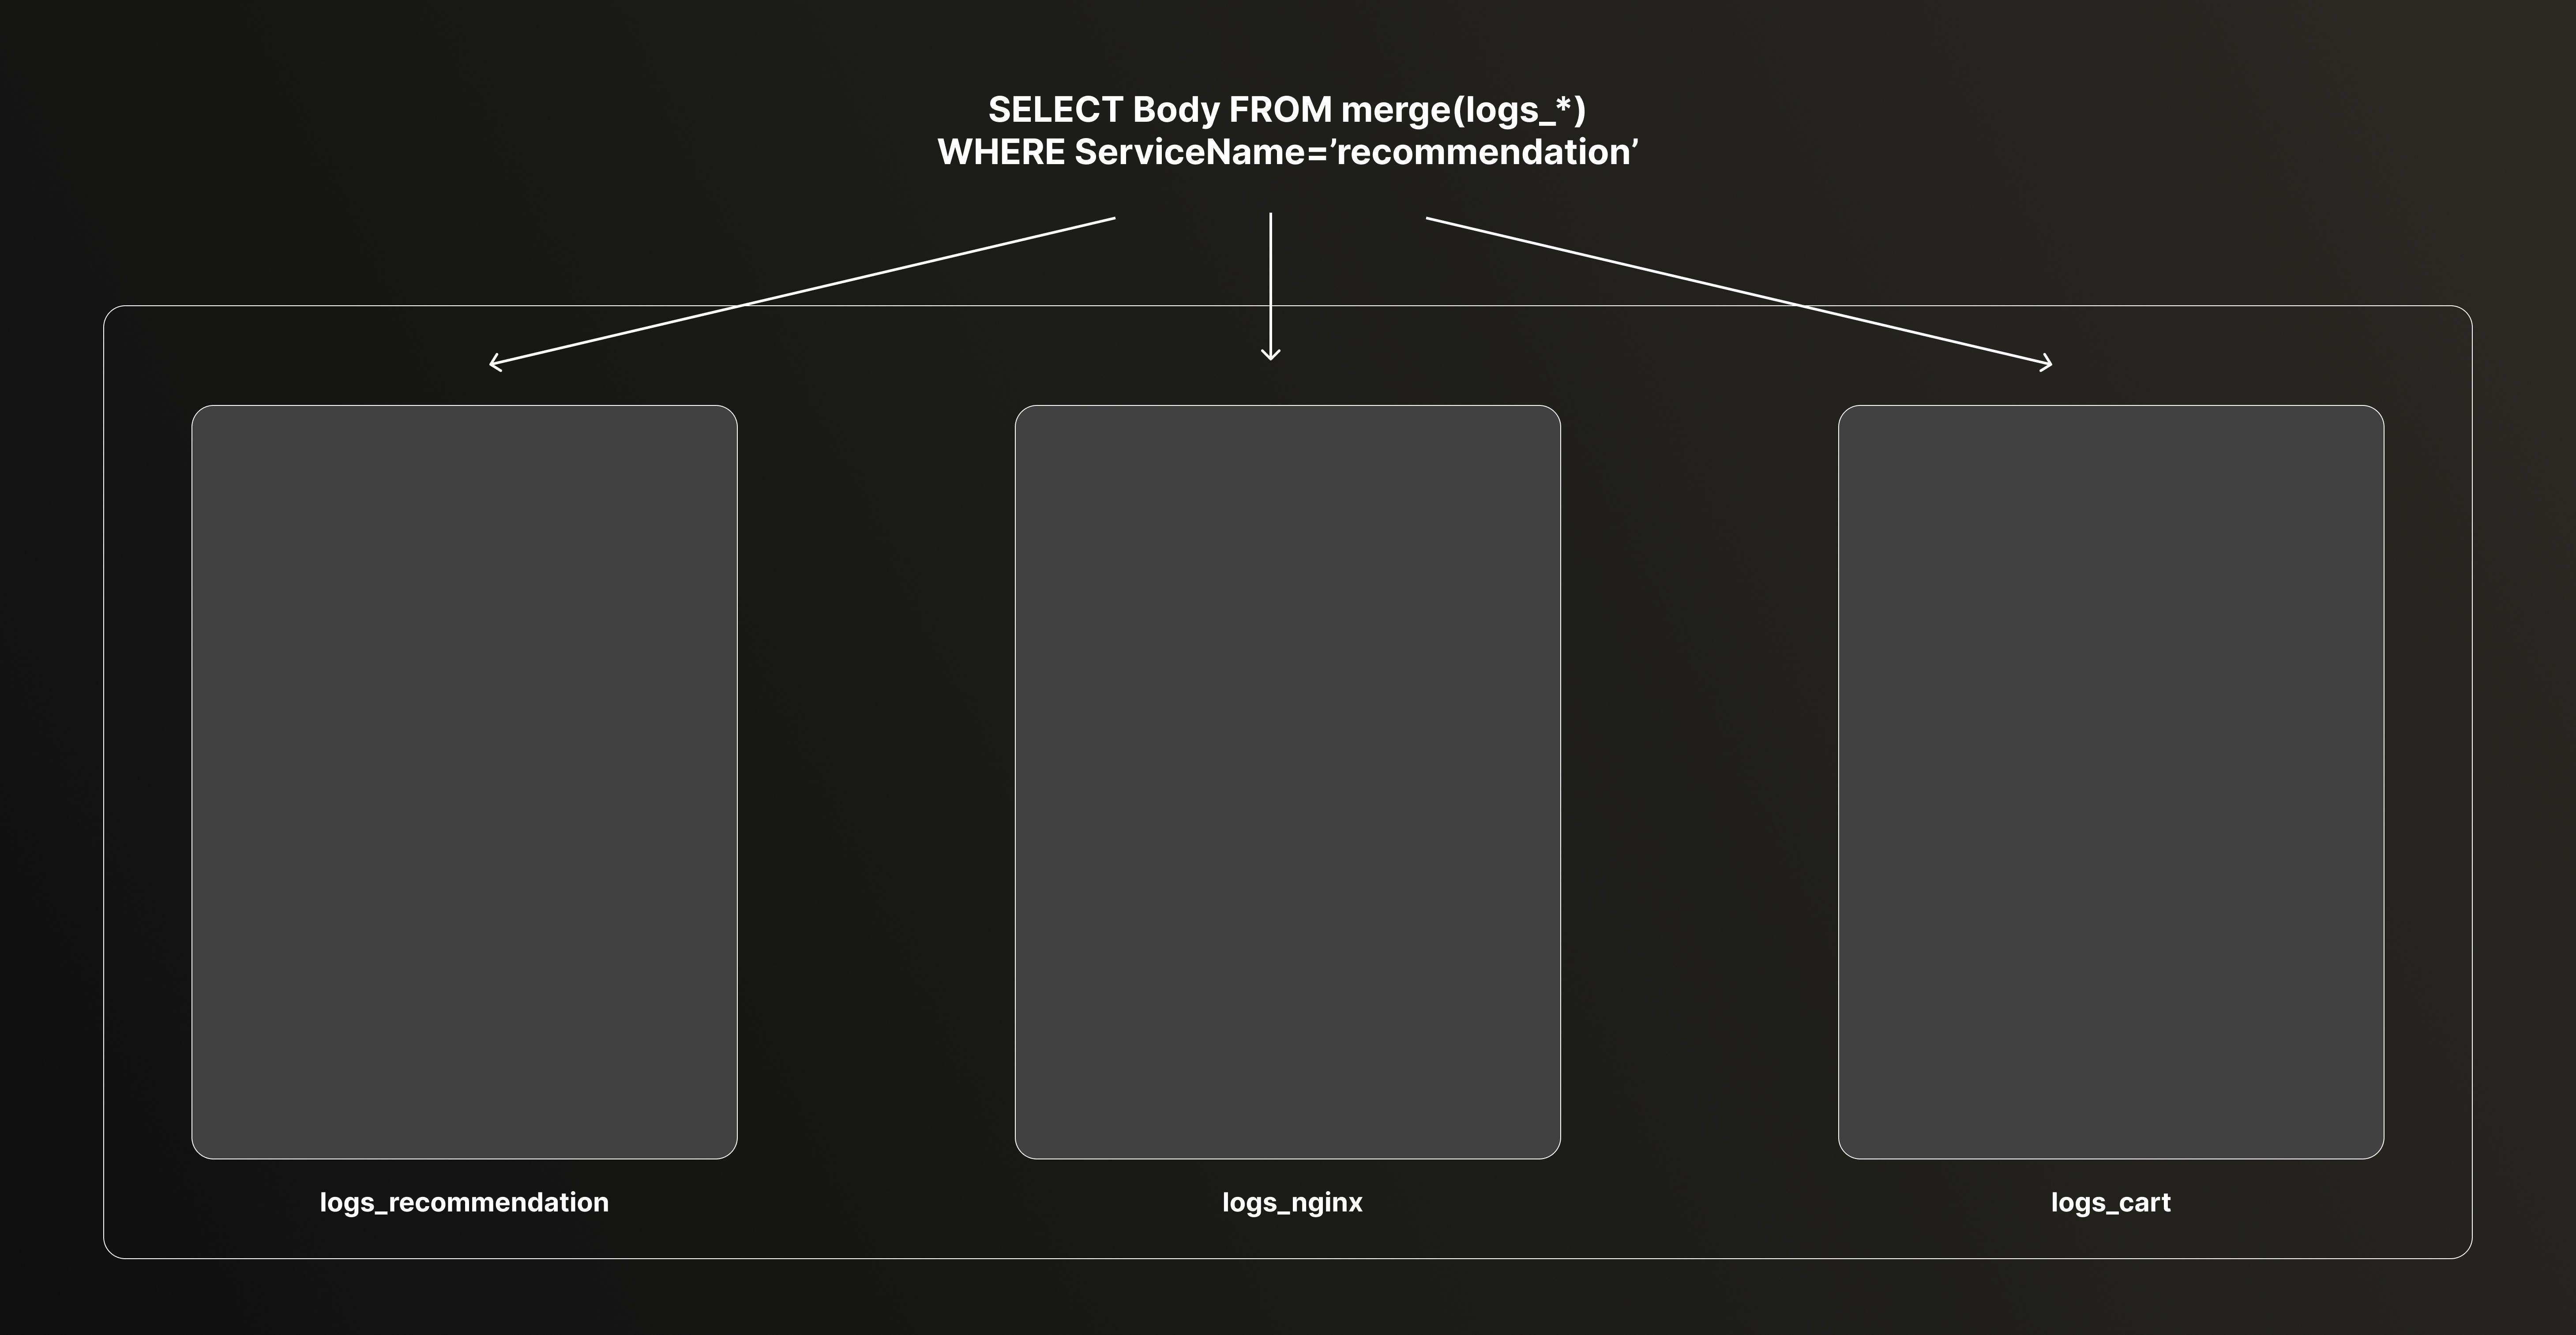
Finally, ClickHouse allows you to query the tables transparently using the merge function.

Below is the SQL statement to query the data. Each table containing their own Body column, we can retrieve the original log for any service easily.
1SELECT Body
2FROM merge(currentDatabase(), '^logs_service_')
3ORDER BY rand() ASC
4LIMIT 10
5FORMAT TSV
info: cart.cartstore.ValkeyCartStore[0]
AddItemAsync called with userId={userId}, productId={productId}, quantity={quantity}
AddItemAsync called with userId=6dd06afe-a9da-11f0-8754-96b7632aa52f, productId=L9ECAV7KIM, quantity=4
info: cart.cartstore.ValkeyCartStore[0]
GetCartAsync called with userId=c6a2e0fc-a9e5-11f0-a910-e6976c512022
info: cart.cartstore.ValkeyCartStore[0]
GetCartAsync called with userId=0745841e-a970-11f0-ae33-92666e0294bc
info: cart.cartstore.ValkeyCartStore[0]
84.47.202.242 - - [2019-02-21 05:01:17] "GET /image/32964?name=bl1189-13.jpg&wh=300x300 HTTP/1.1" 200 8914 "https://www.zanbil.ir/product/32964/63521/%D9%85%D8%AE%D9%84%D9%88%D8%B7-%DA%A9%D9%86-%D9%85%DB%8C%D8%AF%DB%8C%D8%A7-%D9%85%D8%AF%D9%84-BL1189" "Mozilla/5.0 (Windows NT 6.1; WOW64; rv:64.0) Gecko/20100101 Firefox/64.0"
GetCartAsync called with userId={userId}
Conclusion #
Using log clustering to automatically turn raw logs into structured data helps improve compression, even if it can't match the 178x compression ratio we reached with Nginx logs in the previous post. Achieving similar results on application logs is harder because their structure is far less consistent.
Still, reaching nearly 50x compression without losing precision while gaining more query flexibility by extracting key fields into columns is an interesting outcome. It shows that structuring logs can significantly speed up queries while keeping the data intact.
Drain3 is an effective tool for identifying log templates automatically. Running it directly in ClickHouse using UDFs lets us build a fully automated pipeline, from log ingestion to structured storage.
That said, this process isn't yet simple. We didn't address the long tail of unparsed logs here which could be handled separately, for example by storing them in a dedicated table to preserve visibility without affecting the structured dataset.
This work was very much exploratory, but it provides a solid foundation for automating log clustering at scale to improve compression. It could be the basis for a future component in ClickStack.


