50.5k
50.5k
At POSETTE 2026, Sai Srirampur presented "Postgres Isn’t Slow. Your Storage Is." a talk examining how storage affects PostgreSQL performance at scale. This post recaps the benchmark, what the results revealed, and the architecture proposed for running PostgreSQL on local NVMe in production. You can watch the full talk in the video linked below.
The talk starts with several symptoms teams running Postgres at scale may recognize: ingestion slows down, P95 read latency becomes unpredictable, autovacuum falls behind, checkpoints compete with your actual workload for resources, or logical replication accumulates lag. These problems do not always share the same cause, but they can have a common one that is easy to overlook: storage performance.
To understand why, Sai ran a benchmark comparing the same 3.3-billion-row PostgreSQL workload on baseline gp3 EBS and local NVMe. We will walk through the setup and what Sai discovered when analyzing the results, then close with the production patterns proposed for running Postgres on local NVMe.
Five scaling symptoms
There are five common issues that often appear once a PostgreSQL workload reaches hundreds of gigabytes or terabytes and is running with real concurrency and throughput.
-
Slow ingestion. The first one is ingestion pipelines heavy on UPDATEs and UPSERTs. Jobs that once finished in seconds can stretch into minutes as the volume of data underneath them grows.
-
Inconsistent read latency. Next one appears in workloads where most queries remain fast but a few become dramatically slower. P95 latency moves from milliseconds to seconds, dashboards time out, and the uneven slowdown makes the cause harder to isolate.
-
VACUUM falling behind. A third issue is autovacuum falling behind as UPDATE and UPSERT throughput grows, with table bloat accumulating from gigabytes into terabytes.
-
Slower checkpoints. Checkpoints can also take longer and compete with the client workload for I/O and CPU, turning an operation that used to be invisible into a recurring latency spike.
-
Logical replication lag. The last symptom appears when PostgreSQL data is streaming to systems such as Kafka or ClickHouse. WAL decoding can be slow and a growing replication slot can compound the problem.
How do these symptoms connect to storage
As the working set outgrows the memory available to PostgreSQL and the operating-system page cache, more data read require physical I/O. On slower storage, the higher cost and queuing of those reads can increase both average and tail latency.
Client queries and background maintenance also use the same storage budget. Heap and index writes, WAL synchronization, checkpoints, VACUUM, and logical-decoding spills compete for bandwidth, IOPS, and queue capacity.
Once storage reaches one of those limits, operations begin delaying one another. That is how slow storage can be the root cause of several apparently unrelated PostgreSQL problems.
What changes with local NVMe
The case for local NVMe is not that it eliminates I/O, but that it can sharply reduce its cost. The comparison contrasts millisecond-scale operations on network-attached storage with operations that may complete in tens of microseconds on local NVMe. Cache misses, WAL flushes, and maintenance I/O still happen, but they simply don’t impact the overall system as much.
The benchmark: Local NVMe vs. EBS
To better understand why this is the case, Sai set up a simple experiment to compare a similar workload on PostgreSQL running on EBS and local NVMe.
Setup
To isolate storage as the variable, the benchmark used eight identical PostgreSQL clusters: four using instance-store NVMe and four using baseline gp3 EBS provisioned at 3,000 IOPS. Each cluster ran on an m6id.4xlarge instance with 16 vCPUs, 64 GiB of RAM, and 16 GiB of shared_buffers. We used multiple instances for each storage type to normalize variability across benchmark runs.
The setup used a 482 GiB pgbench_accounts heap containing 3.3 billion rows. Each cluster then ran the same highly concurrent random-UPDATE workload for five minutes, with 64 clients and 16 worker threads:
\set aid random(1, 3300000000)
UPDATE pgbench_accounts SET abalance = abalance + 1 WHERE aid = :aid;In short, the only difference between the two groups was the storage class.
What the benchmark showed
The benchmark produced a median 16,030 TPS for the NVMe clusters, compared with 1,734 TPS on EBS—a 9.24× difference in this test. Median transaction latency fell from 36.9 ms to 4.0 ms.
For different operations, NVMe completed a VACUUM over 10 GB of bloat in 366 seconds, compared with 964 seconds on EBS, and drained a 10 GB logical-replication backlog in 139 seconds instead of 238 seconds.
One qualification matters: these results apply to this workload and these storage configurations. The EBS side used baseline gp3 provisioned at 3,000 IOPS, different EBS setup would most likely produce different results.
Explaining the gap
The throughput gap becomes easier to understand by looking at where the 37 ms of EBS transaction latency went.
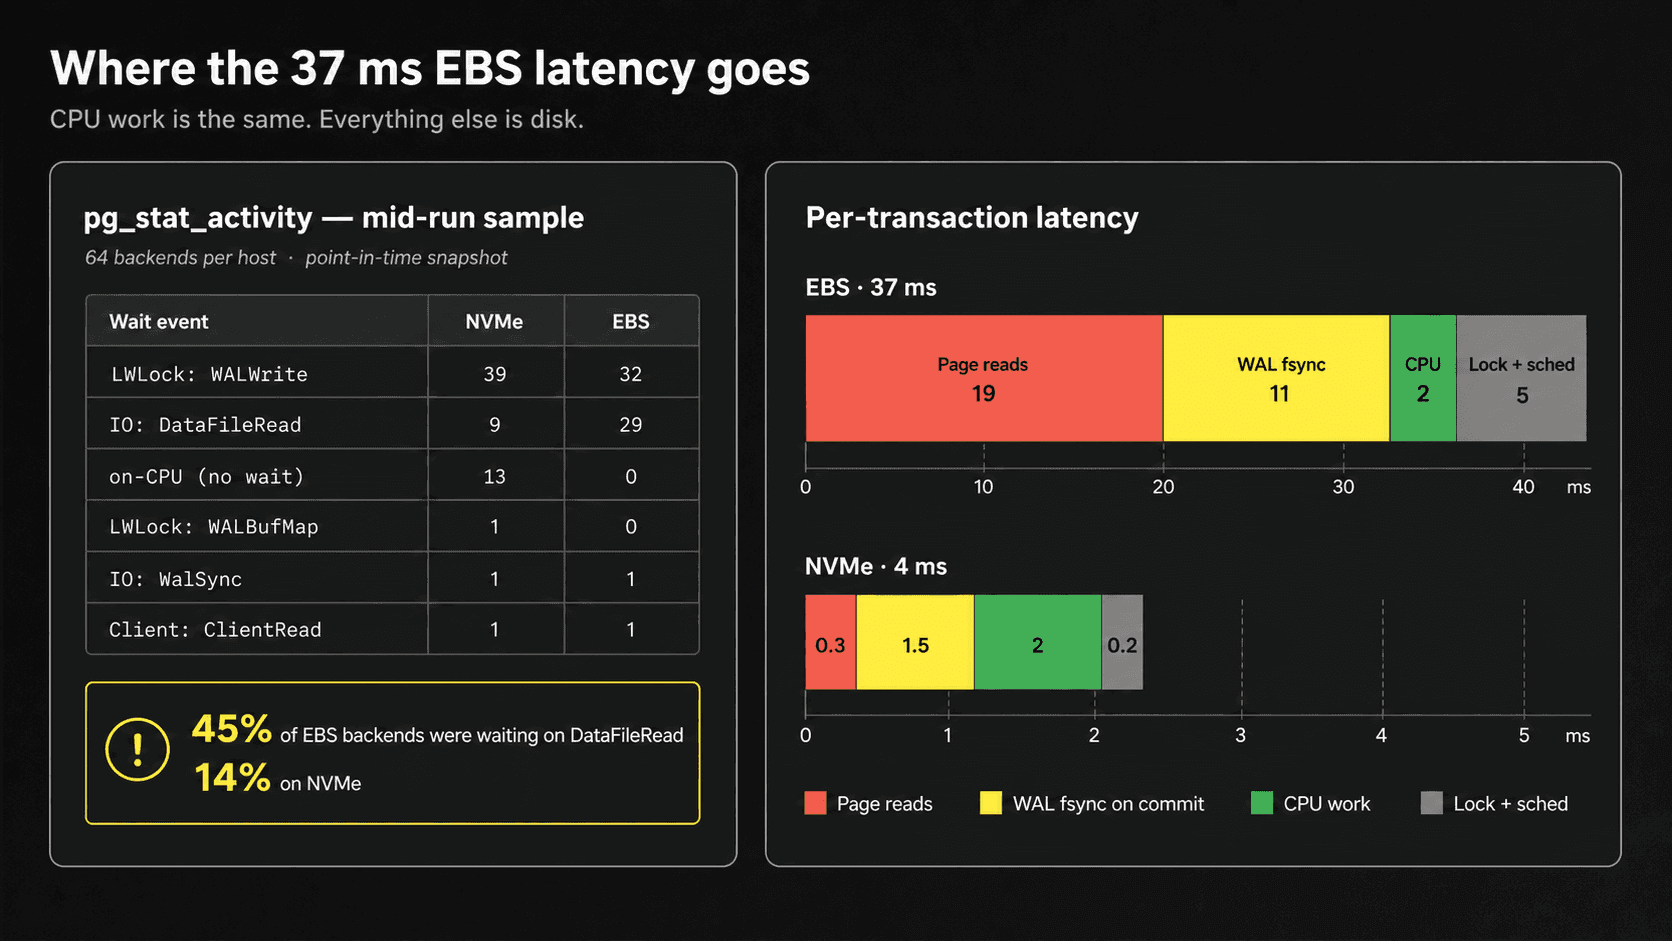
In this benchmark, page reads accounted for about 19 ms on EBS, compared with 0.3 ms on NVMe. WAL fsync at commit added another 11 ms on EBS versus 1.5 ms on NVMe, while lock and scheduler overhead contributed about 5 ms versus 0.2 ms. CPU work itself was roughly the same—about 2 ms in both cases.
In other words, most of the additional EBS latency came from waiting on storage, not from PostgreSQL doing more CPU work.
A mid-run pg_stat_activity snapshot showed the same pattern from another angle. Of the 64 backends, 29 on EBS were waiting on IO:DataFileRead, compared with nine on NVMe—roughly 45% versus 14%. This was a point-in-time snapshot rather than an average across the run, but it illustrates how many more EBS sessions were stalled on reads at that moment.
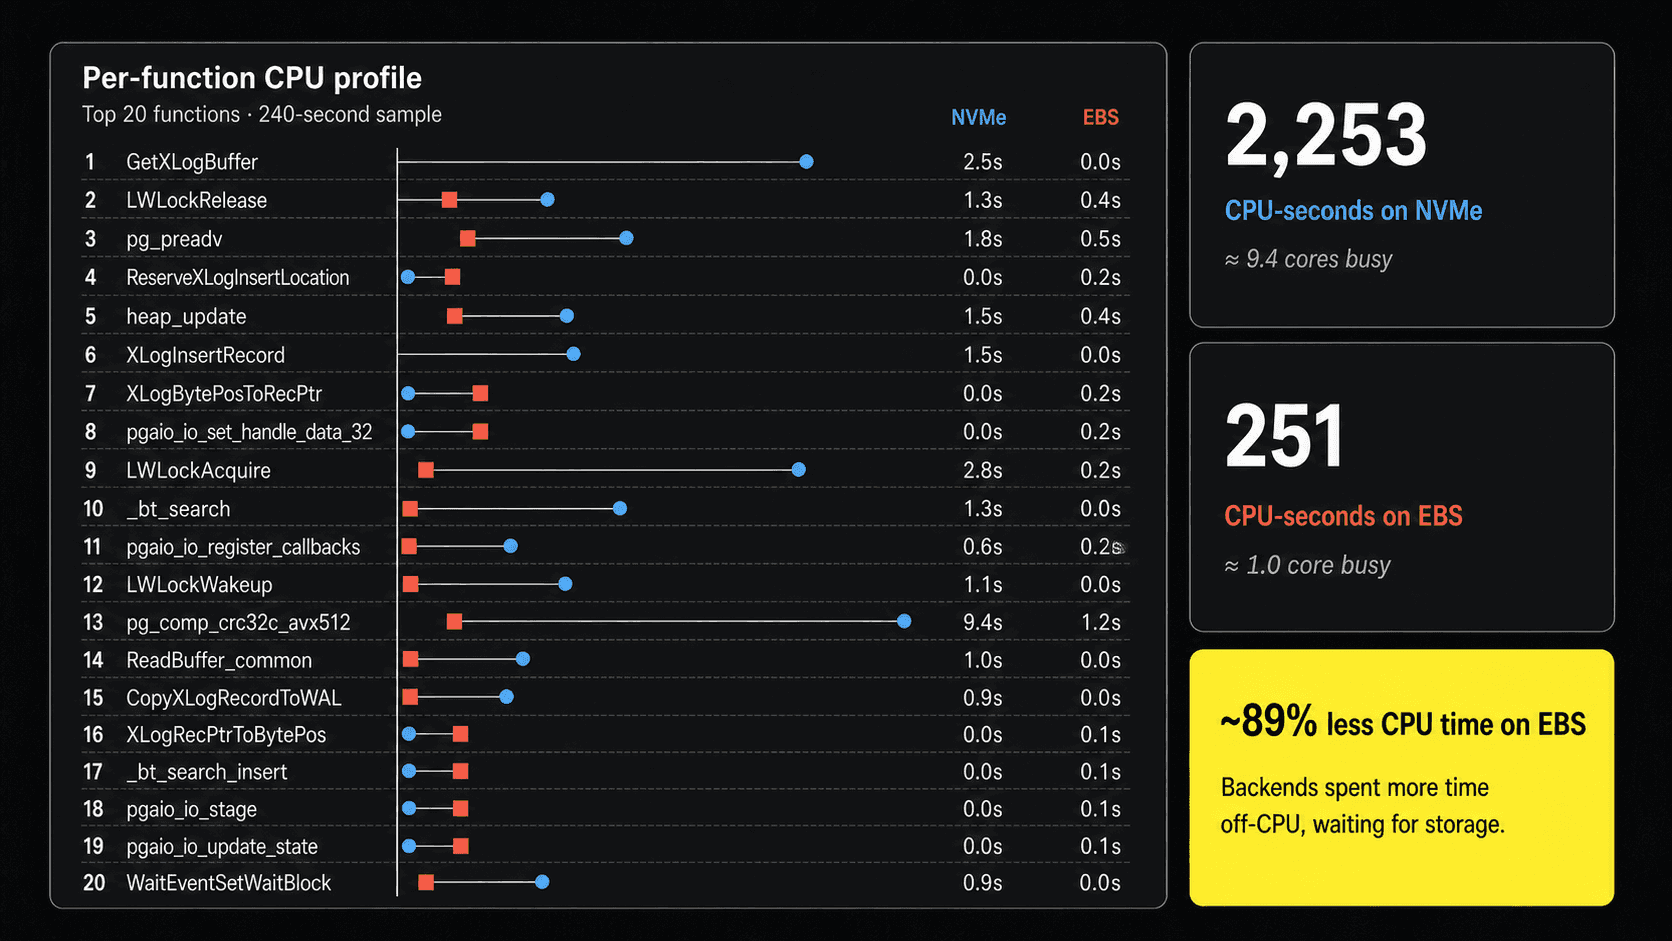
The CPU profile then adds a counterintuitive observation. Over a profiling window of roughly 240 seconds, the NVMe host accumulated 2,253 CPU-seconds—about 9.4 cores busy—while the EBS host accumulated only 251 CPU-seconds, or about one core busy. Some PostgreSQL functions appeared proportionally hotter on EBS, but the absolute CPU time showed that EBS processes were spending far more time off-CPU waiting for storage.
The NVMe host kept more of its CPU capacity busy doing useful work. That helps explain the much higher throughput: cache misses, WAL flushes, and maintenance I/O still occurred, but they completed faster and left PostgreSQL spending less time blocked on storage.
The durability question
After the performance results, the talk turns to the obvious objection: instance-store NVMe is tied to the lifetime of a machine, so the local data disappears with the node. The operational question is whether PostgreSQL can combine NVMe latency with production-grade availability and recovery.
The short answer is yes, given durability is provided at the cluster level rather than by any individual Postgres node.
Running NVMe-backed Postgres on production
Running PostgreSQL on local NVMe in production means designing around storage that is fast but tied to the lifetime of a machine. Losing a node means losing its local copy of the data; instance-store volumes cannot be snapshotted through the EBS API; and available capacity depends on the selected instance type.
The production architecture presented in the talk addresses this through three main requirements: replicate the database so the service can survive node loss, maintain backups and recovery data outside the individual machines, and plan capacity around the NVMe available on each instance type. Together, these patterns make it possible to run NVMe-backed PostgreSQL confidently in production.
High availability with two standbys
The first pattern is quorum-based synchronous replication with two standby candidates. With a configuration such as ANY 1 (standby1, standby2), a transaction can commit after either standby durably acknowledges its WAL rather than waiting for the slower of the two. Placing the nodes across availability zones protects against an AZ failure.
Continuous backups to Object Storage for durability
For durability outside the database nodes, open-source tools such as WAL-G can provide physical base backups and continuous WAL archiving. With low-latency WAL shipping, this architecture can target an RPO measured in seconds and support point-in-time recovery within the retention window.
Backups and WAL should also be kept in a separate failure domain, with another regional copy when the recovery plan needs to survive a full regional outage.
Backups as the recovery foundation
Base backups and archived WAL are more than an emergency mechanism: the same recovery history can support point-in-time restores, isolated branches, deployment resizing, read-replica seeding, and disaster recovery.
Backups and replication solve different problems. In the architecture described in the talk, standbys provide rapid failover, while backups protect against corruption, operator error, and cluster-wide failure; both recovery paths need regular testing.
Examples from production
This pattern is not only theoretical, the talk cites public examples from Instacart, which has described PostgreSQL on NVMe for a latency-sensitive search workload, and Datadog, which has discussed local-NVMe PostgreSQL instances for workloads that need them. The recurring pattern is local storage for performance, synchronous replication for availability, and independently stored base backups and WAL archives for recovery.
The main takeaway
The talk closes with a diagnostic suggestion: when PostgreSQL appears to stop scaling, inspect the database and storage together. Slow ingestion, unpredictable read latency, vacuum pressure, disruptive checkpoints, and replication lag can be signals that the storage layer has reached a limit.
The bottom line is deliberately narrower than the title: local NVMe can sharply reduce the I/O penalty for storage-bound workloads, but it comes with a different operating model. The architecture outlined in the talk uses quorum-based replication for availability and independently stored base backups plus archived WAL for recovery.
Get started with ClickHouse Managed Postgres today
Interested in seeing how ClickHouse Managed Postgres works on your data? Get started with ClickHouse Cloud in minutes and receive $300 in free credits.
Sign up