50.3k
50.3k
In my last post I built a full-stack retail app, ClickShop, with a coding agent and the ClickHouse stack. That project was about writing application code. This one is about something different: standing up and operating real infrastructure.
I gave the agent a single command-line tool, clickhousectl, and one goal: a multi-region observability platform with three ClickHouse Cloud services in the US, Europe, and Japan, each ingesting OpenTelemetry logs, traces, and metrics, and one global view in Europe.
What I want to share is less the result than the experience of building it. When your platform speaks a clean CLI, an agent can operate it the same way it edits code: it runs a command, reads the JSON it gets back, and decides the next step. That is what turned a multi-region setup into an afternoon of work.
The use case
As an SA I keep seeing the same starting point at customers: the application is already distributed. You run close to your users in the US, Europe, and Asia, for latency and often for compliance. And the moment the app is spread out, its telemetry is too. Shipping every log line from Tokyo into one central cluster is slow, costly, and frequently not allowed.
So you live with a tension. Each region has to keep its own logs, traces, and metrics where they are produced, yet the on-call engineer still needs one screen that answers a single question: is the whole system healthy, everywhere?
The point of this project was to show you don't have to choose between the two. My scenario was deliberately small:
- A ClickHouse Cloud service in the US (
us-east-1), one in Europe (eu-west-1), and one in Japan (ap-northeast-1). - Each service ingests the OpenTelemetry data from its own region.
- Europe carries one consolidated view over all three, and only reaches the other regions when that view is actually queried.
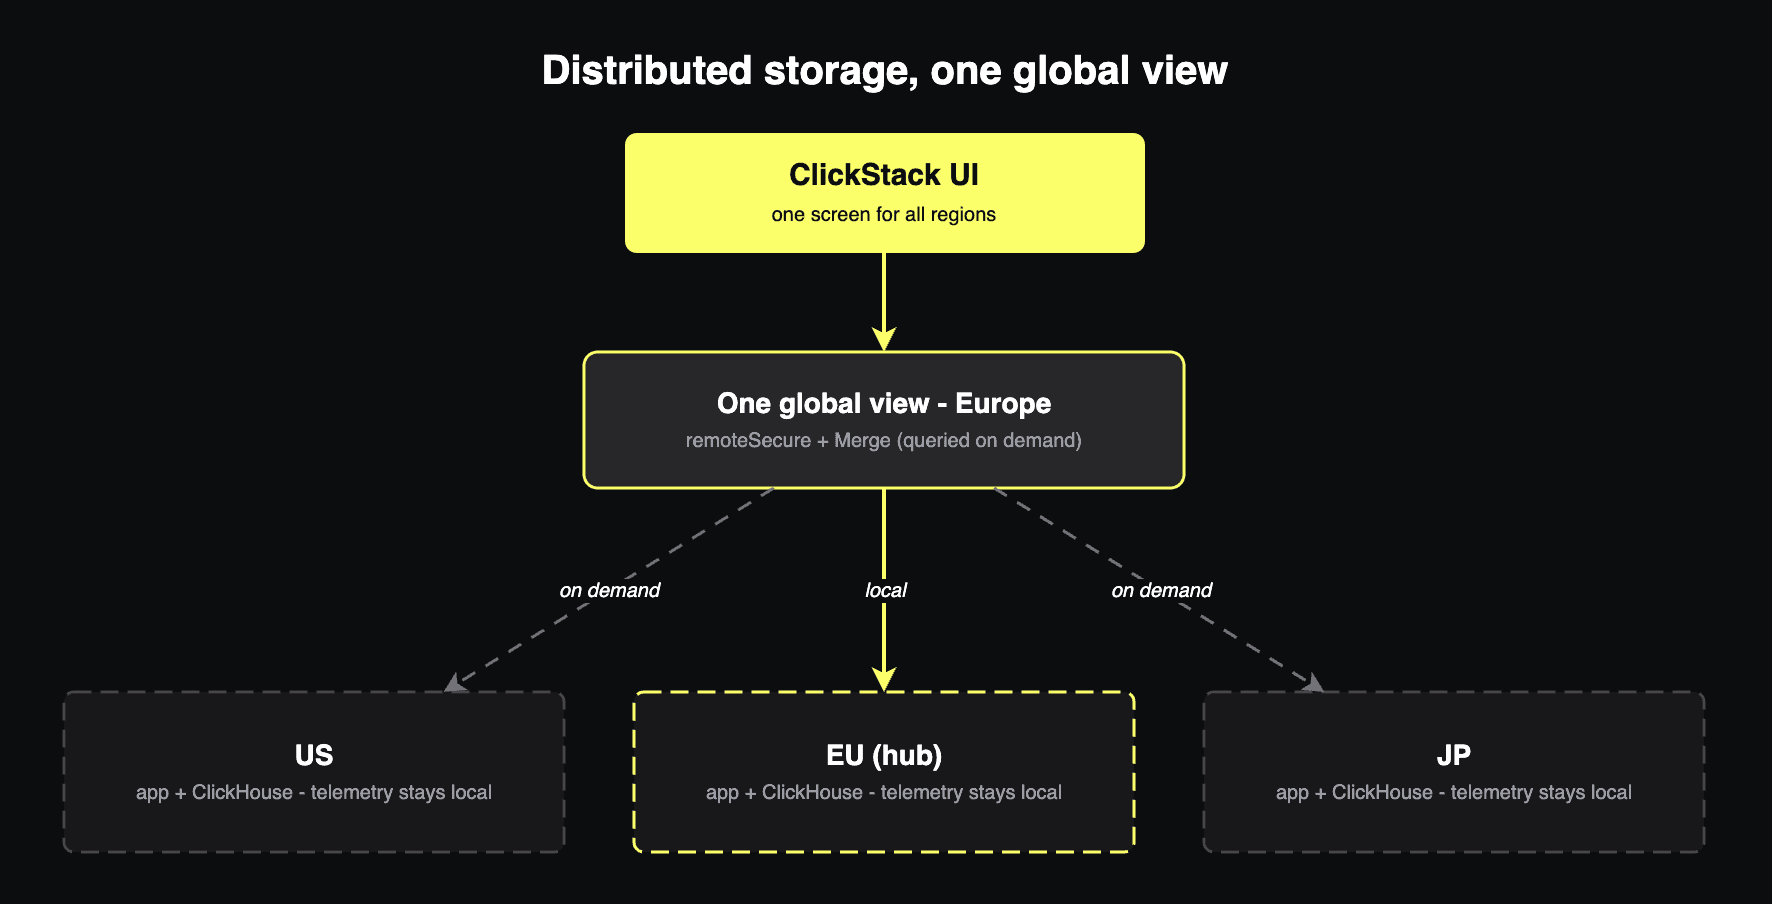
Figure 1. Distributed storage, one global view. Each region keeps its telemetry local while Europe exposes a single view that is queried on demand and read by the ClickStack UI.
The architecture
Ingestion is regional and self-contained. In each region the app sends OTel data to a local collector, which writes into the ClickHouse service sitting next to it. Nothing crosses a border on the write path.
Europe does one extra job. It hosts a small otel_global database that presents the three regions as a single set of tables, and the ClickStack UI reads from there. Two ordinary ClickHouse features do all the work:
remoteSecure()is a secure pointer to a table on another service. It stores nothing of its own; when you read through it, ClickHouse fetches the rows from the remote region at query time.- The
Mergeengine exposes several tables as one. In Europe I merge the local EU table with the two remote pointers, so a singleSELECTcan span three continents.
A query on EU data stays inside Europe; the US and Japan services are contacted only when a query genuinely needs them.
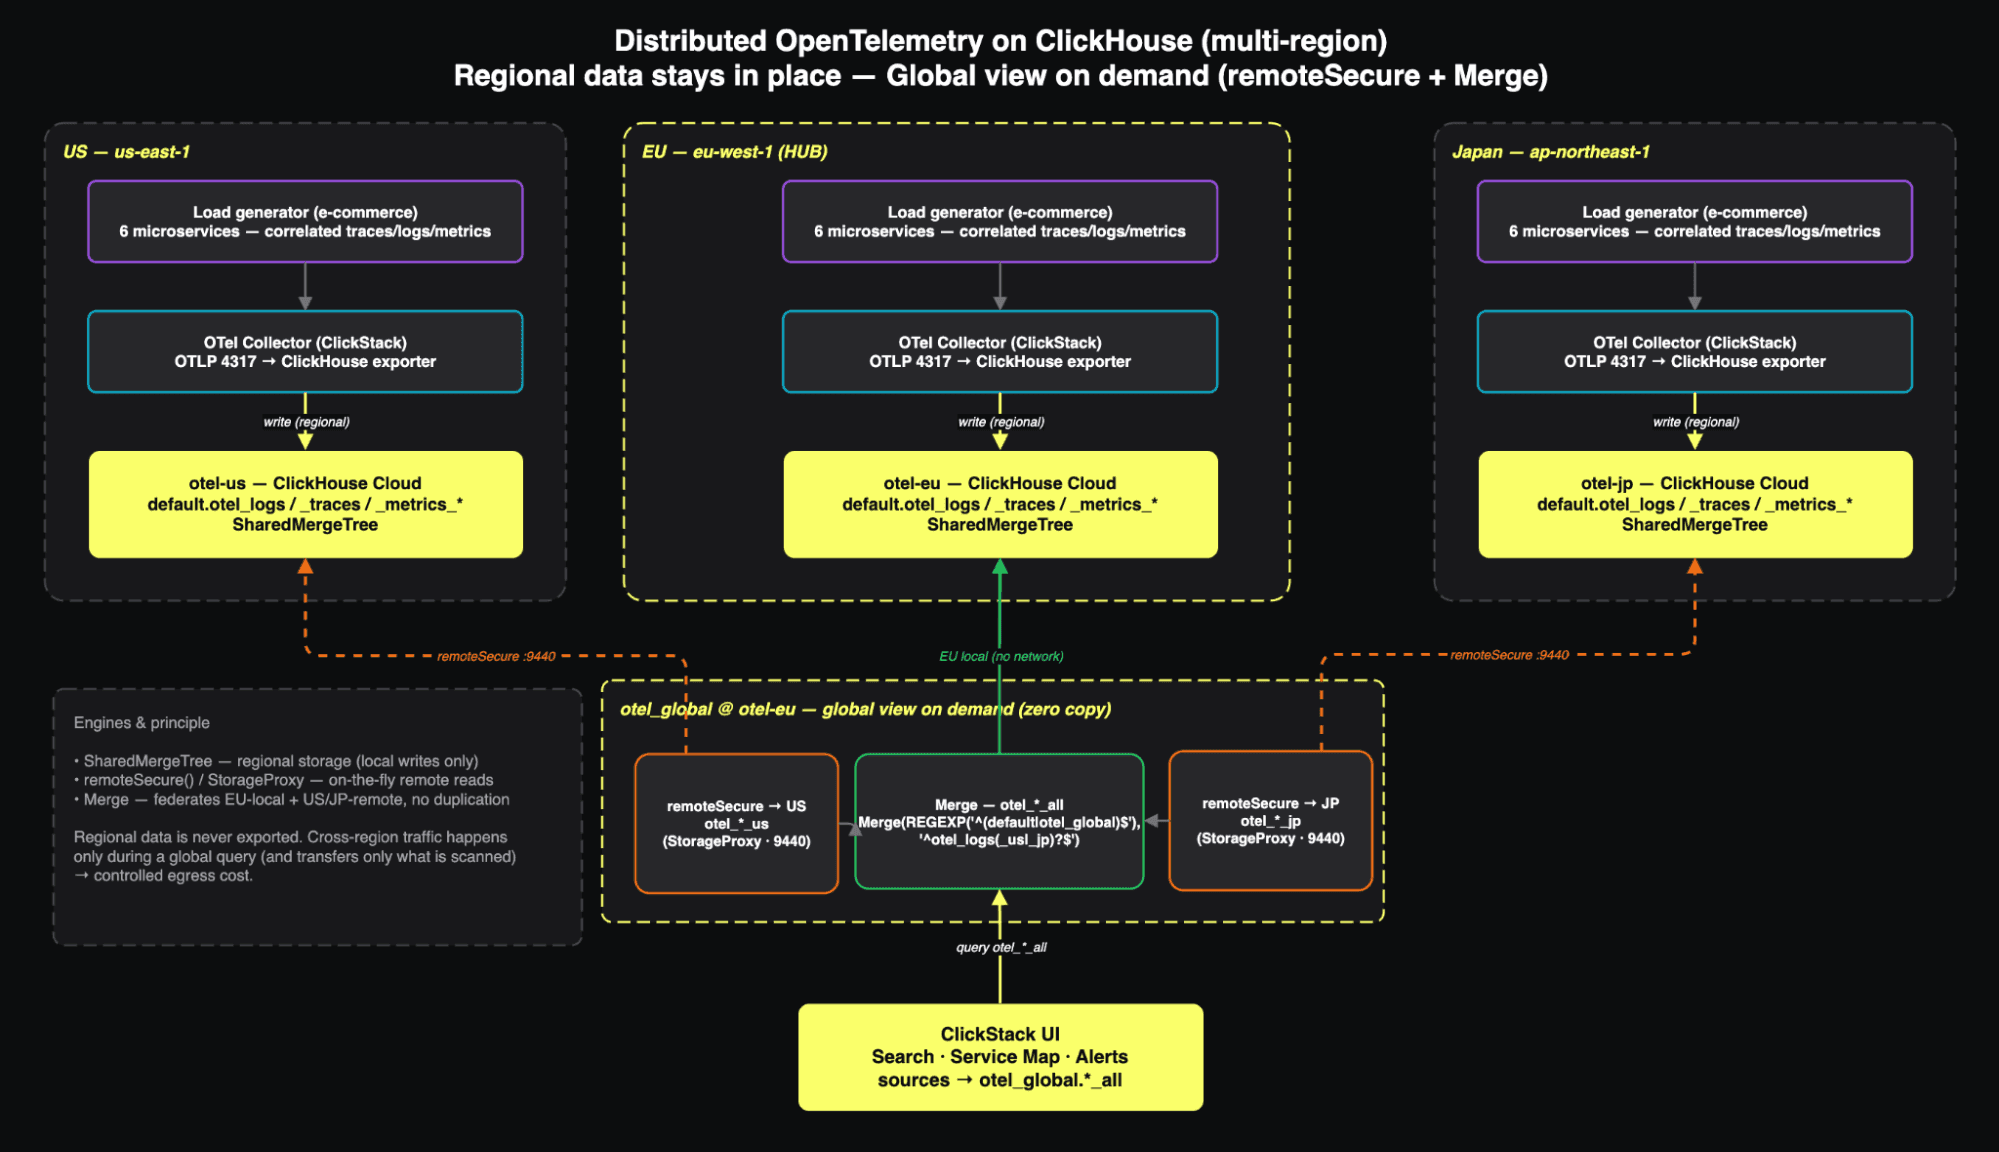
Figure 2. The full setup. Each region ingests through its own OpenTelemetry collector into a local ClickHouse service, and Europe federates the three with remoteSecure and the Merge engine behind the ClickStack UI.
Get started today
Interested in seeing how ClickHouse works on your data? Get started with ClickHouse Cloud in minutes and receive $300 in free credits.
Sign upPutting clickhousectl to work
clickhousectl is the CLI for ClickHouse local and cloud that allows agents to prototype locally on your laptop, and stand up production infrastructure in ClickHouse Cloud.
For one service I might have clicked through the Cloud console. For three services in three regions, each with its own connection details and SQL to run, clicking is the wrong tool. An agent with the CLI can run through the entire flow much faster. Every step the build needed, create a service, wait for it, read its connection details, run SQL, tear it all down, is one command, and every command can answer in JSON.
# Install the ClickHouse Agent Skills to give agents a headstart
clickhousectl skills
# authenticate (an API key is what an agent or a CI job uses)
clickhousectl cloud auth login --api-key <KEY> --api-secret <SECRET>
# create, inspect, and query a service, each able to answer in JSON
clickhousectl cloud service create --org-id <ORG_ID> --name otel-eu \
--provider aws --region eu-west-1 --num-replicas 1 --json
clickhousectl cloud service get <SERVICE_ID> --json
clickhousectl cloud service query --name otel-eu --query "SELECT count() FROM otel_logs"Building it, step by step
These are the prompts I used, trimmed to the essentials. As before, the trick is to brief the agent like a colleague and bake the domain knowledge into the ask.
Provisioning the three services
"Use
clickhousectlto create three Cloud services, one each in US east, EU west, and Japan, and keep each service's ID and connection details so the later steps can reuse them."
The agent wrote a short loop over the three regions, called service create, and parsed the response with jq to pull out exactly the fields it needed next:
out=$(clickhousectl cloud service create \
--org-id "$ORG_ID" --name "$name" --provider aws --region "$region" \
--num-replicas 1 --json)
sid=$(echo "$out" | jq -r '.service.id')
host=$(echo "$out" | jq -r '.service.endpoints[] | select(.protocol=="https") | .host')It then polled service get until each service reported running before moving on, so nothing downstream started against a service that wasn't ready. The script became the documentation: re-run it and you get the same three services.
Sending OpenTelemetry to each region
"In each region, instrument the application with OpenTelemetry and point its collector at that region's ClickHouse service. The app is a set of microservices (frontend, cart, payment) that emit correlated logs, traces, and metrics, with each service tagged by its region, like
frontend-us."
The collector creates the OTel tables on its own. Each service emits proper client and server spans so the service map renders, logs that carry the same trace IDs, and metrics with matching labels. The regions don't behave identically either: each runs at its own error rate, enough variation that the data tells a story worth alerting on.
The global view
"On the EU service create
otel_global. For each OTel table, addremoteSecurewrappers to the US and JP services, then aMergetable over the local EU table plus those wrappers."
The agent ran the whole thing through clickhousectl cloud service query:
CREATE TABLE otel_global.otel_logs_us AS
remoteSecure('<US_HOST>:9440', 'default', 'otel_logs', 'default', '<US_PASSWORD>');
CREATE TABLE otel_global.otel_logs_jp AS
remoteSecure('<JP_HOST>:9440', 'default', 'otel_logs', 'default', '<JP_PASSWORD>');
CREATE TABLE otel_global.otel_logs_all
ENGINE = Merge(REGEXP('^(default|otel_global)$'), '^otel_logs(_us|_jp)?$');Query otel_logs_all and ClickHouse reads the EU rows locally and pulls the other two regions over a secure connection on the spot. Data residency and a global view, in a few lines of plain SQL.
One screen for three continents
I pointed the ClickStack UI in Europe at the otel_global.*_all tables. Because those already merge the regions, the UI needs to know nothing about the topology. To the on-call engineer it looks like a single backend: one search returns logs from all three regions, the service map shows frontend-us, cart-eu, and payment-jp together, and a trace that begins in one region is followed end to end.
Then I asked for alerts in two forms: a set of SQL rules (error rate per region, payment failures, latency, an out-of-stock spike, and a dead-man switch for a region that goes silent) with a small script to evaluate them for cron or CI, and the same rules as native ClickStack alerts that run every minute. Because one region is deliberately noisier than the others, the alerts fire on sight, which is exactly what you want in a demo.
Why the CLI mattered
The interface your platform exposes decides how much an agent can take off your plate. A web console is built for a human doing something once. An agent cannot loop over it, read a button, or put a click in a script. The moment the task is three regions and a setup you'll want to run again next week, the console becomes the bottleneck.
Three things made clickhousectl easy to hand over. It is safe by default: the agent gets read access from a browser login, but it needs an API key I grant before it can create or delete anything. It is one tool from my laptop to production, so the agent never changes context between local and cloud work. And it disappears into automation, because the commands it ran by hand are the same ones a pipeline can run at 3am, with nothing rewritten in between.
That is what let the agent treat infrastructure as just another part of the codebase: something to script, review, and re-run without surprises.
Build from the terminal
This started as a way to show customers a distributed architecture. It ended as a reminder that the best agent experience often isn't a polished UI; it is a well-designed command-line tool that returns clean JSON and clear errors.
Install clickhousectl however best suits you:
curl https://clickhouse.com/cli | sh
# or
npm install -g clickhousectl
# or
pip install clickhousectl
# or
pipx install clickhousectl
# or
uv tool install clickhousectl
# or
cargo install clickhousectlThen authenticate with an API key, and ask your agent to create a service. Watch it run the command, read the endpoint, and connect without ever opening a browser, then point it at something real and let it script the rest.