50.6k
50.6k
We’ve written publicly about LogHouse, our internal observability platform for ClickHouse Cloud. We last wrote about crossing one quadrillion rows in the whole platform, and OpenTelemetry is a meaningful and fast-growing share of that, serving as the unified collection layer for logs, metrics, and traces across all components in our stack.
Today, our OTel pipeline ingests 50 million events per second, storing 177 PiB of uncompressed data, collecting data from ClickHouse servers and keepers, internal Kubernetes-based services, external cloud provider infrastructure, and more. Our previous post in the series teased a custom S3-backed pipeline for ensuring durability in our collector-based ingestion. In this post, we’ll share the full architecture and history of how we got here.
History
Iteration 1: agent to gateway
Our first iteration was the one you’ll find in every OTel reference deployment: a two-layer pipeline of node-local agents feeding to a shared set of gateways.
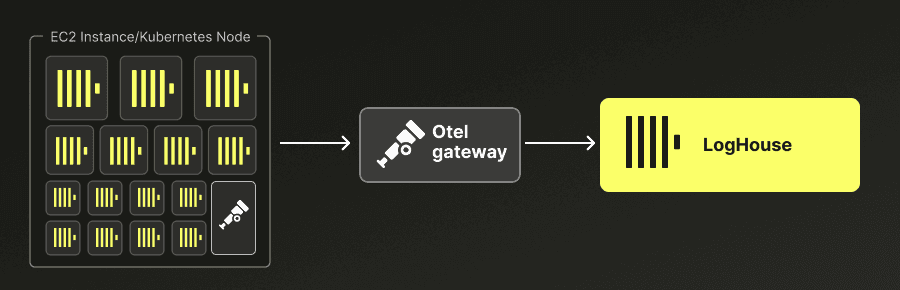
The agents ran as a DaemonSet on every Kubernetes node, scraping pod logs and receiving metrics and traces. This is a resource-constrained environment as we want to allocate as much node memory as possible to the actual workloads, so the agents simply attached resource attributes, did very minimal batching, and forwarded the data on to the gateway layer.
The gateways were the scalable layer for more heavyweight processing. There, we could allocate more memory to accumulate larger insert batches, which ClickHouse likes best.
We chose this for the same reason everyone does: it’s the boring default, but it works for 99% of use cases.
Cracking under pressure
We quickly found that this architecture could not survive backpressure from the database. By default, the gateways put outgoing data onto an in-memory queue before shipping it to a remote downstream ClickHouse destination. 50 million events per second translates to 10GBps of data (compressed) volume, meaning it is not economically feasible to absorb even the shortest downstream outages.
The reason we encounter backpressure is that we cannot control, or reliably predict, the rate at which our producers will generate telemetry. LogHouse collects data from ClickHouse servers and keepers, Kubernetes services, cloud provider infrastructure, and other systems across our fleet. At any moment, those producers can emit data faster than the downstream system is provisioned to ingest it.
Sustained growth is relatively straightforward to manage. When telemetry volume increases over time, we can add capacity manually or respond through autoscaling. Short-lived spikes are more difficult. An error affecting part of the fleet might suddenly generate a large volume of logs, or a heavily used service might experience a burst of activity in a particular region. These events can be substantial, but they are often too transient to justify a scaling event. Provisioning enough capacity to absorb every possible spike would also leave that capacity idle most of the time.
We therefore size LogHouse for expected sustained throughput, with appropriate headroom, rather than for the largest conceivable burst. The ingestion pipeline must absorb temporary mismatches between the rate at which telemetry is produced and the rate at which ClickHouse can accept it - without losing data, delaying fresh telemetry behind a backlog, or requiring us to permanently provision for peak demand. This constraint informs every architecture decision in the rest of the post.
Iteration 2: local write-ahead logs
When memory is insufficient, the obvious next step is disk-based storage. The OTel collector has a built-in feature called the file_storage extension for exactly this purpose. When enabled, all outgoing data from the collector is written to a local write-ahead log before shipping downstream.
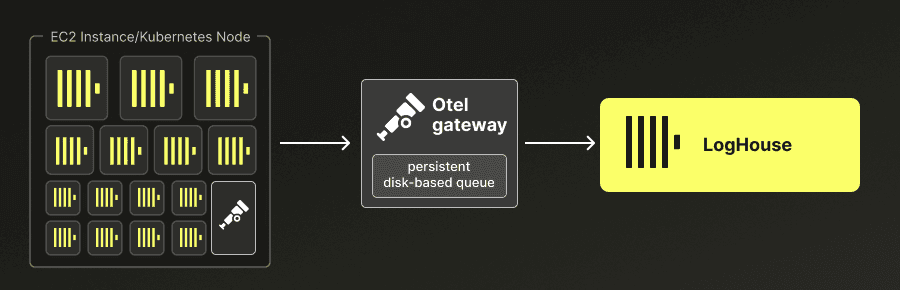
On paper, this solves our problems. Disk is cheaper and denser than memory, so we could provision enough buffer space to absorb even the longest database outages. Additionally, restarts no longer lose in-flight batches.
Unfortunately, this too fell short of our needs. Backing the WAL with a PVC meant we had to deploy the gateways as a StatefulSet. Most of the pod spec became immutable, and rollouts that used to be routine now had to be planned and executed carefully.
Secondly, it didn’t support the performance we required. Throughput was steady when the downstream database was healthy, but it dropped when the WAL size grew during and after periods of downstream backpressure. In our observations, draining 1TiB of backlog took about 4 hours. At our telemetry volume, even a brief pause from the database would result in a WAL backlog that required hours to drain. Horizontal scaling in these situations would not help, as the WAL is per-pod and cannot be split or distributed.
Even worse, the WAL is consumed in roughly FIFO order. After an outage, fresh telemetry landed at the back of the log behind everything else that had accumulated since the pause began. And these were exactly the situations where fresh data mattered the most.
That led to an uncomfortable workaround. When our WALs got large enough that fresh data would be delayed by hours, we’d truncate them. We had taken on the trouble and cost of building durable storage for our telemetry, then routinely threw the data away. This was a sign that the collector WAL was not the right solution for us.
What about Kafka?
Anyone familiar with telemetry pipelines at scale is probably thinking about Kafka right now. The standard playbook is to put a streaming system like Kafka, Warpstream or Pulsar between the agents and the gateways. The gateways become a simple stateless layer that consumes the stream, which absorbs backpressure and scales independently. It’s a well-understood pattern that holds up at scale and would solve many of our problems.
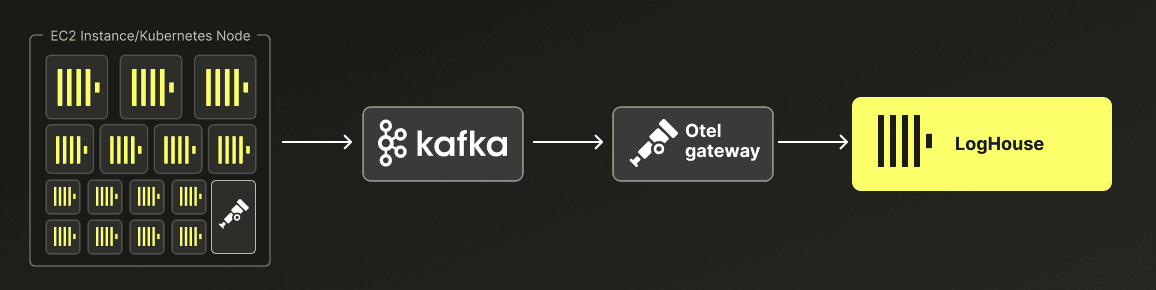
We considered it seriously but decided not to take that path. This was an operational decision, not an indictment of the technology. We don’t deploy Kafka anywhere else in our infrastructure. Adopting it would have meant standing up a new tier zero service across all of our cloud regions. It would take major expertise and effort: deployment, capacity planning, tuning, on-call, upgrades, all for this one use case.
Instead, we took a step back and asked the question: What do we actually want out of our telemetry ingestion pipeline?
Designing iteration 3
Between the two iterations of our collector architecture and our research into a Kafka-based alternative, the shape of our requirements was clear. Our third iteration had to satisfy four constraints:
- No external queuing system for the raw telemetry. We weren't going to take on the operational burden of running another stateful service like Kafka just to buffer data on the hot path, nor could we accept Kafka’s head-of-line blocking.
- Cost-effective at scale. Telemetry is a cost center, and everything we deploy counts towards our cloud margins.
- Reliable under failure. The pipeline had to absorb arbitrary periods of backpressure from ClickHouse without losing data.
- Open source. We want to continue to match how our customers run ClickHouse and OTel.
Two insights shaped our design.
The first was blob storage. S3, GCS, and Azure Blob are bottomless, durable, and maintenance-free, and are already a core component of our cloud.
The second was priority-based failover. The OTel collector ships with a failoverconnector that routes to a primary destination and only falls back to a secondary when it detects failures from the primary. This gave us a way to keep ClickHouse in the hot path while treating blob storage as a release valve that only activated during periods of backpressure.
This was critical for cost control. Writing everything to blob storage at our full ingest rate would have been prohibitive: at 50 million events per second, PUT operation costs alone dwarf the storage bill. Object stores are cheap to hold data in, but expensive to write to at high throughput. We projected between $100,000 and $500,000 per year in API costs for our own workload at today's volume, entirely unsustainable at our exponential growth rate. Priority-based failover meant we only paid those PUT costs during the intermittent windows when ClickHouse was unavailable. During normal operation, telemetry went straight to ClickHouse.
Once data has spilled into blob storage, we rely on event notifications to pull the blobs out and write them back into ClickHouse with a separate collector. This is another basic feature of blob storage, where a record of certain operations (like new objects) can be published with the object metadata onto a queue. This provides a simpler, more scalable model than listing the bucket and checkpointing progress.
What if blob storage goes down?
A reasonable question at this point, especially since ClickHouse Cloud itself is backed by blob storage. A hard outage of the blob store takes out the primary and backup at the same time, and the overflow mechanism can’t save us here.
Full S3 outages are rare, however, and a different class of failure than what we want to prepare against. We considered placing the overflow buckets in different regions than the LogHouse clusters they supported, but the egress costs of shipping overflow batches across regions were prohibitive for such a rare situation.
Instead, we designed around the more common failure mode. Blob storage often incurs partial disruption, visible as severe throttling on specific keys or prefixes. We distribute the overflowed batches across a wide keyspace so no single prefix concentrates the load during a failover. This works because the event notifications contain the full key of the object, so the key's structure can be completely opaque and does not need to be optimized for range scans.
The new pipeline
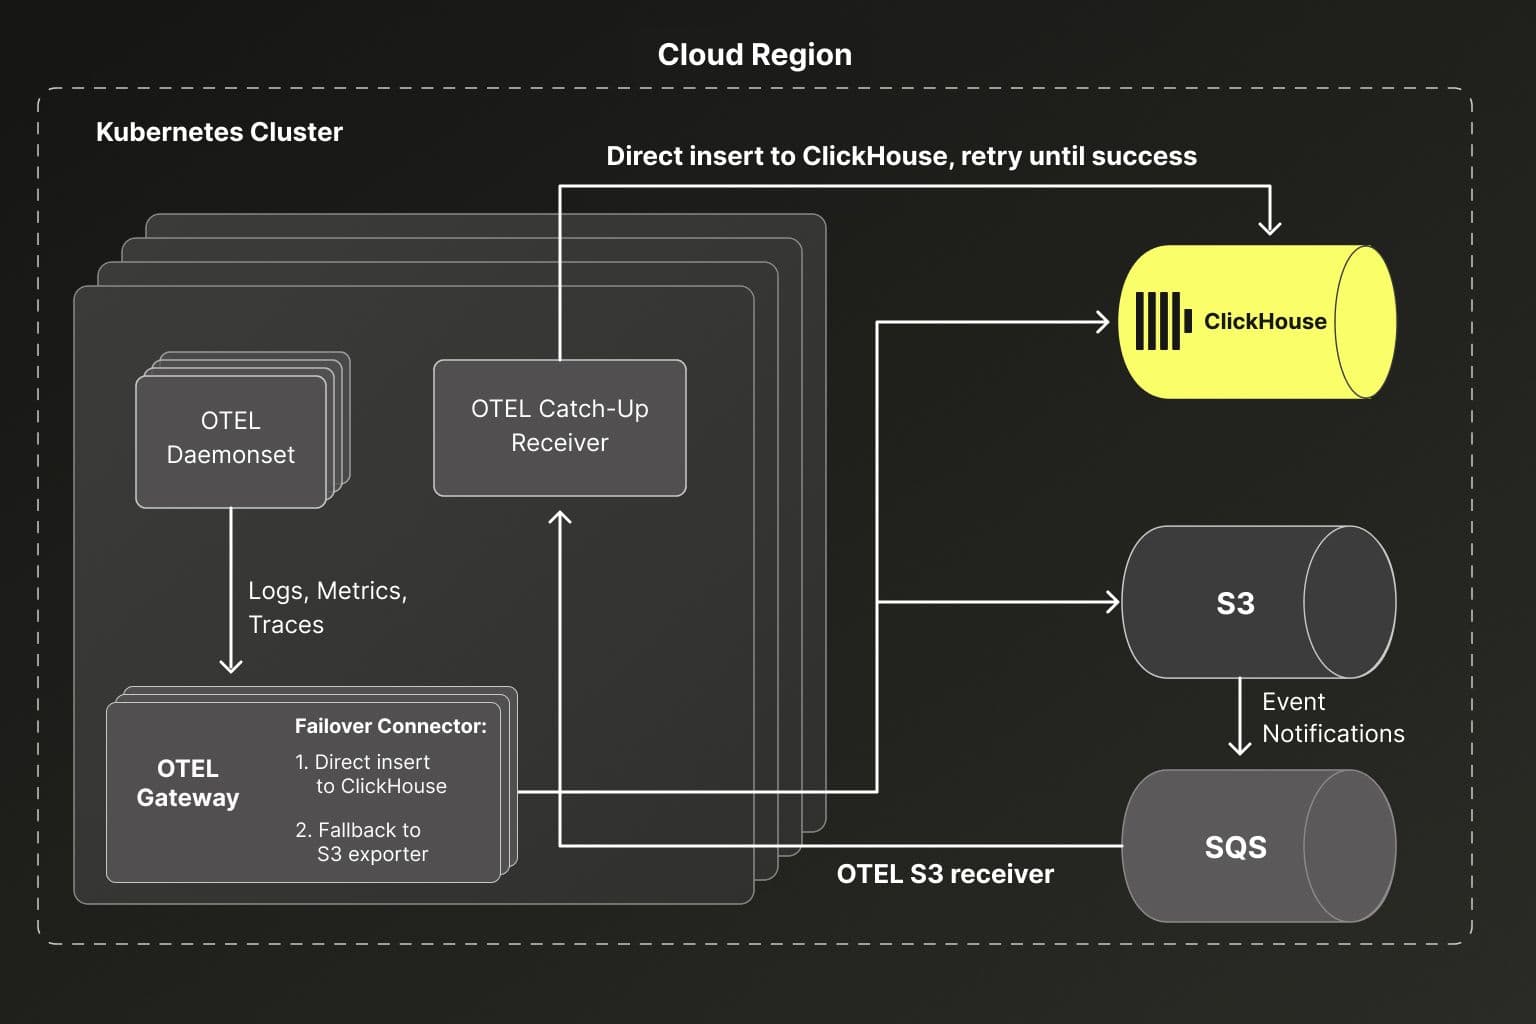
There are only a few more moving pieces. On the cloud side, we have introduced an S3 bucket with a prefix per telemetry signal. Each prefix has an associated event notification and SQS queue. Within our Kubernetes infrastructure, the agent tier is unchanged. The gateway tier is stateless, with the failover connector taking responsibility for routing to the healthy target. Then, we have a separate catch-up receiver polling event notifications from SQS and inserting them into ClickHouse. When the database is unhealthy, the notifications simply accumulate in SQS.
Failover connector
In OTel, a connector is a component that behaves as both a receiver and exporter. The failover connector takes a list of pipelines in priority order and routes incoming batches to the highest priority healthy pipeline. It doesn’t perform health checking; instead, it inspects the results of each pipeline.
There is one gotcha: the sending queue on the ClickHouse exporter must be disabled, otherwise any errors will be hidden from the connector, and failovers will be delayed. It is best practice to enable the sending queue on all OTel exporters, but doing so turns a synchronous pipeline into an asynchronous one. This will delay the backpressure signals from reaching the failover connector. To avoid this, the connector itself supports a sending queue, so it sits upstream of the routing decision.
We also don’t want any transient network error or individual query failure from ClickHouse to trigger a full failover, so we still enable inline synchronous retries in the exporter with the retry_on_failure setting.
On the blob storage exporter, we do the opposite: we want failures to be hidden from the failover connector. Since we have two priority levels, we want to avoid a situation where all levels are reporting unhealthy to the failover connector. This would cause the failover connector to stop sending data downstream and buffer in its sending queue until it recovers a healthy destination. So we hide failures of individual batch failures by enabling the sending queue on the blob storage exporter. As mentioned above, we designed our key format to avoid common throttling from blob storage. Coupled with an aggressive retry policy, this gave us strong enough durability guarantees while avoiding risks of OOM during outages.
With this combination, we get a pipeline that satisfies all our requirements. Under normal operations, data flows directly into ClickHouse. Transient errors are covered by inline retries and never trigger a failover. If we get real backpressure from ClickHouse, a failover automatically switches the traffic to S3. When ClickHouse recovers, the failover connector detects it automatically and switches live traffic back. Live traffic is never delayed behind the backlog in S3.
connectors:
failover/logs:
priority_levels:
- [logs/clickhouse]
- [logs/s3]
retry_interval: 30s
sending_queue:
enabled: true
queue_size: 10000
service:
pipelines:
logs:
receivers: [otlp]
exporters: [failover/logs]
logs/clickhouse:
receivers: [failover/logs]
exporters: [clickhouse]
logs/s3:
receivers: [failover/logs]
exporters: [awss3/logs]
exporters:
clickhouse:
endpoint: ""
connection_params:
async_insert: "1"
wait_for_async_insert: "1"
...
sending_queue:
enabled: false
retry_on_failure:
enabled: true
awss3/logs:
s3uploader:
s3_base_prefix: logs
s3_bucket: ""
...
sending_queue:
enabled: true
queue_size: 10000Catchup receiver
Once data has failed over to blob storage, we rely on event notifications to drive the write-back to ClickHouse. Each major cloud provider supports this feature with at-least-once delivery into their queueing system (SQS, Event Hubs, PubSub). The OTel collector’s blob storage receivers can be pointed at these queues to consume the notifications and process the blobs.
Our catchup collector deployment is very simple. Using the blob storage receivers, we run stateless collectors as a Kubernetes deployment that poll events from the queue. When the queue is empty, these collectors scale down to zero. This is a completely separate deployment from the gateways, so live traffic and catch-up do not interfere with each other and can scale independently.
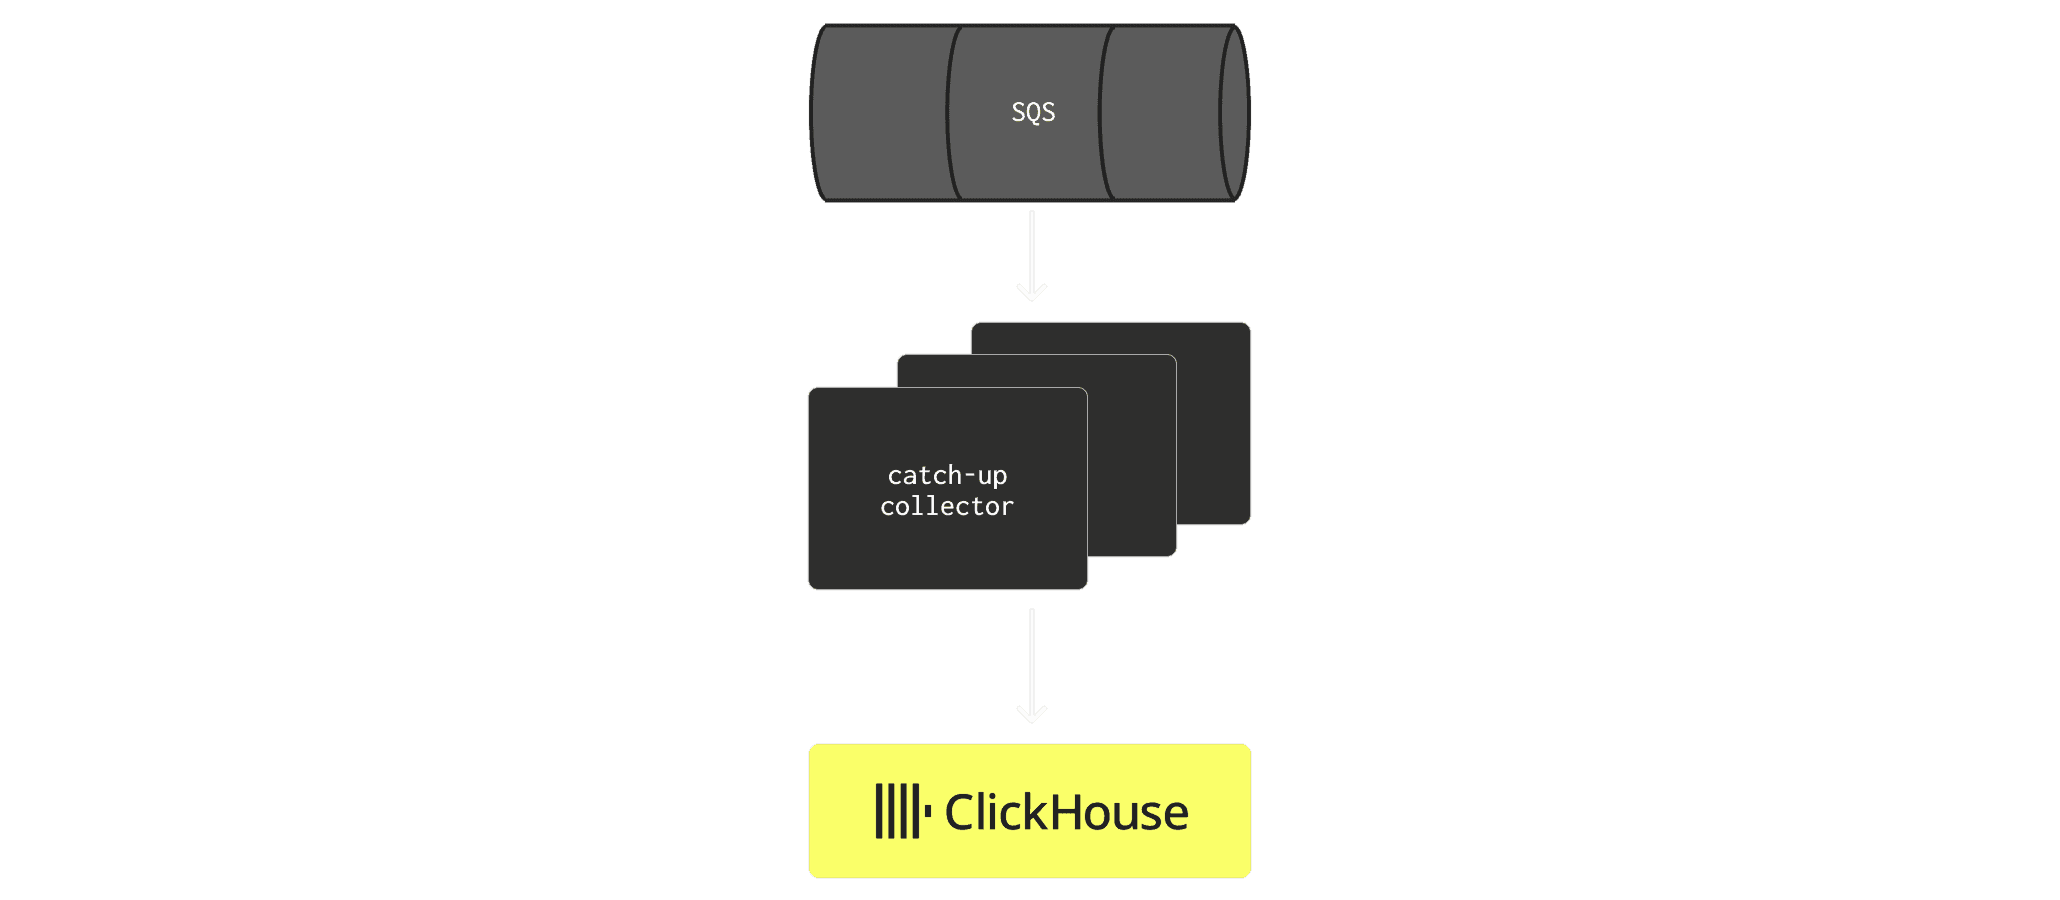
After a failover, events will be posted into the queue. The collectors will pull the events, download the blobs, and attempt to synchronously insert them into ClickHouse. All enrichment and processing will have occurred at the agent and gateway layer, so these batches can be piped into the database verbatim. If ClickHouse is still unavailable, the insert fails, and the message stays on the queue and is retried on the next poll.
receivers:
awss3/logs:
s3downloader:
s3_bucket: ""
s3_prefix: logs
sqs:
queue_url: ""
exporters:
clickhouse:
endpoint: ""
connection_params:
async_insert: "1"
wait_for_async_insert: "1"
...
sending_queue:
enabled: false
retry_on_failure:
enabled: true
service:
pipelines:
logs:
receivers: [awss3/logs]
exporters: [clickhouse]Unlike streaming telemetry data through Kafka, the notifications queue is lightweight. Messages are only posted when overflow occurs, and the messages themselves contain only a few hundred bytes of data representing the object keys, rather than multi-MB batches of raw data.
Failover in practice
To validate this design, we ran an end-to-end gameday to see how the pipeline responds under pressure. We used a full downstream outage as the most extreme possible test: with ingestion capacity reduced to zero, all incoming telemetry creates sustained backpressure.
In Iteration 1, our gateways would OOM and crash within minutes of a ClickHouse outage. In Iteration 2, we could survive multi-hour outages, but anything longer than 30 minutes would result in a WAL backlog that we would not be able to catch up on. To validate Iteration 3, we performed a hard stop of our LogHouse cluster in a staging region for a full hour. This region processes 120,000 events per second at steady state.
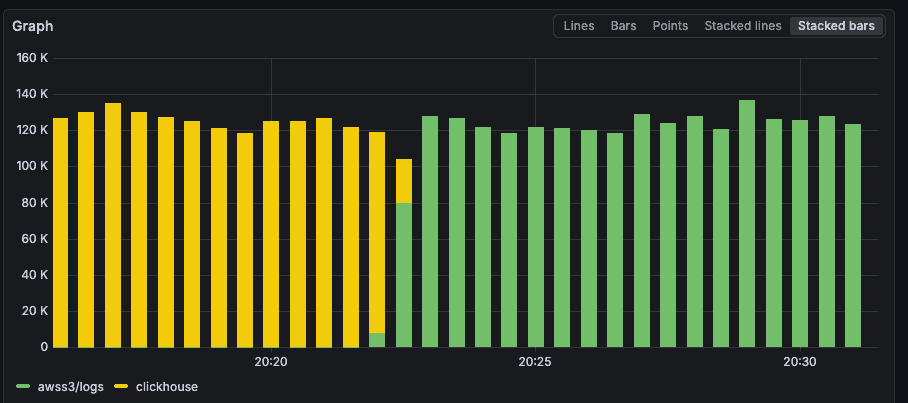
This is a graph of the otelcol_exporter_sent_log_records_total metric, grouped by exporter. The yellow bars represent the rate of logs being written to the ClickHouse exporter, and green is the rate being written to the S3 exporter. When the database stopped, the failover occurred automatically and afterwards logs flowed to S3 at a steady state. During and after the failover, we observed no change in resource usage on the gateway collectors.
After an hour we restarted our LogHouse cluster.
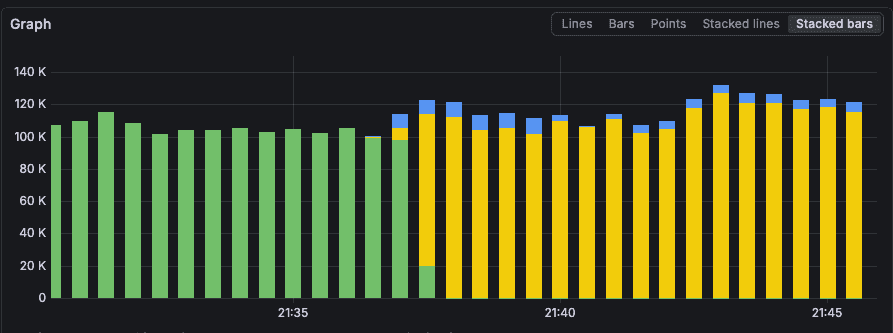
Immediately, the records written to S3 drop and the records written to ClickHouse resume. Additionally, the blue bars at the top can be seen representing the logs sent to ClickHouse by the catchup collector. During the outage it was trying and failing to process the overflow notifications, but when ClickHouse recovered it succeeded and began to drain the queue.
Conclusion
We started with a fragile pipeline that we could not trust. Every blip from our database resulted in OOMs, crash loops, and operational toil. Today, we run a highly reliable and highly custom collector architecture that has absorbed many database outages without losing data. Because we removed our PVCs for the local WALs, our stack has become operationally lighter and significantly more cost-effective.
There have been tradeoffs too. Each new region we expand to requires more infrastructure setup for the additional buckets, queues, and event notifications. We also accepted a more complicated collector configuration. The asynchronous recovery design also introduces fuzziness during the recovery phase of an outage: while the backlog is draining, we know how much data remains overall, but not which specific data is still outstanding e.g. such as telemetry from a particular pod.
We first deployed this architecture at 10 million events per second and it has scaled seamlessly to 50 million. This has given us the confidence to ship this architecture to the OTLP ingestion endpoint of Clickstack Cloud, our fully managed observability service.
Get started today
Interested in seeing how ClickStack works on your data? Get started with Managed ClickStack in ClickHouse Cloud in minutes and receive $300 in free credits.
Sign up