Introduction #
Amazon Redshift is a cloud data warehouse that provides reporting and analytics capabilities for structured and semi-structured data. It was designed to handle analytical workloads on big data sets using column-oriented database principles similar to ClickHouse. As part of the AWS offering, it is often the default solution AWS users turn to for their analytical data needs.
While attractive to existing AWS users due to its tight integration with the Amazon ecosystem, Redshift users that adopt it to power real-time analytics applications find themselves in need of a more optimized solution for this purpose. As a result, they increasingly turn to ClickHouse to benefit from superior query performance and data compression, either as a replacement or a “speed layer” deployed alongside existing Redshift workloads.
In this blog, we explore why users move workloads from Redshift to ClickHouse, providing evidence of increased compression and query performance and describe options for migrating data – in bulk, as well as continuously appending new data using AWS EventBridge, AWS Lambda and AWS Glue.
ClickHouse vs Redshift #
For users heavily invested in the AWS ecosystem, Redshift represents a natural choice when faced with data warehousing needs. Redshift differs from ClickHouse in this important aspect – it optimizes its engine for data warehousing workloads requiring complex reporting and analytical queries. Across all deployment modes, the following two limitations make it difficult to use Redshift for real-time analytical workloads:
- Redshift compiles code for each query execution plan, which adds significant overhead to first-time query execution (up to 2s in our testing). This overhead can be justified when query patterns are predictable and compiled execution plans can be stored in a query cache. However, this introduces challenges for interactive applications with variable queries. Even when Redshift is able to exploit this code compilation cache, ClickHouse is faster on most queries - see "Benchmarks" and "ClickHouse vs Redshift Query Comparison" below.
- Redshift limits concurrency to 50 across all queues, which (while adequate for BI) makes it inappropriate for highly concurrent analytical applications.
Conversely, while ClickHouse can also be utilized for complex analytical queries it is optimized for real-time analytical workloads, either powering applications or acting as a warehouse acceleration layer. As a result, Redshift users typically replace or augment Redshift with ClickHouse for the following reasons:
- ClickHouse achieves lower query latencies, including for varied query patterns, under high concurrency and while subjected to streaming inserts. Even when your query misses a cache, which is inevitable in interactive user-facing analytics, ClickHouse can still process it fast.
- ClickHouse places much higher limits on concurrent queries, which is vital for real-time application experiences. In ClickHouse, self-managed as well as cloud, you can scale up your compute allocation to achieve the concurrency your application needs for each service. The level of permitted query concurrency is configurable in ClickHouse, with ClickHouse Cloud defaulting to a value of 1000.
- ClickHouse offers superior data compression, which allows users to reduce their total storage (and thus cost) or persist more data at the same cost and derive more real-time insights from their data. See "ClickHouse vs Redshift Storage Efficiency" below.
Users additionally appreciate ClickHouse for its wide-ranging support of real-time analytical capabilities, such as:
- Large range of specialized analytical functions designed to shorten and simplify query syntax, e.g., aggregate combinators and array functions
- SQL query syntax designed to make analytical queries easier, e.g., ClickHouse does not enforce aliases in the SELECT
- Superior data types support, including Strings longer than 65k characters, Enums, and Arrays, which are commonly needed for analytical query schema
- Superior file and data formats support, compared to a more limited selection in Redshift, simplifying the import and export of analytical data,
- Superior federated querying capabilities, enabling ad-hoc queries against a wide range of data lakes and data stores, including S3, MySQL, Postgres, MongoDB, Delta Lake, and more
- Secondary Indexes & Projections - ClickHouse supports secondary indices, including inverted indices for text matching, as well Projections to allow users to target specific queries for optimization.
Redshift Deployment Options #
When deploying Redshift, users are presented with several options, each with respective strengths and weaknesses for different workloads:
Redshift Serverless - A recent addition to the Redshift product lineup (GA in July 2022), this offering separates storage and compute and automatically provisions and scales the warehouse capacity based on query load. Similar to ClickHouse Cloud, this is a fully managed offering where instances are automatically upgraded. Available compute capacity is measured through a custom Redshift Processing Units (RPU) unit (approximately two virtual CPUs and 16 GB of RAM), for which the user sets a limit (defaulting to 128). Users are charged for the data stored, and the compute capacity consumed while the warehouse is active with 1-second granularity and a minimum charging period of 1 minute. While changing RPU limits requires notable downtime, this offering is suitable for ad-hoc analytics where performance is not critical, and workloads are variable with potential idle time. However, it is less appropriate for high or potentially unbounded and unpredictable query workloads, e.g., for applications where the load is based on the number of users. Furthermore, if latency is critical, users typically lean to the provisioned choices below.
Redshift Provisioned - The original Redshift offering, with recent additions and improvements, offers users several choices:
- DC2 nodes - Designed for compute-intensive data warehouses based on local SSD storage, where query latency is critical. Redshift recommends these for datasets that are less than 1TB compressed. Users can select specific node sizes and the number of nodes to increase total capacity.
- RA3 nodes - These nodes offer higher storage to compute ratios and offload data to S3 once the local disk is full, using a feature known as Managed Storage. This ability is comparable to ClickHouse Cloud's shared-nothing architecture, where the local disk acts as a cache with s3 offering unbounded storage capacity. Note, however, that, unlike ClickHouse Cloud, data In Redshift is still associated with a specific node, preventing storage and compute from being scaled and paid for completely independently. Storage costs are priced independently of where the data resides (i.e., local disk or s3), with users paying only for managed storage used.
In the rest of this post, we show how Redshift users can migrate data in bulk to ClickHouse, as well as keep data synchronized between the new systems in side-by-side deployments.
Setup & Dataset #
Examples in this blog post utilize ClickHouse Cloud, which has a free trial that allows the completion of the scenarios we cover. We utilize a publicly available cloud environment on sql.clickhouse.com, which has a total of 720 GB of memory and 180 vCPUs, over three nodes (note our benchmarks utilize only one node). All instructions are also compatible with self-managed ClickHouse deployments running the latest version.
We use the Ethereum Cryptocurrency dataset available in BigQuery's public project, which we used in our earlier post comparing ClickHouse with BigQuery. Similar to this post, we defer exploring this dataset in detail to a later blog post but recommend reading Google's blog on how this was constructed and the subsequent post on querying this and other crypto datasets. No prior experience with crypto is required for reading this blog post, but for those interested, the Introduction to Ethereum provides a useful overview. Google has documented a number of great queries on top of this dataset, which we reference later in the blog. We have collated equivalent ClickHouse and Redshift queries here and welcome contributions.
The dataset consists of four tables:
- Transactions - Cryptographically signed instructions from accounts, e.g. to transfer currency from one account to another
- Blocks - Batches of transactions with a hash of the previous block in the chain
- Traces - Internal transactions that allow querying all Ethereum addresses with their balances
- Contracts - Programs that run on the Ethereum blockchain
These tables represent a subset of the full data and address the most common queries, while providing significant volume. Since this dataset is not offered by AWS, it can be generated using the excellent Ethereum ETL tooling for which a PR has been submitted supporting ClickHouse as a destination. Alternatively, we have made a snapshot of this data available in the s3 bucket s3://datasets-documentation/ethereum/ for our users to explore as well as in our public playground which is kept up-to-date. A full up-to-date version of the data can also be found in the gcs bucket gs://clickhouse_public_datasets/ethereum.
Loading Data into Redshift #
For our examples, we assume the data has been loaded into Redshift. For those readers interested, we exported this data from BigQuery to S3 in Parquet format (where Google maintains an up-to-date copy) using BigQuery’s EXPORT capabilities. The full schemas can be found here and along with the full steps required to load the Parquet files. Parquet was chosen as it represents the most efficient format for Redshift.
Unfortunately, we were not able to use the COPY command for this task as either some columns could not be loaded (e.g., string lengths exceeding Redshift limits of 65k chars) or date conversion was required on load. Our examples thus use Redshift’s ability to query data in S3 via Spectrum with external tables used to expose the s3 files before inserting the data into the final tables via INSERT INTO SELECT (where subsets of columns can be selected and CAST).
Schemas were optimized using the ANALYZE COMPRESSION command to identify the most effective codecs. We utilized the same sorting keys as those established for queries in our earlier BigQuery post for this dataset.
ClickHouse vs Redshift Storage Efficiency #
For users interested in the details of data loading, and options for keeping ClickHouse and Redshift in sync, we have provided these below. To highlight the value of moving to ClickHouse, however, we first show a summary of the respective sizes of our above dataset in both systems. As of the time of writing, it's not possible to identify an uncompressed size for the data in Redshift - so we measure the compressed size for both only. For the full table schemas and codecs used, see the below section Migrating Redshift Tables to ClickHouse.
Measuring Redshift Table Size #
This information can be obtained with a simple query.
SELECT "table", size, tbl_rows, unsorted, pct_used, diststyle  FROM SVV_TABLE_INFO WHERE "table" = 'blocks'

?column?    size    tbl_rows    unsorted    pct_used
blocks      11005   16629116    0           0.0005
It is expected that the value of “unsorted” field is 0. If not, users can run a VACUUM command to sort any unsorted rows in the background and achieve more optimal compression. The value returned for size is in MB and can be compared to compressed storage in ClickHouse. The distribution style is also returned since this can impact total size. Our tables have all been configured with an AUTO value, Redshift is free to assign an optimal distribution style and adjust this based on table size. Aside from our smallest table, blocks, the EVEN distribution style is selected, which means that the data is sent round-robin across nodes. We applied the optimal compression algorithms for each column as identified by the ANALYZE COMPRESSION (see “Compression” below).
Below we capture Redshift storage statistics from the serverless instance.
| Table Name | Total Rows | Compressed size | Distribution style |
| blocks | 16629116 | 10.74GB | AUTO(KEY(number)) |
| contracts | 57394746 | 12.51GB | AUTO(EVEN) |
| transactions | 1874052391 | 187.53GB | AUTO(EVEN) |
| traces | 6377694114 | 615.46GB | AUTO(EVEN) |
Measuring ClickHouse Table Size #
Compressed table sizes in ClickHouse can be found with a query to the system.columns table.
SELECT
    table,
    formatReadableSize(sum(data_compressed_bytes)) AS compressed_size
FROM system.columns
WHERE database = 'ethereum'
GROUP BY table
ORDER BY sum(data_compressed_bytes) DESC

┌─table───────────┬─compressed_size─┬
│ traces          │ 339.95 GiB      │
│ transactions    │ 139.94 GiB      │
│ blocks          │ 5.37 GiB        │
│ contracts       │ 2.73 GiB        │
└─────────────────┴──────────────────
Comparison #
Below we compare the above measurements, also comparing to Parquet and computing a ClickHouse to Redshift storage ratio.
| Table | Parquet Size (using SNAPPY) | Redshift Size (Compressed) | ClickHouse Size (Compressed) | ClickHouse/Redshift ratio |
| transactions | 252.4 GiB | 187.53 GiB | 139.94 GB | 1.3 |
| blocks | 10.9 GiB | 10.74 GiB | 5.37 GB | 2 |
| traces | 710.1 GiB | 615.46 GiB | 339.95 | 1.8 |
| contracts | 16.0 GiB | 12.51 GiB | 2.73 GB | 4.6 |
| Total | 989.4 GiB | 826.24 GiB | 487.99 GiB | 2 |
As shown, ClickHouse compresses the data more efficiently than the optimal Redshift schema with a combined rate of 2x for this dataset.
Benchmarks #
To provide a comparison of query performance, we have performed the benchmarks detailed at benchmarks.clickhouse.com on a 2 node dc2.8xlarge cluster, which provides a total of 64 cores and 488GB RAM, using the steps outlined here. AWS recommends this node type for compute-intensive workloads on top of datasets under 1TB compressed. We compare the results below to a single ClickHouse Cloud node with 60 cores and 240GB RAM. The full methodology of this benchmark, which runs 42 queries over a 100m row web analytics dataset, is detailed in the repository. We present these results below which can also be accessed from here.
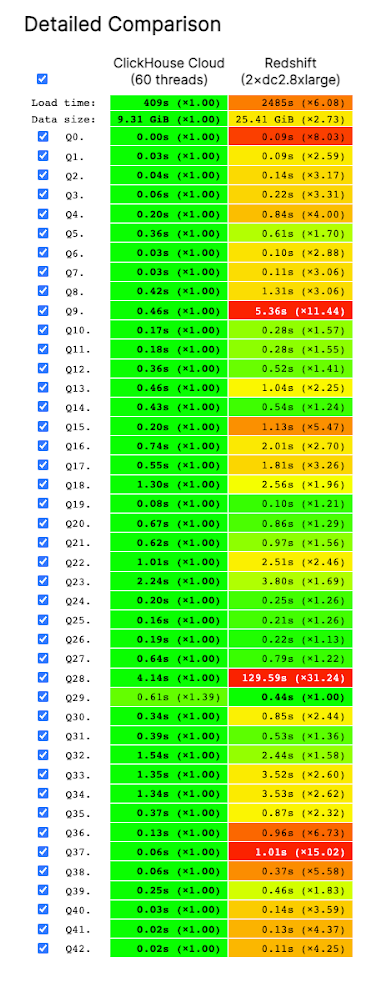
As shown, our 60 core ClickHouse Cloud node is on average 2.5x times faster than a comparative Redshift cluster. Feel free to explore other comparisons, where Redshift cluster resources are considerably higher.
Migrating Redshift Tables to ClickHouse #
Both Redshift and ClickHouse are built on top of columnar storage, so dealing with tables is similar in both systems.
Data Types #
Users moving data between ClickHouse and Redshift will immediately notice that ClickHouse offers a more extensive range of types, which are also less restrictive. While Redshift requires users to specify possible string lengths, even if variable, ClickHouse removes this restriction and burden from the user by storing strings without encoding as bytes. The ClickHouse String type thus has no limits or length specification requirements.
Furthermore, users can exploit Arrays, Tuples, and Enums - absent from Redshift as first-class citizens (although Arrays/Structs can be imitated with SUPER) and a common frustration of users. ClickHouse additionally allows the persistence, either at query time or even in a table, of aggregation states. This will enable data to be pre-aggregated, typically using a materialized view, and can dramatically improve query performance for common queries.
Below we map the equivalent ClickHouse type for each Redshift type:
| Redshift | ClickHouse |
| SMALLINT | Int8* |
| INTEGER | Int32* |
| BIGINT | Int64* |
| DECIMAL | UInt128, UInt256, Int128, Int256, Decimal(P, S), Decimal32(S), Decimal64(S), Decimal128(S), Decimal256(S) - (high precision and ranges possible) |
| REAL | Float32 |
| DOUBLE PRECISION | Float64 |
| BOOLEAN | Bool |
| CHAR | String, FixedString |
| VARCHAR** | String |
| DATE | Date32 |
| TIMESTAMP | DateTime, DateTime64 |
| TIMESTAMPTZ | DateTime, DateTime64 |
| GEOMETRY | Geo Data Types |
| GEOGRAPHY | Geo Data Types (less developed e.g. no coordinate systems - can be emulated with functions) |
| HLLSKETCH | AggregateFunction(uniqHLL12, X) |
| SUPER | Tuple, Nested, Array, JSON, Map |
| TIME | DateTime, DateTime64 |
| TIMETZ | DateTime, DateTime64 |
| VARBYTE** | String combined with Bit and Encoding functions |
* ClickHouse additionally supports unsigned integers with extended ranges i.e. UInt8, UInt32, UInt32 and UInt64.
**ClickHouse’s String type is unlimited by default but can be constrained to specific lengths using Constraints.
When presented with multiple options for ClickHouse types, consider the actual range of data and pick the lowest required.
Compression #
ClickHouse and Redshift support common compression algorithms, including ZSTD. Except for applying delta encoding to integer and date sequences, we typically find ZSTD is the most widely applicable compression algorithm and delivers the best results in most cases.
Redshift allows auto-detection of the best compression algorithm for each column when copying data with the COPY command, using the COMPUPDATE ON option (with some limitations on import data type, e.g. not supported for Parquet). We typically find this also suggests ZSTD for most columns, aligning with our own findings. Alternatively, the user can request an optimal schema with an estimation of the projected space savings via the ANALYZE COMPRESSION command. We apply these recommendations to all of our table schemas.
Currently, codecs in ClickHouse must be specified when creating tables. These can, however, be combined (e.g., CODEC(Delta, ZSTD)). Furthermore, ClickHouse allows these compression algorithms to be tuned, usually sacrificing compression or decompression speed for increased space savings (e.g. ZSTD(9) offers higher reduction rates than ZSTD(3) at the cost of slower compression, but largely consistent decompression performance at query time). This increased tunability helps ClickHouse achieve higher compression rates.
Sorting Keys #
Both ClickHouse and Redshift have the concept of a “sorting key”, which defines how data is sorted when being stored. Redshift defines the sorting key using the SORTKEY clause:
CREATE TABLE some_table(...) SORTKEY (column1, column2)
Comparatively, ClickHouse uses an ORDER BY clause to specify the sort order:
CREATE TABLE some_table(...) ENGINE = MergeTree ORDER BY (column1, column2)
In most cases, users can use the same sorting key columns and order in ClickHouse as Redshift, assuming you are using the default COMPOUND type. When data is added to Redshift, you should run a VACUUM and ANALYZE commands to re-sort newly added data and update the statistics for the query planner - otherwise, the unsorted space grows. No such process is required for ClickHouse.
Redshift supports a couple of convenience features for sorting keys. One is automatic sorting keys (using SORTKEY AUTO), which may be appropriate for getting started, but explicit sorting keys ensure the best performance and storage efficiency when the sorting key is optimal. The other is the INTERLEAVED sort key, which gives equal weight to a subset of columns in the sort key to improve performance when a query uses one or more secondary sort columns. ClickHouse supports explicit projections, which achieve the same end result with a slightly different setup.
Users should be aware that the “primary key” concept represents different things in ClickHouse and Redshift. In Redshift, the primary key resembles the traditional RDMS concept intended to enforce constraints. However, they are not strictly enforced in Redshift and instead act as hints for the query planner and data distribution among nodes. In ClickHouse, the primary key denotes columns used to construct the sparse primary index, used to ensure the data is ordered on disk, maximizing compression while avoiding pollution of the primary index and wasting memory.
Example Table #
In this example, we assume our data is only present in Redshift, and we are unfamiliar with the equivalent ClickHouse Ethereum schemas. The current schema for any Redshift table can be retrieved with the following query:
SHOW TABLE <schema>.<table>
For example, for the blocks table:
CREATE TABLE public.blocks (
        number bigint NOT NULL ENCODE zstd distkey,
        hash character(66) ENCODE zstd,
        parent_hash character(66) ENCODE zstd,
        nonce character(18) ENCODE zstd,
        sha3_uncles character(66) ENCODE zstd,
        logs_bloom character(514) ENCODE zstd,
        transactions_root character(66) ENCODE zstd,
        state_root character(66) ENCODE zstd,
        receipts_root character(66) ENCODE zstd,
        miner character(42) ENCODE zstd,
        difficulty numeric(38, 0) ENCODE az64,
        total_difficulty numeric(38, 0) ENCODE az64,
        SIZE bigint ENCODE zstd,
        extra_data CHARACTER varying(66) ENCODE zstd,
        gas_limit bigint ENCODE zstd,
        gas_used bigint ENCODE zstd,
        timestamp timestamp WITHOUT TIME ZONE ENCODE RAW,
        transaction_count bigint ENCODE zstd,
        base_fee_per_gas bigint ENCODE zstd,
PRIMARY KEY (number)) DISTSTYLE AUTO SORTKEY (timestamp);
The full Redshift schemas can be found here. For some tables, columns have been dropped from the original dataset before inserting into Redshift, because their length exceeds the 65k maximum for a Redshift string, e.g. input column of transactions.
The schema for blocks and statements to create the equivalent table in ClickHouse is shown below. If no codec is specified, ZSTD(1) is used as the compression algorithm, since that is the default setting in ClickHouse Cloud.
CREATE TABLE blocks
(
    `number` UInt32 CODEC(Delta(4), ZSTD(1)),
    `hash` String,
    `parent_hash` String,
    `nonce` String,
    `sha3_uncles` String,
    `logs_bloom` String,
    `transactions_root` String,
    `state_root` String,
    `receipts_root` String,
    `miner` String,
    `difficulty` Decimal(38, 0),
    `total_difficulty` Decimal(38, 0),
    `size` UInt32 CODEC(Delta(4), ZSTD(1)),
    `extra_data` String,
    `gas_limit` UInt32 CODEC(Delta(4), ZSTD(1)),
    `gas_used` UInt32 CODEC(Delta(4), ZSTD(1)),
    `timestamp` DateTime CODEC(Delta(4), ZSTD(1)),
    `transaction_count` UInt16,
    `base_fee_per_gas` UInt64
)
ENGINE = MergeTree
ORDER BY timestamp
We have made basic optimizations to these schemas with appropriate types and codecs to minimize storage. For instance, we don't make columns Nullable, despite them being so in the original schema, because for most queries, there is no need to distinguish between the default value and the Null value. By using default values, we avoid additional UInt8 column overhead associated with Nullable. Otherwise, we kept many of the defaults, including using the same ORDER BY key as Redshift.
You can run an additional query to identify the data range and cardinality, allowing you to select the most optimal ClickHouse type. The blog “Optimizing ClickHouse with Schemas and Codecs” offers a deeper look at this topic. We leave full analysis of schema optimization to a later blog dedicated to this dataset.
SELECT
 MAX(number) AS max_number,
 MIN(number) AS min_number,
 MAX(size) AS max_size,
 MIN(size) AS min_size
FROM blocks

max_number    min_number    max_size    min_size
16547585      0             1501436     514
Getting data from Redshift to ClickHouse #
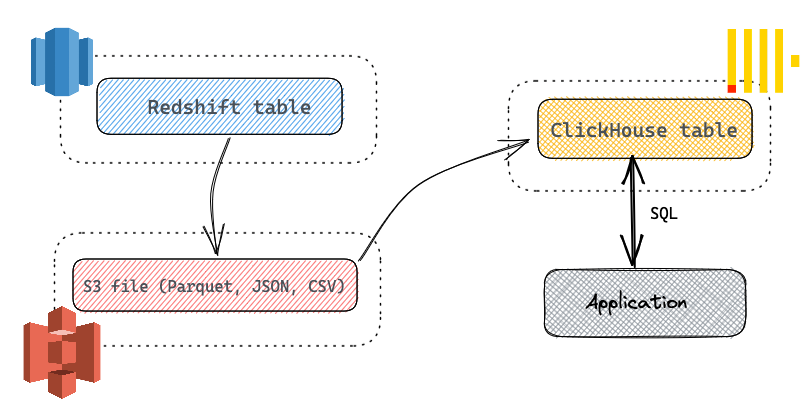
Redshift supports exporting data to S3 via the UNLOAD command. Data can, in turn, be imported into ClickHouse using the s3 table function. This "pivot" step approach has a number of advantages:
- Redshift UNLOAD functionality supports a filter for exporting a subset of data via standard SQL query.
- Redshift supports exporting to Parquet, JSON, and CSV formats and several compression types - all supported by ClickHouse.
- S3 supports object lifecycle management, allowing data that has been exported and imported into ClickHouse to be deleted after a specified period.
- Exports produce multiple files automatically, allowing export to be parallelized, limiting each to a maximum of 6.2GB. This is beneficial to ClickHouse, since it allows imports to be parallelized. This parallelization is done at the slice level, with each slice generating one or more files.
- AWS does not charge for unloading data to S3, provided RedShift and the bucket are in the same region. Users, however, will still pay for compute resources consumed by the data export query (if using Redshift Serverless) and storage costs in S3.
Exporting Data from Redshift to S3 #
To export data from a Redshift table to a file in an S3 bucket, make sure you have created the bucket and given Redshift the permission to access it. We can use the UNLOAD command to export data from a Redshift table. It is possible to restrict the export to a subset of columns using the SELECT statement:
UNLOAD ('SELECT * FROM some_table')
TO 's3://my_bucket_name/some_table_'
iam_role 'arn:aws:...' PARQUET
ALLOWOVERWRITE
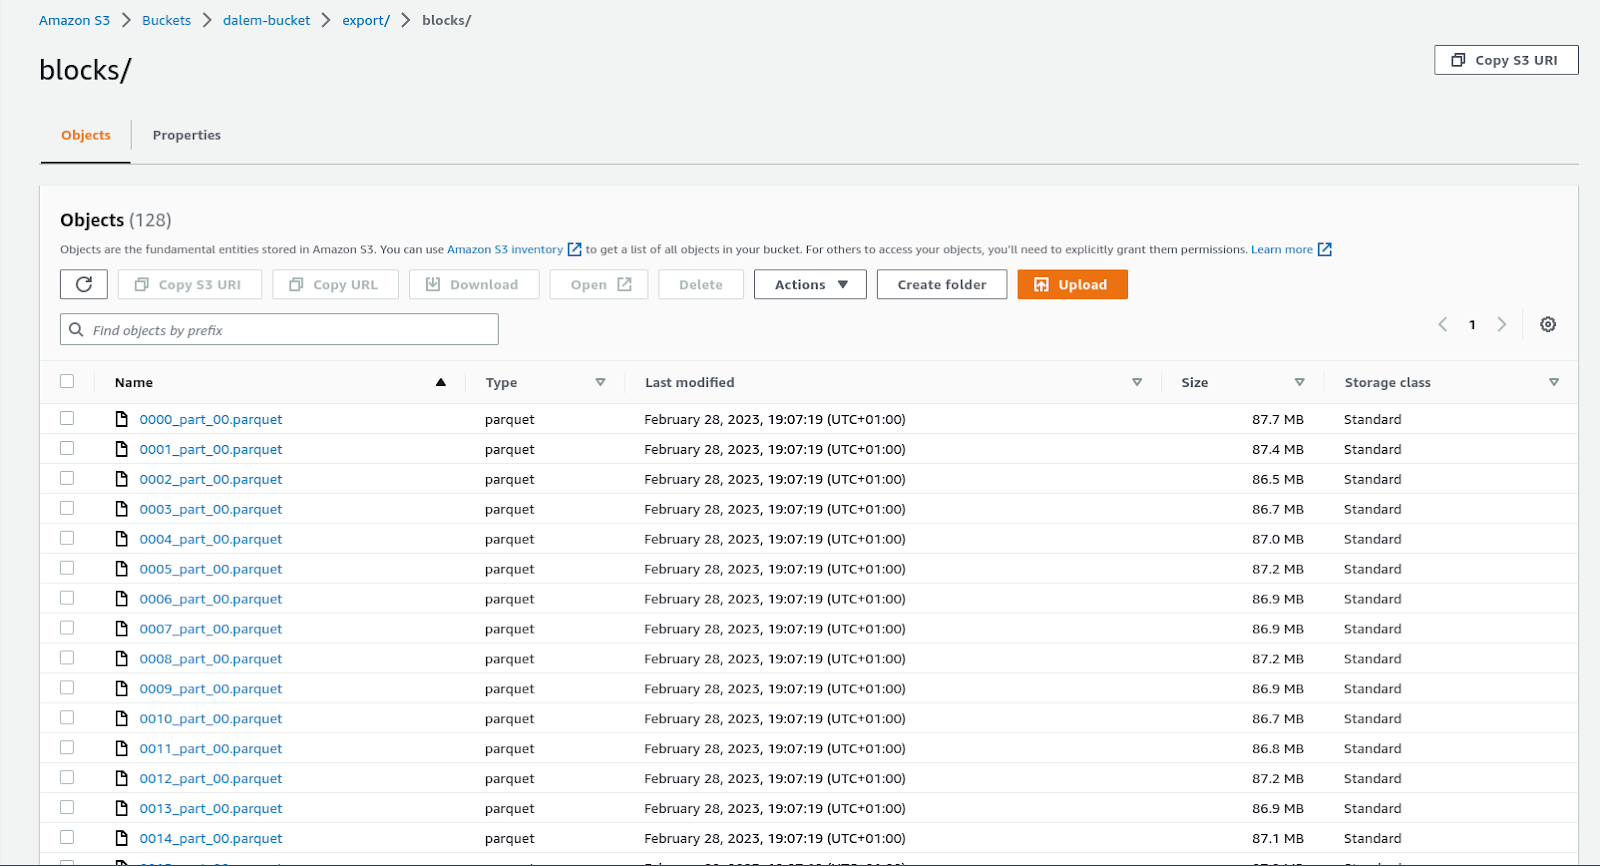
We used the column-oriented Parquet file format for export, because it is a good choice in terms of storage efficiency and export speed (2x other formats), and is optimized for reading by ClickHouse. The time taken for this operation depends on the resources (and slices) assigned to the Redshift cluster as well as region locality. We utilize the same region for both S3 and Redshift for the export to maximize throughput and costs. The export timings for each of our tables are shown below for a provisioned and a serverless (limited to 128 RPUs) Redshift cluster. We utilize the setting MAXFILESIZE to limit Parquet file size to 100MB for block data, given its smaller size. This allows exports to be parallelized by Redshift as well as assisting with ClickHouse imports. For all other tables, we rely on the default file partitioning, which creates multiple files using 6.2GB as an upper limit.
| Table | Number of Files | Parquet Size (GB) | Redshift Serverless (128 RPUs) | Redshift (2xdc2.8xlarge) | |
| Blocks | 128 | 10.9GiB | 4.9s | 18.4s | |
| Contracts | 128 | 16.0 GiB | 2m 43.9s | 22.5s | |
| Transactions | 128 | 252.4 GiB | 4m 40s | 10m 14.1s | |
| Traces | 128 | 710.1 GiB | 5m 36.1s | 29m 37.8s |
An observant reader will notice that we have 128 files for all types. This is due to Redshift parallelizing at the slice level (this seems to be equivalent to an RPU for UNLOAD), with each slice producing at least one file, or multiple if the file exceeds 6.2GB. The serverless instance here has significantly more resources (around 256 cores) available, which attributes to the much faster export time.
Importing Data from S3 into ClickHouse #
We load data from S3 into ClickHouse with the s3 function. We pre-create the table before running the following INSERT INTO the blocks table.
SET parallel_distributed_insert_select = 1
INSERT INTO blocks
SELECT * FROM s3Cluster('default', 'https://dalem-bucket.s3.eu-west-1.amazonaws.com/export/blocks/*.parquet')

0 rows in set. Elapsed: 14.282 sec. Processed 16.63 million rows, 19.26 GB (1.16 million rows/s., 1.35 GB/s.)
We utilize the function s3Cluster, which is a distributed variant of the s3 function. This allows the full cluster resources in ClickHouse Cloud to be utilized for reading and writing. The setting parallel_distributed_insert_select=1 ensures that insertion is parallelized and data is inserted into the same node from which it is read, skipping the initiator node on writes. We don’t provide authentication keys, because the bucket we use is public, but private buckets are supported.
In some cases, you will need to map exported Parquet columns to equivalent ClickHouse data types. For example, Redshift does not support Arrays. For columns such as function_sighashes, an array in the original dataset, these have been represented in Redshift as type SUPER. This has no equivalent representation in Parquet and this column is exported as a String. Below we map this back to an Array type in ClickHouse.
INSERT INTO contracts
SELECT
    address,
    bytecode,
    replaceAll(ifNull(function_sighashes, '[]'), '"', '\'') AS function_sighashes,
    is_erc20,
    is_erc721,
    block_timestamp,
    block_number,
    block_hash
FROM s3Cluster('default', 'https://datasets-documentation.s3.eu-west-3.amazonaws.com/ethereum/contracts/*.parquet')

0 rows in set. Elapsed: 21.239 sec. Processed 57.39 million rows, 58.11 GB (2.70 million rows/s., 2.74 GB/s.)
We repeated this exercise for each of the tables, recording the timings below. Using this method, we were able to transfer ~1TB and 8.3 billion rows from Redshift to ClickHouse in less than 35 minutes.
| Table | Rows | Data Size (Parquet) | Redshift Export | ClickHouse Import |
| blocks | 16629116 | 10.9GiB | 4.9s | 14.28 s |
| contracts | 57394746 | 16.0 GiB | 2m 43.9s | 21.24 s |
| transactions | 1874052391 | 252.4 GiB | 4m 40s | 5 mins, 15 s |
| traces | 6377694114 | 710.1 GiB | 5m 36.1s | 15 mins 34 s |
| Total | 8.32 billion | 990GB | 13m 5secs | 21m 25s |
Handling New Data #
The above approach works well for bulk-loading data static datasets or the historical data of a dynamic corpus. However, it does not address cases where Redshift tables are receiving new data continuously, which needs to be exported to ClickHouse.
Assumptions #
For the remainder of this blog, we assume that:
- Data is append-only and immutable. There is no requirement to selectively update rows, though dropping older data is expected and described below.
- Either a time dimension or an incrementing numeric identifier exists on the data that allows new rows for copying to ClickHouse to be identified.
These assumptions are consistent with requirements for real-time analytical datasets we commonly see migrating to ClickHouse. For example, when users choose to keep data in sync between Redshift and ClickHouse, they typically synchronize the most recent dataset based on a time dimension. Our example dataset inherently satisfies these properties, and we use the block timestamp for synchronization purposes.
Scheduling Exports #
The simplest solution is to schedule periodic UNLOAD queries to identify any new rows and export these to S3 for insertion into ClickHouse. This approach is easy to implement and maintain. It assumes our data is immutable, with only rows added, and having a property (usually a timestamp) that can be used to identify new data. For our example, suppose we schedule an export every hour of the last 60 minutes of data. This further assumes new rows will be inserted in real time with no delays. In most cases, this is unlikely, with new rows having some delay and offset from the current time. Every time we run an export, we need to export rows from a window offset from the current time. For example, suppose we were confident our data would be available within 15 minutes. We would in turn export all rows from <scheduled_time>-75mins to <scheduled_time>-15mins.
This approach relies on data being reliably inserted to Redshift within 15 minutes.
Redshift Native #
Redshift supports native scheduled query functionality, but it is not a viable choice for our purposes. First, it does not support the ability to reference scheduled time needed for our offset calculation. Second, this functionality is only provided for provisioned and not serverless clusters. Using Redshift native scheduling may be sufficient for users who want to perform periodic table export independent of the scheduled time. For example, users with smaller datasets could export all rows periodically and overwrite the whole dataset, but this is not practical for the larger datasets.
Using Amazon EventBridge #
Amazon EventBridge is a serverless event bus that connects apps and services in AWS. For our purposes, we are interested specifically in the Amazon EventBridge Scheduler, which allows us to create, run, and manage scheduled tasks centrally via APIs.
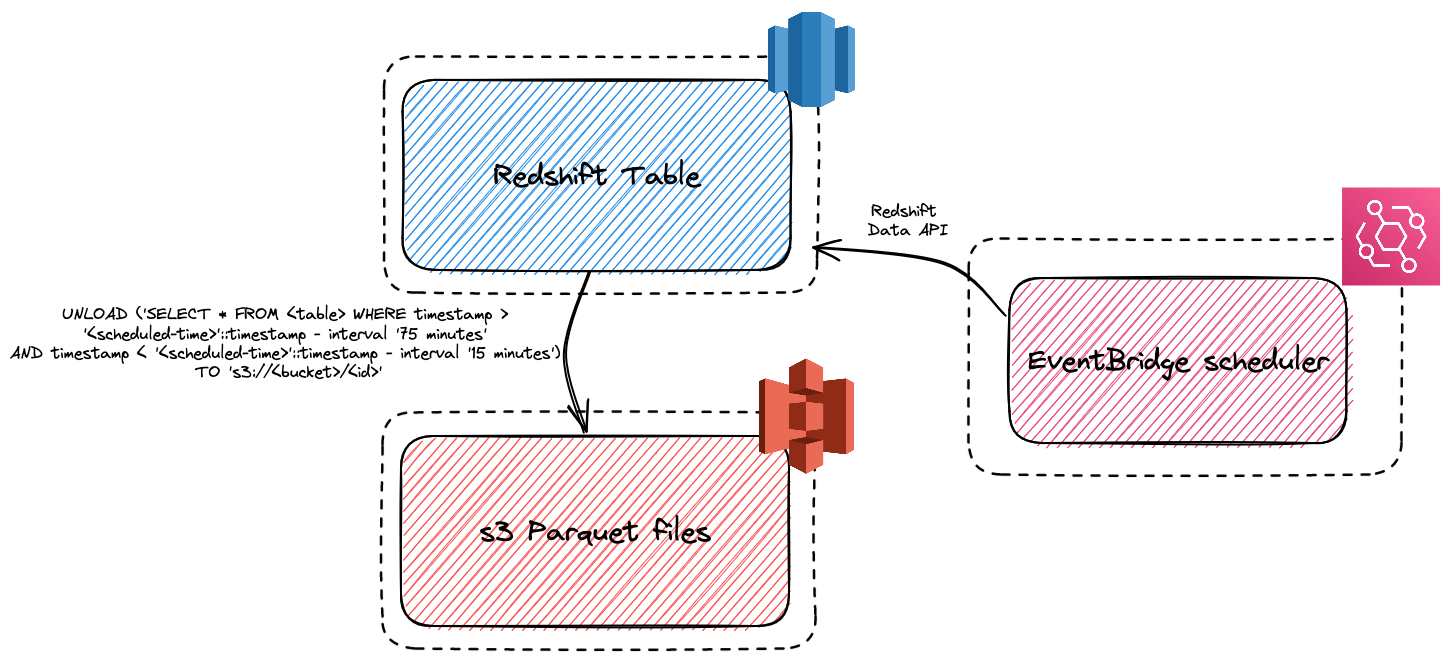
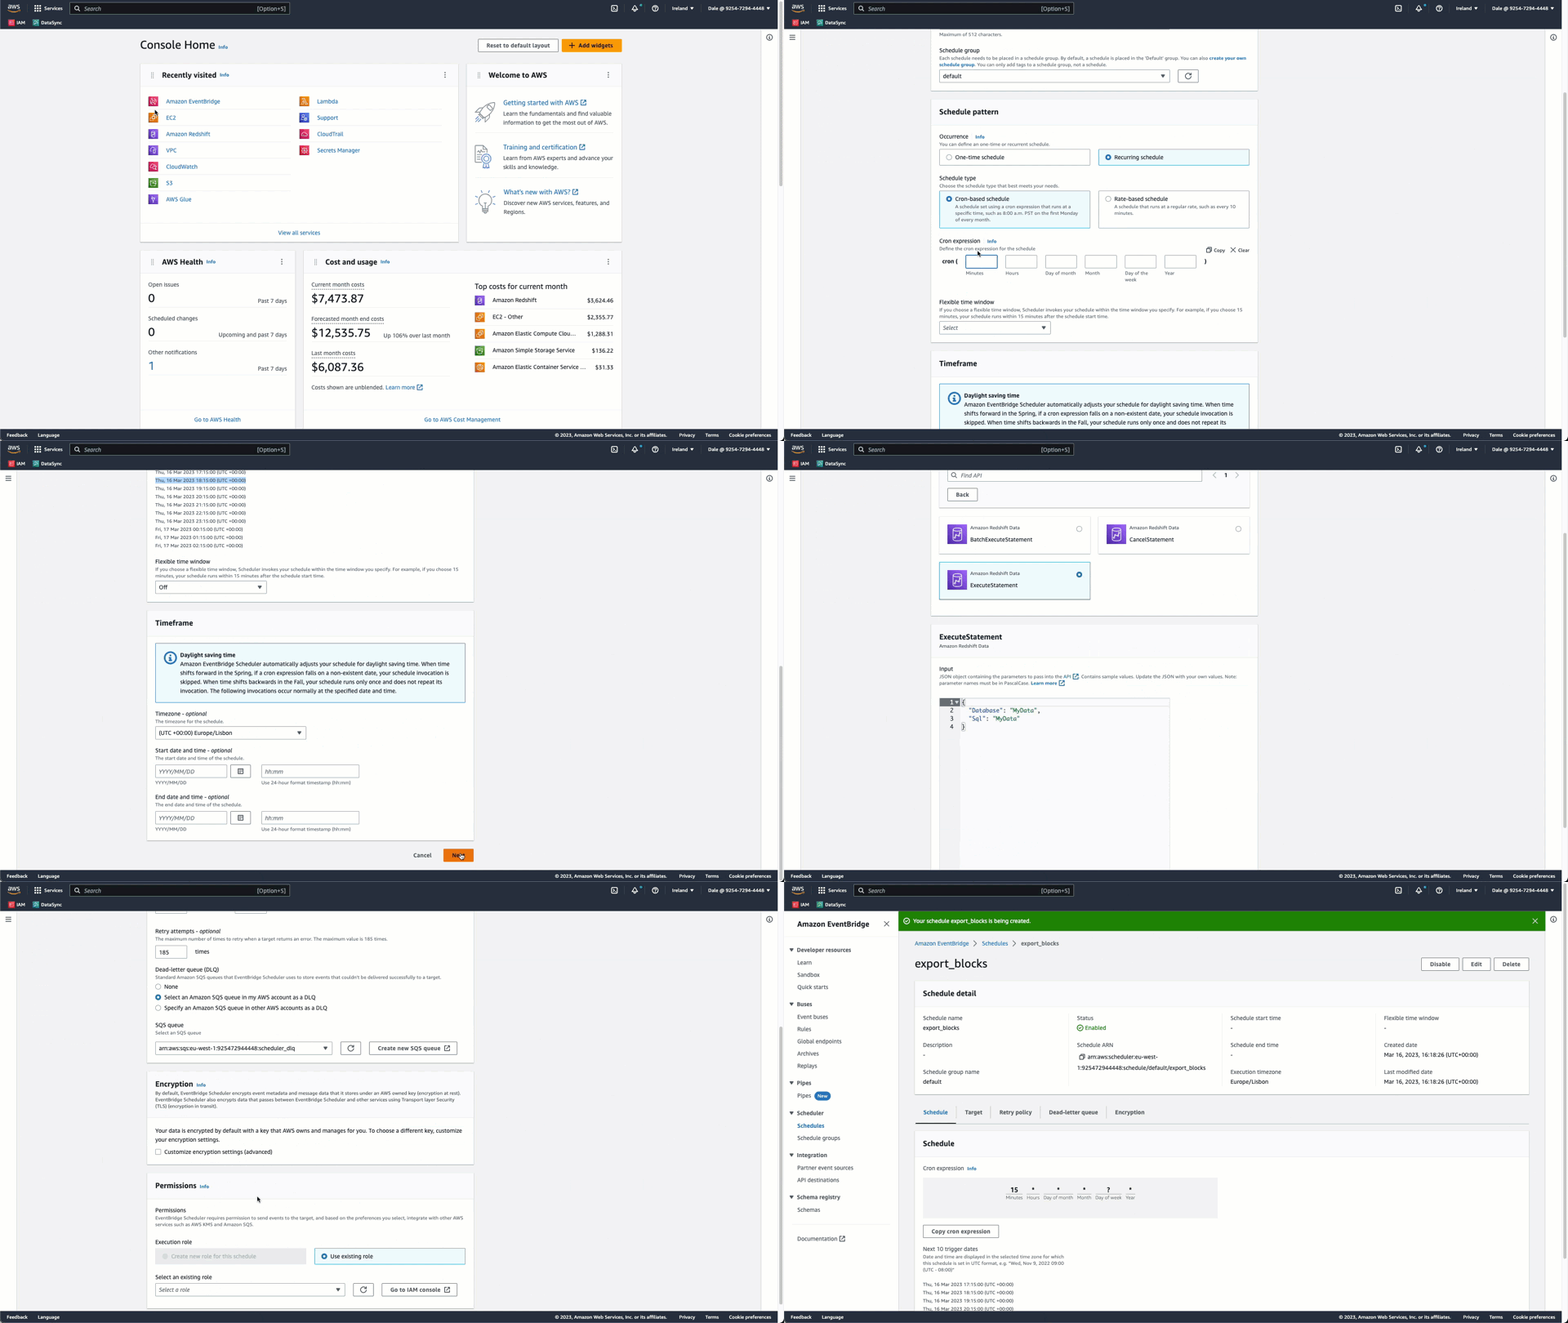
In order to schedule an UNLOAD query with the EventBridge scheduler, configure the appropriate execution role and ensure the role under which the schedule executes has the correct permissions for the Redshift Data API, the ability to run ExecuteStatement commands, and the permission to run an UNLOAD query to export data to S3. To assist with debugging, users will also need the permission to create a Dead-letter queue (DLQ) queue in SQS, to which messages will be sent in the event of a failure. Schedules can be created using either the console, SDKs, or the AWS CLI. Our schedule depends on the ability of Amazon EventBridge to run ExecuteStatement commands against the Redshift Data API. We show the creation of a schedule below that exports all rows from the window <scheduled_time>-75mins to <scheduled_time>-15mins.
The following important components of this schedule:
- We use a cron-based schedule to run periodically at 15 minutes past the hour using the expression
15 * * * ? *i.e. There is no flexibility in this execution. - The schedule utilizes the
Redshift Data APIandExecuteCommandendpoint. The JSON payload for this API is shown below:
{
  "Database": "dev",
  "ClusterIdentifier": "redshift-cluster-1",
  "Sql": "UNLOAD ('SELECT * FROM blocks WHERE timestamp > \\'<aws.scheduler.scheduled-time>\\'::timestamp - interval \\'75 minutes\\' AND timestamp < \\'<aws.scheduler.scheduled-time>\\'::timestamp - interval \\'15 minutes\\'') TO 's3://datasets-documentation.s3.eu-west-3.amazonaws.com/ethereum/incremental/blocks/<aws.scheduler.execution-id>' iam_role 'arn:aws:iam::925472944448:role/RedshiftCopyUnload' PARQUET MAXFILESIZE 200MB ALLOWOVERWRITE",
  "DbUser": "awsuser"
}
- Here we execute against our
devdatabase in a provisioned cluster in thedefaultworkgroup. If this was a serverless cluster, we would specify theWorkgroupNameinstead of theClusterIdentifier.DbUserassumes the use of temporary credentials. EventBridge also supports the use of AWS Secrets Manager for authentication. - The above payload uses the UNLOAD command to export all rows from the blocks table, which satisfy a specific time range, to a dedicated s3 bucket in Parquet format. We inject the scheduled time (the actual execution time may vary) via [the context attribute
<aws.scheduler.scheduled-time>and perform data math in our WHERE clause to shift to the required time range i.e.WHERE timestamp > '<aws.scheduler.scheduled-time>'::timestamp - interval '75 minutes' AND timestamp < '<aws.scheduler.scheduled-time>'::timestamp - interval '15 minutes' - The context
<aws.scheduler.execution-id>is used to provide a prefix to exported files. This will be unique for each schedule invocation, thus avoiding file collisions. - We select a SQS DLQ to send events in the event of failure.
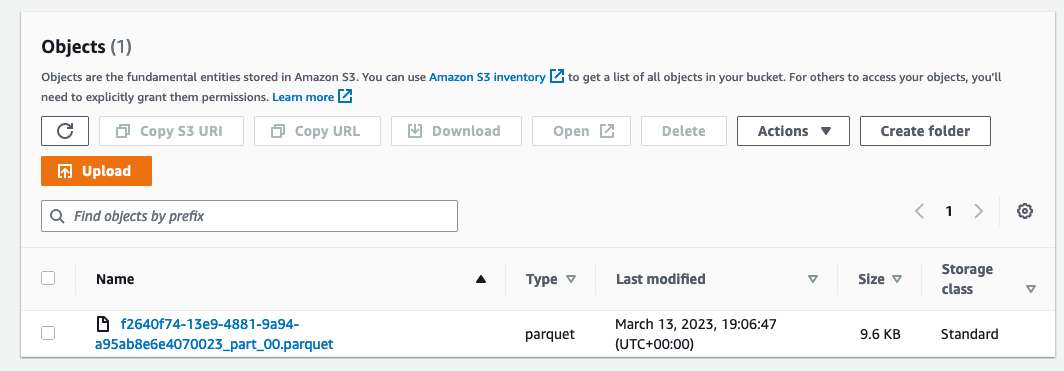
To test this schedule, we can insert a row into our blocks table with an adjusted timestamp that matches the next period and wait for the export.
INSERT INTO blocks(number,hash,parent_hash,nonce,sha3_uncles,logs_bloom,transactions_root,state_root,receipts_root,miner,difficulty,total_difficulty,size,extra_data,gas_limit,gas_used,timestamp,transaction_count,base_fee_per_gas) VALUES(99999999,'','','','','value','','','','',0,58750003716598356000000,74905,'',30000000,13141664,'2023-03-13 18:00:00',152,326697119799)
Scheduling Import #
Our previous export file has the execution id as a prefix. While this avoids collisions, it does not allow us to identify the time range covered by a file using its name. All these files must therefore be scanned to identify the rows for import. As the number of files grows, users should expire files to avoid ever the cost of this query growing.
At the time of writing, ClickHouse does not have a built-in way of scheduling imports (proposal is in discussion). We explore options for periodically importing these files externally below.
External Script #
For an initial simple approach, and to illustrate the logic, the following bash script can be run by a cron job periodically after exports are completed. This script first grabs the current maximum date in ClickHouse, before issuing an INSERT INTO blocks SELECT * FROM s3(<bucket with export files>) WHERE timestamp > ${max_date} query. This example handles the blocks table but can easily be adapted to the other tables. This approach has the advantage that it can be run independently of export as often as required, but assumes the availability of clickhouse-client in any container or self-managed environment. We leave scheduling as an exercise for the reader.
#!/bin/bash

max_date=$(clickhouse-client --query "SELECT toInt64(toStartOfHour(toDateTime(max(block_timestamp))) + toIntervalHour(1)) AS next FROM ethereum.transactions");
Clickhouse-client –query "INSERT INTO blocks SELECT * FROM s3('https://datasets-documentation.s3.eu-west-3.amazonaws.com/ethereum/incremental/blocks/*.parquet') WHERE timestamp >= ${max_date}"
Using AWS Lambda #
AWS Lambda is an event-driven, serverless computing platform provided by Amazon as a part of Amazon Web Services. It is a computing service that runs code in response to events and automatically manages the computing resources required by that code.
This service can be used to periodically execute the following simple python script, which replicates the above bash logic in Python.
import requests
import json
CLICKHOUSE_HOST = '<host inc port>'
CLICKHOUSE_PASSWORD = '<password>'
CLICKHOUSE_TABLE = blocks'
TIME_COLUMN = 'timestamp'

def lambda_handler(event, context):
   s = requests.Session()
   s.auth = ('default', CLICKHOUSE_PASSWORD)
   response = s.get(f'https://{CLICKHOUSE_HOST}',
                    params={'query': f'SELECT max({TIME_COLUMN}) as max FROM {CLICKHOUSE_TABLE} FORMAT JSONEachRow'})
   max_time = response.json()['max']
   print(max_time)
   insert_query = f"INSERT INTO {CLICKHOUSE_TABLE} SELECT * FROM " \
                  f"s3('https://datasets-documentation.s3.eu-west-3.amazonaws.com/ethereum/incremental/blocks/*.parquet') " \
                  f"WHERE timestamp > '{max_time}'"
   response = s.post(f'https://{CLICKHOUSE_HOST}/?', params={'query': ''}, data=insert_query)
   return f'done. written {json.loads(response.headers["X-ClickHouse-Summary"])["written_rows"]} rows'
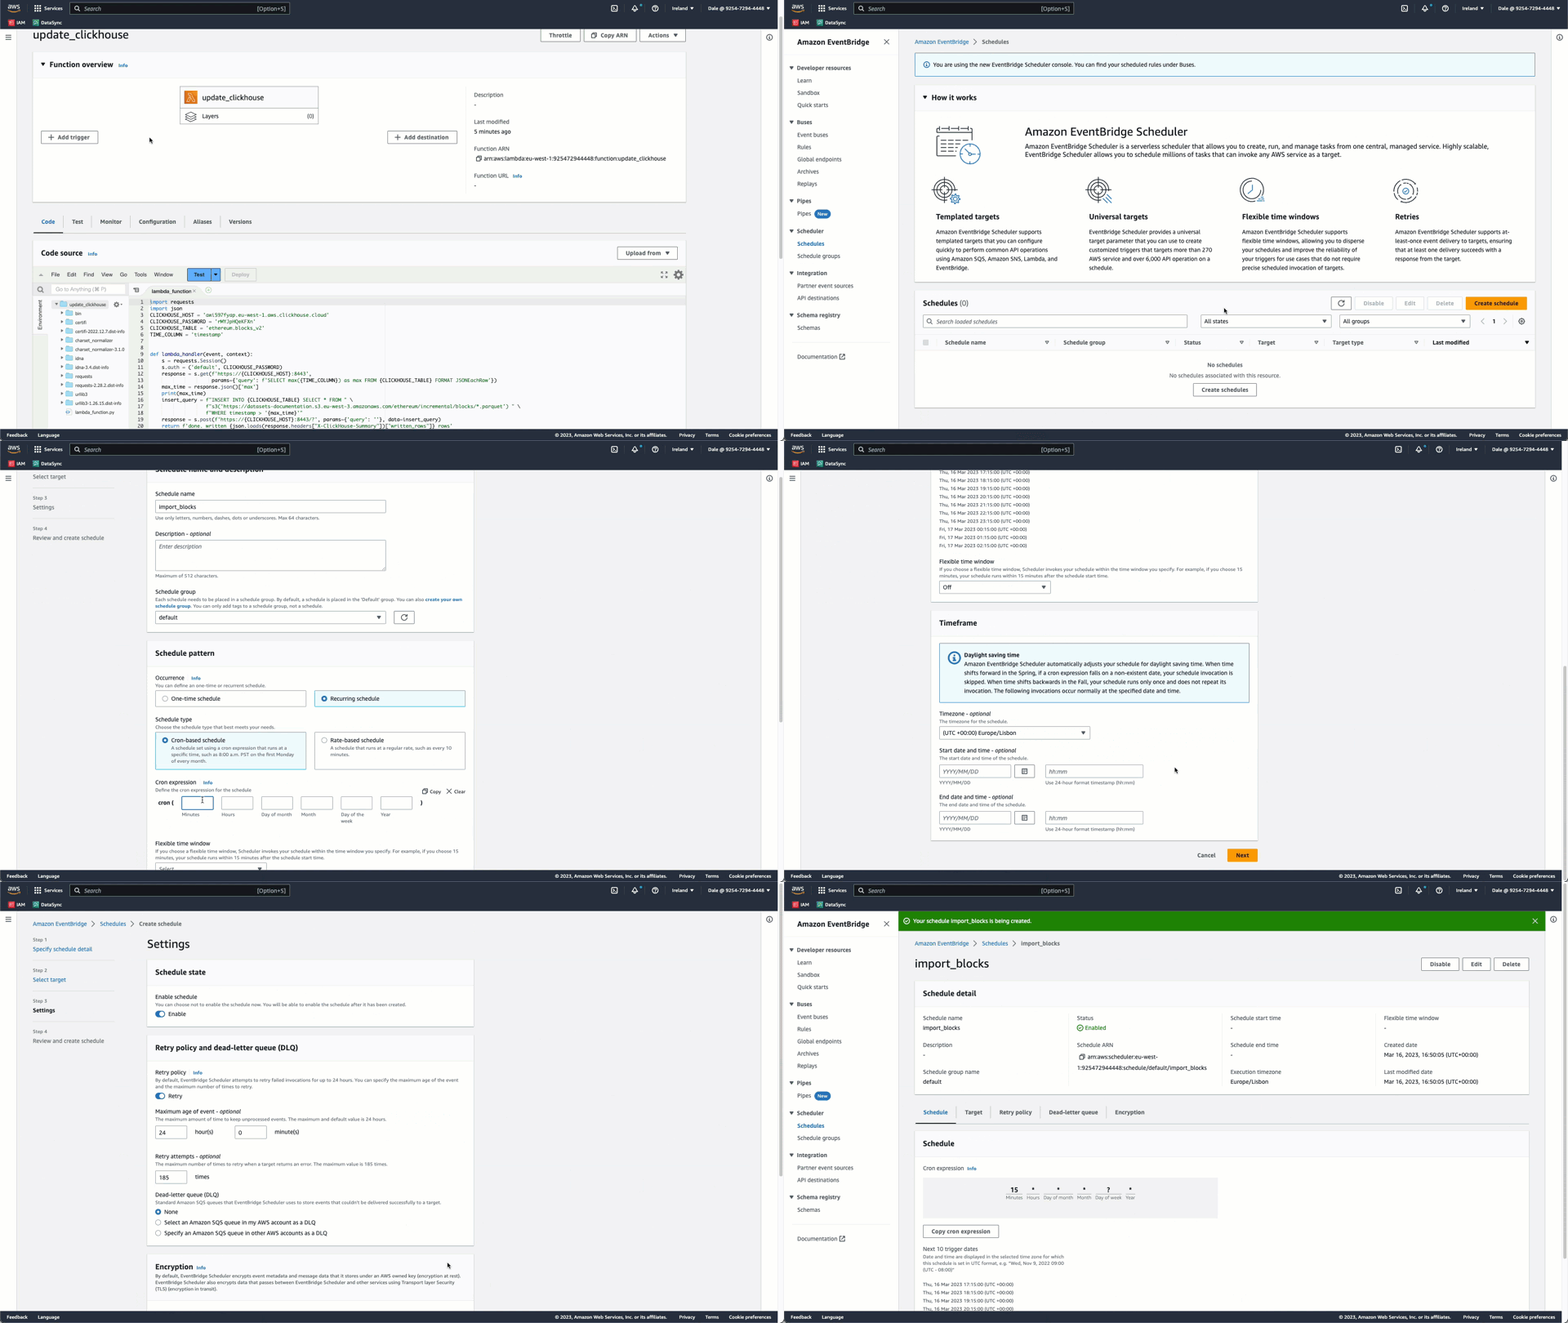
This script can be packaged and uploaded to AWS Lambda, along with the packaged requests dependency. AWS EventBridge can in turn be configured to schedule the Lambda function at the required interval - we show this below:
This import not only relies on the latest timestamp in ClickHouse, and can thus run independently of the earlier export but also offloads all work to ClickHouse via INSERT INTO SELECT. This script contains the username and password for ClickHouse Cluster. We would recommend any production deployment of this code be enhanced to utilize AWS Secrets Manager for secure storage and retrieval of these credentials.
Using AWS EventBridge #
We didn't use AWS EventBridge to handle the import for the following reasons. Initially, we intended to achieve this using an EventBridge API destination since this capability allows connections to external services over HTTP with Basic Auth. An EventBridge rule would be triggered off the export schedule and send the following query to ClickHouse, utilizing the $.time variable exposed in the job (this is the scheduled time of the export). However, data-changing queries in ClickHouse must be sent via a POST request. Currently, rule targets in EventBridge will either send the request body (a query) in either JSON or quoted-string format. This is not supported by ClickHouse. We are exploring the possibility of supporting an official ClickHouse Event Source.
Filling Gaps in Data #
If we perform the bulk import and then schedule the above import and export queries, we will invariably have a “gap” in our data for the period between the bulk load completion and the incremental load starting. To address this we can use the same technique as documented in our Using ClickHouse to Serve Real-Time Queries on Top of BigQuery Data blog post (see “Filling Gaps”).
Using AWS Glue for Streaming Data between Redshift and ClickHouse #
The above approaches assume a batch update process that requires export and import steps to be orchestrated correctly. Utilizing AWS Glue, we can avoid this two-step process and encapsulate this logic in a single ETL job.
AWS Glue is a serverless data integration service that makes it easy for users to extract, transform, and load data between multiple sources. While this would allow users to move data from Redshift to ClickHouse, potentially without writing code, AWS Glue does not support a connector for ClickHouse yet. However, it does support the ability to execute Python shell scripts, so we can stream data between the systems using the boto3 library for reading rows from Redshift and the clickhouse-connect library for sending data to ClickHouse.
A tested python script implementing this concept can be found here. This identifies the current maximum date in ClickHouse before requesting rows greater than this time from Redshift. The script paginates through the results, formulating batches for efficiency before inserting them into ClickHouse. Once all rows have been consumed and inserted, the script completes.
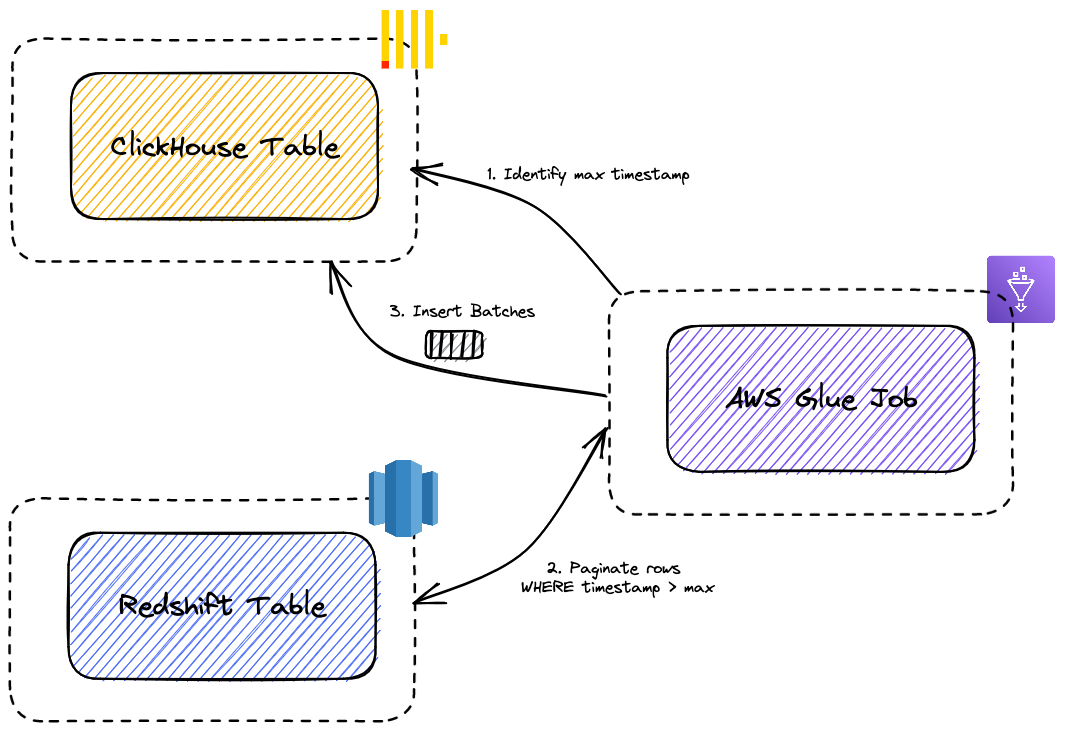
AWS Glue requires an IAM role to be associated with the execution of the script. Beyond the standard permissions, ensure this role has access to your Redshift cluster and is able to use temporary credentials as required by the ExecuteStatement command. The example below reads from a provisioned cluster but can be modified to connect a serverless cluster if required.
We highlight the commands to deploy the provided script to AWS Glue below. You need to specify the additional-python-modules parameter to ensure the clickhouse-connect dependency (boto3 is made available by default) is installed.
aws glue create-job --name clickhouse-import  --role AWSGlueServiceRoleRedshift --command '{"Name" :  "pythonshell", "ScriptLocation" : "s3://<bucket_path_to_script>"}' --default-arguments '{"--additional-python-modules", "clickhouse-connect"}'

{
    "Name": "clickhouse-import"
}

aws glue start-job-run --job-name "clickhouse-import"
{
    "JobRunId": "jr_a1fbce07f001e760008ded1bad8ee196b5d4ef48d2c55011a161d4fd0a39666f"
}
AWS Glue natively supports the scheduling of these scripts through simple cron expressions. Users are also again recommended to store ClickHouse cluster credentials in AWS Secret Manager, which is supported in AWS Glue vs. in the script. These can be retrieved using the boto3 library provided the required IAM permissions are configured.
This same approach could also be implemented in an AWS Lambda function or using an AWS Glue spark or streaming ETL job.
Dropping Older Data in ClickHouse #
For most deployments, ClickHouse’s superior data compression means that you can store data in a granular format for long periods. For our specific Ethereum dataset, this is probably not particularly beneficial since we likely need to preserve the full history of the blockchain for many queries, e.g., computing account balances.
However, there are simple and scalable approaches to dropping older data that may be applicable to other datasets should you wish to only keep a subset in ClickHouse. For instance, it is possible to use TTL features to expire older data in ClickHouse at either a row or column level. This can be made more efficient by partitioning the tables by date, allowing the efficient deleting of data at set intervals. For the purposes of example, we have modified the schema for the blocks table below to partition by month. Rows older than five years are, in turn, expired efficiently using the TTL feature. The set setting ttl_only_drop_parts ensures a part is only dropped when all rows in it are expired.
CREATE TABLE blocks
(
...
)
ENGINE = MergeTree
PARTITION BY toYYYYMM(timestamp)
ORDER BY timestampcoindesk
TTL timestamp + INTERVAL 60 MONTH DELETE
SETTINGS ttl_only_drop_parts=1
Partitioning can both positively and negatively impact queries and should be more considered a data management feature than a tool for optimizing query performance.
ClickHouse vs Redshift Query Comparison #
This dataset warrants an entire blog on possible queries. The author of the etherium-etl tool has published an excellent list of blogs focused on insights with respect to this dataset. In a later blog, we’ll cover these queries and show how they can be converted to ClickHouse syntax and how some can be significantly accelerated. Here we extract similar queries from the popular crypto visualization site dune.com.
Some important considerations:
- Table schemas are available here. We utilize the same ordering key for both and use the Redshift-optimized types described earlier.
- Redshift and ClickHouse both provide query result caching capabilities. We disable these explicitly for these tests to provide a measurement of performance for cache misses. Redshift also benefits from compiling and caching the query plan after the first execution. Given this cache is unlimited, we thus run each query twice as recommended by Amazon.
- We utilize the
psqlclient for issuing queries to Redshift. This client isn’t officially supported, although timings are consistent with the UI. Users can also use the RSQL client for issuing queries. - These queries are executed using the same hardware as our earlier benchmark
- ClickHouse Cloud node has 60 cores with 240GB RAM.
- Redshift instance is a provisioned instance consisting of 2xdc2.8xlarge nodes, providing a total of 64 cores and 488GB RAM. This is the recommended node type for compute-intensive workloads for datasets under 1TB compressed.
Ethereum Gas Used by Week #
This week has been adapted from this Dune visualization. For an explanation of Gas see here. We modify the query to use receipt_gas_used instead of gas_used. In our provisioned Redshift cluster this query executes in 66.3secs.
SELECT
  date_trunc('week', block_timestamp) AS time,
  SUM(receipt_gas_used) AS total_gas_used,
  AVG(receipt_gas_used) AS avg_gas_used,
  percentile_cont(.5) within GROUP (
    ORDER BY
      receipt_gas_used
  ) AS median_gas_used
FROM
  transactions
WHERE
  block_timestamp >= '2015-10-01'
GROUP BY
  time
ORDER BY
  time ASC
LIMIT
  10;

        time         | total_gas_used | avg_gas_used | median_gas_used
---------------------+----------------+--------------+-----------------
 2015-09-28 00:00:00 |  695113747    |      27562    |      21000.0
 2015-10-05 00:00:00 |  1346460245   |      29208    |      21000.0
 2015-10-12 00:00:00 |  1845089516   |      39608    |      21000.0
 2015-10-19 00:00:00 |  1468537875   |      33573    |      21000.0
 2015-10-26 00:00:00 |  1876510203   |      37293    |      21000.0
 2015-11-02 00:00:00 |  2256326647   |      37741    |      21000.0
 2015-11-09 00:00:00 |  2229775112   |      38535    |      21000.0
 2015-11-16 00:00:00 |  1457079785   |      28520    |      21000.0
 2015-11-23 00:00:00 |  1477742844   |      29497    |      21000.0
 2015-11-30 00:00:00 |  1796228561   |      34517    |      21000.0
(10 rows)

Time: 66341.393 ms (01:06.341)
Comparatively our 60 core ClickHouse Cloud node completes this query in 17 seconds. Note both the simpler quantile syntax and how we use the toStartOfWeek function with a mode of 1 to consider Mondays as the start of the week. This delivers consistent results as dune.com and Redshift.
SELECT
    toStartOfWeek(block_timestamp, 1) AS time,
    SUM(receipt_gas_used) AS total_gas_used,
    round(AVG(receipt_gas_used)) AS avg_gas_used,
    quantileExact(0.5)(receipt_gas_used) AS median_gas_used
FROM transactions
WHERE block_timestamp >= '2015-10-01'
GROUP BY time
ORDER BY time ASC
LIMIT 10

┌───────time─┬─total_gas_used─┬─avg_gas_used─┬─median_gas_used─┐
│ 2015-09-28 │  695113747     │     27562    │          21000  │
│ 2015-10-05 │  1346460245    │     29208    │          21000  │
│ 2015-10-12 │  1845089516    │     39609    │          21000  │
│ 2015-10-19 │  1468537875    │     33573    │          21000  │
│ 2015-10-26 │  1876510203    │     37294    │          21000  │
│ 2015-11-02 │  2256326647    │     37742    │          21000  │
│ 2015-11-09 │  2229775112    │     38535    │          21000  │
│ 2015-11-16 │  1457079785    │     28520    │          21000  │
│ 2015-11-23 │  1477742844    │     29498    │          21000  │
│ 2015-11-30 │  1796228561    │     34518    │          21000  │
└────────────┴────────────────┴──────────────┴─────────────────┘

10 rows in set. Elapsed: 17.287 sec. Processed 1.87 billion rows, 14.99 GB (108.39 million rows/s., 867.15 MB/s.)
Both of these functions utilize an exact computation of Percentiles. Equivalent estimation functions in Redshift and ClickHouse (likely sufficient for visualizations), offer the possibility of improved performance. For Redshift unfortunately, this function is limited by cluster size resulting in the following error on our 128 RPU serverless instance:
SELECT
  date_trunc('week', block_timestamp) AS time,
  SUM(receipt_gas_used) AS total_gas_used,
  AVG(receipt_gas_used) AS avg_gas_used,
  APPROXIMATE percentile_disc(.5) within GROUP (
    ORDER BY
      receipt_gas_used
  ) AS median_gas_used
FROM
  transactions
WHERE
  block_timestamp >= '2015-10-01'
GROUP BY
  time
ORDER BY
  time ASC
LIMIT
  10;

ERROR:  1036
DETAIL:  GROUP BY limit for approximate percentile_disc exceeded.
The number of groups returned by the GROUP BY clause exceeds the limit for your cluster size. Consider using percentile_cont instead. (pid:13074)
For ClickHouse, this query returns in less than 1.7 seconds, a huge improvement.
SELECT
    toStartOfWeek(block_timestamp,1) AS time,
    SUM(receipt_gas_used) AS total_gas_used,
    round(AVG(receipt_gas_used)) AS avg_gas_used,
    quantile(0.5)(receipt_gas_used) AS median_gas_used
FROM transactions
WHERE block_timestamp >= '2015-10-01'
GROUP BY time
ORDER BY time ASC
LIMIT 10

┌───────time─┬─total_gas_used─┬─avg_gas_used─┬─median_gas_used─┐
│ 2015-09-28 │  695113747     │     27562    │          21000  │
│ 2015-10-05 │  1346460245    │     29208    │          21000  │
│ 2015-10-12 │  1845089516    │     39609    │          21000  │
│ 2015-10-19 │  1468537875    │     33573    │          21000  │
│ 2015-10-26 │  1876510203    │     37294    │          21000  │
│ 2015-11-02 │  2256326647    │     37742    │          21000  │
│ 2015-11-09 │  2229775112    │     38535    │          21000  │
│ 2015-11-16 │  1457079785    │     28520    │          21000  │
│ 2015-11-23 │  1477742844    │     29498    │          21000  │
│ 2015-11-30 │  1796228561    │     34518    │          21000  │
└────────────┴────────────────┴──────────────┴─────────────────┘

10 rows in set. Elapsed: 1.692 sec. Processed 1.87 billion rows, 14.99 GB (1.11 billion rows/s., 8.86 GB/s.)
Ethereum Smart Contracts Creation #
We adapt this query from a dune.com visualization. We remove the now() restriction since our data has a fixed upper bound. Due to Redshift not supporting the window RANGE function, we are also forced to modify the query slightly to compute the cumulative sum. ClickHouse runs this query in 76ms vs Redshift in 250ms, despite both tables being ordered by trace_type.
SELECT
  date_trunc('week', block_timestamp) AS time,
  COUNT(*) AS created_contracts,
  sum(created_contracts) OVER (
    ORDER BY
    time rows UNBOUNDED PRECEDING
  ) AS cum_created_contracts
from
  traces
WHERE
  trace_type = 'create'
GROUP BY
  time
ORDER BY
  time ASC
LIMIT
  10;
        time        | created_contracts | cum_created_contracts
---------------------+-------------------+-----------------------
 2015-08-03 00:00:00 |              139 |                   139
 2015-08-10 00:00:00 |              204 |                   343
 2015-08-17 00:00:00 |              189 |                   532
 2015-08-24 00:00:00 |              204 |                   736
 2015-08-31 00:00:00 |              266 |                  1002
 2015-09-07 00:00:00 |              252 |                  1254
 2015-09-14 00:00:00 |              293 |                  1547
 2015-09-21 00:00:00 |              274 |                  1821
 2015-09-28 00:00:00 |              129 |                  1950
 2015-10-05 00:00:00 |              143 |                  2093
(10 rows)

Time: 236.261 ms
SELECT
    toStartOfWeek(block_timestamp, 1) AS time,
    count() AS created_contracts,
    sum(created_contracts) OVER (ORDER BY time ASC ROWS BETWEEN UNBOUNDED PRECEDING AND CURRENT ROW) AS cum_created_contracts
FROM traces
WHERE trace_type = 'create'
GROUP BY time
ORDER BY time ASC
LIMIT 10

┌───────time─┬─created_contracts─┬─cum_created_contracts─┐
│ 2015-08-03 │              139  │                  139  │
│ 2015-08-10 │              204  │                  343  │
│ 2015-08-17 │              189  │                  532  │
│ 2015-08-24 │              204  │                  736  │
│ 2015-08-31 │              266  │                  1002 │
│ 2015-09-07 │              252  │                  1254 │
│ 2015-09-14 │              293  │                  1547 │
│ 2015-09-21 │              274  │                  1821 │
│ 2015-09-28 │              129  │                  1950 │
│ 2015-10-05 │              143  │                  2093 │
└────────────┴───────────────────┴───────────────────────┘

10 rows in set. Elapsed: 0.076 sec. Processed 58.08 million rows, 290.39 MB (767.20 million rows/s., 3.84 GB/s.)
Ether supply by day #
The original BigQuery query, documented as part of Awesome BigQuery views and discussed here, executes in 428ms in Redshift. The ClickHouse query runs in 87ms. Using projections, this query can be further optimized to run in under 10ms secs.
WITH ether_emitted_by_date AS (
  SELECT
    date(block_timestamp) AS date,
    SUM(value) AS value
  FROM
    traces
  WHERE
    trace_type IN ('genesis', 'reward')
  GROUP BY
    DATE(block_timestamp)
)
SELECT
  date,
  SUM(value) OVER (
    ORDER BY
      date ASC ROWS BETWEEN UNBOUNDED PRECEDING
      AND CURRENT ROW
  ) / POWER(10, 18) AS supply
FROM
  ether_emitted_by_date
LIMIT
  10;

    date    |   supply
------------+----------------
 1970-01-01 | 72009990.49948
 2015-07-30 | 72049301.59323
 2015-07-31 | 72085493.31198
 2015-08-01 | 72113195.49948
 2015-08-02 | 72141422.68698
 2015-08-03 | 72169399.40573
 2015-08-04 | 72197877.84323
 2015-08-05 | 72225406.43698
 2015-08-06 | 72252481.90573
 2015-08-07 | 72279919.56198
(10 rows)

Time: 428.202 ms
ClickHouse, with and without projections:
WITH ether_emitted_by_date AS
    (
        SELECT
            date(block_timestamp) AS date,
            SUM(value) AS value
        FROM traces
        WHERE trace_type IN ('genesis', 'reward')
        GROUP BY DATE(block_timestamp)
    )
SELECT
    date,
    SUM(value) OVER (ORDER BY date ASC ROWS BETWEEN UNBOUNDED PRECEDING AND CURRENT ROW) / POWER(10, 18) AS supply
FROM ether_emitted_by_date
LIMIT 10
┌───────date─┬────────────supply─┐
│ 1970-01-01 │ 72009990.49948001 │
│ 2015-07-30 │ 72049301.59323001 │
│ 2015-07-31 │  72085493.31198   │
│ 2015-08-01 │  72113195.49948   │
│ 2015-08-02 │  72141422.68698   │

10 rows in set. Elapsed: 0.087 sec. Processed 18.08 million rows, 379.73 MB (207.34 million rows/s., 4.35 GB/s.)

-- add projections

ALTER TABLE traces ADD PROJECTION trace_type_projection (
                 SELECT trace_type,
                 toStartOfDay(block_timestamp) as date, sum(value) as value GROUP BY trace_type, date
                 )
ALTER TABLE traces MATERIALIZE PROJECTION trace_type_projection

-- re-run query
WITH ether_emitted_by_date AS
    (
     SELECT
         date,
         sum(value) AS value
     FROM traces
     WHERE trace_type IN ('genesis', 'reward')
     GROUP BY toStartOfDay(block_timestamp) AS date
    )
SELECT
    date,
    sum(value) OVER (ORDER BY date ASC) / power(10, 18) AS supply
FROM ether_emitted_by_date

3 rows in set. Elapsed: 0.009 sec. Processed 11.43 thousand rows, 509.00 KB (1.23 million rows/s., 54.70 MB/s.)
Total Ethereum Market Capitalisation #
This is a query that has been modified from a dune.com visualization that estimates the total market capitalization of Ethereum. Here we use a fixed price of 1577.88 from CoinDesk, since our data is a snapshot with a latest date of 2023-02-14 19:34:59. In our Redshift provisioned instance this query fails as shown below (also occurs in Query UI).
SELECT
  120529053 - SUM(eb.base_fee_per_gas * et.gas) / 1e18 -- missing  ETH2 rewards for now, awaiting beacon chain data, using estimated 1600 ETH staking issuance /day for now
  + COUNT(eb.number) * 1600 /(24 * 60 * 60 / 12) AS eth_supply
FROM
  transactions et
  INNER JOIN blocks eb ON eb.number = et.block_number
WHERE
  et.block_timestamp >= '2022-09-29'
)
SELECT
  (eth_supply * 1577.88) / 1e9 AS eth_mcap
FROM
  eth_supply;

ERROR:  Numeric data overflow (addition)
DETAIL:
  -----------------------------------------------
  error:  Numeric data overflow (addition)
  code:     1058
  context:
  query:    4602282
  location:  numeric_bound.cpp:180
  process:   query10_500_4602282 [pid=31250]
  -----------------------------------------------
On our 60 core ClickHouse Cloud node, this query runs in 3.2secs.
WITH eth_supply AS
    (
        SELECT (120529053 - (SUM(eb.base_fee_per_gas * et.receipt_gas_used) / 1000000000000000000.)) + ((COUNT(eb.number) * 1600) / (((24 * 60) * 60) / 12)) AS eth_supply
        FROM transactions AS et
        INNER JOIN blocks AS eb ON eb.number = et.block_number
        WHERE et.block_timestamp >= '2022-09-29'
    )
SELECT (eth_supply * 1577.88) / 1000000000. AS eth_mcap
FROM eth_supply
┌───────────eth_mcap─┐
│ 251.42266710943835 │
└────────────────────┘

1 row in set. Elapsed: 3.220 sec. Processed 191.48 million rows, 2.30 GB (59.47 million rows/s., 713.69 MB/s.)
This value is consistent with that computed by dune.com. A full set of example queries can be found here. We welcome contributions!
Conclusion #
In this blog post, we have explored how data can be moved to ClickHouse from Redshift to accelerate queries for real-time analytics. We have shown a number of approaches to loading data and keeping it in sync, and how to leverage ClickHouse for real-time analytics on top of this data. In later posts, we’ll explore this Ethereum dataset in more detail.
In the meantime, we have made this dataset available in a public ClickHouse deployment for exploration (sql.clickhouse.com) and gcs bucket gs://clickhouse_public_datasets/ethereum. You are welcome to try it by downloading a free open-source version of ClickHouse and deploying it yourself or spinning up a ClickHouse Cloud free trial. ClickHouse Cloud is a fully-managed serverless offering based on ClickHouse, where you can start building real-time applications with ease without having to worry about deploying and managing infrastructure.
Resources #
We recommend the following resources with respect to Ethereum and querying this dataset.
- How to replay time series data from Google BigQuery to Pub/Sub
- Evgeny Medvedev series on the blockchain analysis
- Ethereum in BigQuery: a Public Dataset for smart contract analytics
- Awesome BigQuery Views for Crypto
- How to Query Balances for all Ethereum Addresses in BigQuery
- Visualizing Average Ether Costs Over Time
- Plotting Ethereum Address Growth Chart in BigQuery
- Comparing Transaction Throughputs for 8 blockchains in Google BigQuery with Google Data Studio
- Introducing six new cryptocurrencies in BigQuery Public Datasets—and how to analyze them
- dune.com for query inspirations

