
ClickHouse supports not only standard aggregate functions but also a lot of more advanced ones to cover most analytical use cases. Along with aggregate functions, ClickHouse provides aggregate combinators, which are a powerful extension to the querying capabilities and can address a massive number of requirements.
Combinators allow extending and mixing aggregations to address a wide range of data structures. This capability will enable us to adapt queries instead of tables to answer even the most complex questions.
In this blog post, we explore Aggregate Combinators and how the can potentially simplify your queries and avoid the need to make structural changes to your data.
How to use combinators #
To use a combinator, we have to do two things. First, choose an aggregate function we want to use; let's say we want a sum() function. Second, pick a combinator needed for our case; let's say we need an If combinator. To use this in a query, we add the combinator to the function name:
SELECT sumIf(...)
An even more useful feature is that we can combine any number of combinators in a single function:
SELECT sumArrayIf(...)
Here, we've combined the sum() function with the Array and If combinators:
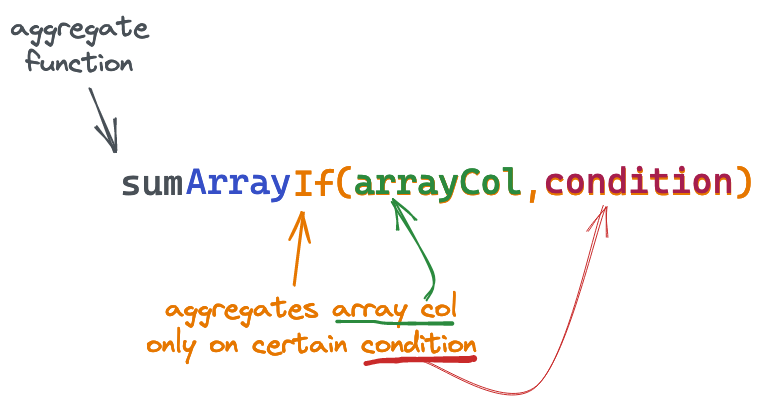
This particular example would allow us to conditionally sum the contents of an array column.
Let's explore some practical cases where combinators can be used.
Adding conditions to aggregations #
Sometimes, we need to aggregate data based on specific conditions.
Instead of using a WHERE clause for this, we can use If combinator and specify conditions as a last argument of the combined function:
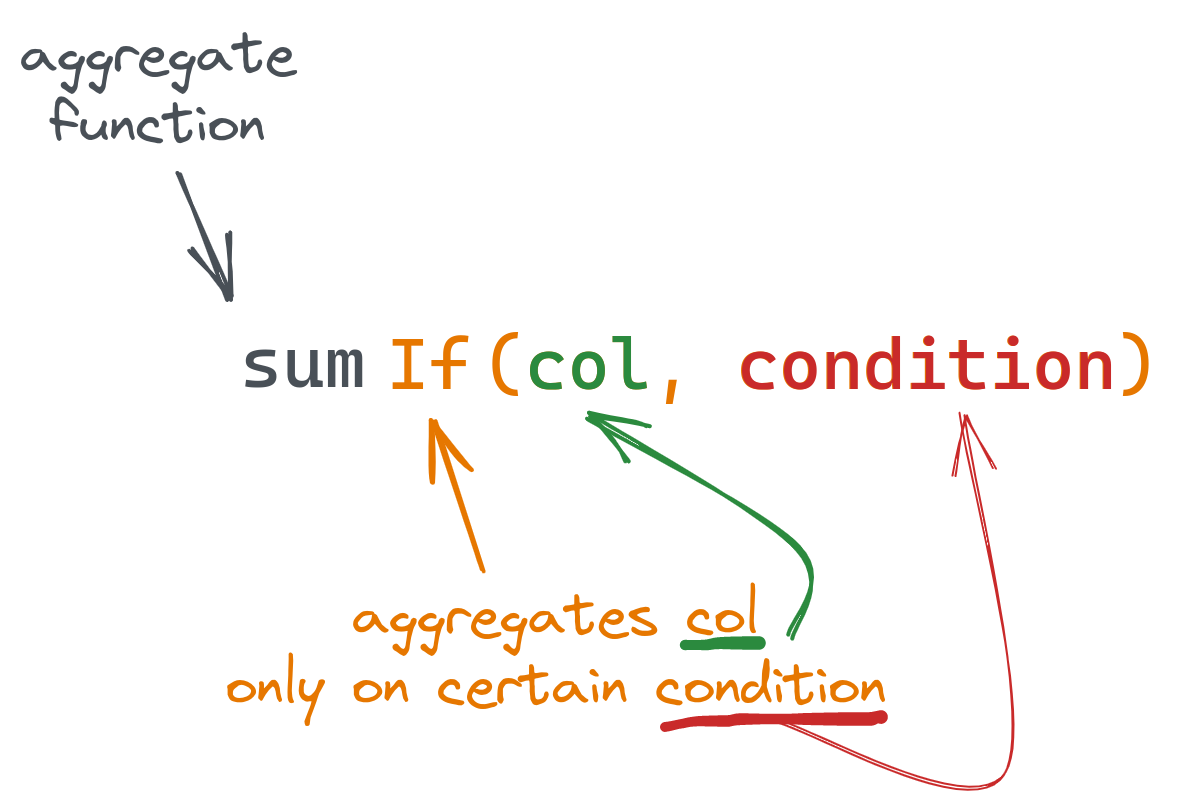
Suppose we have a table with user payments of the following structure (populated with a sample data):
CREATE TABLE payments
(
    `total_amount` Float,
    `status` ENUM('declined', 'confirmed'),
    `create_time` DateTime,
    `confirm_time` DateTime
)
ENGINE = MergeTree
ORDER BY (status, create_time)
Let's say we want to get the total amount spent, but only when the payment was confirmed i.e. status="confirmed":
SELECT sumIf(total_amount, status = 'confirmed') FROM payments

┌─sumIf(total_amount, equals(status, 'declined'))─┐
│                               10780.18000793457 │
└─────────────────────────────────────────────────┘
We can use the same syntax for the condition as for WHERE clauses.
Let's get the total amount of confirmed payments, but when confirm_time is later than create_time by 1 minute:
SELECT sumIf(total_amount, (status = 'confirmed') AND (confirm_time > (create_time + toIntervalMinute(1)))) AS confirmed_and_checked
FROM payments

┌─confirmed_and_checked─┐
│     11195.98991394043 │
└───────────────────────┘
The principal advantage of using the conditional If, over a standard WHERE clause, is the ability to compute multiple sums for different clauses. We can also use any available aggregate function with combinators, like countIf(), avgIf() or quantileIf() - any. Combing these capabilities we can aggregate on multiple conditions and functions within a single request:
SELECT
    countIf((status = 'confirmed') AND (confirm_time > (create_time + toIntervalMinute(1)))) AS num_confirmed_checked,
    sumIf(total_amount, (status = 'confirmed') AND (confirm_time > (create_time + toIntervalMinute(1)))) AS confirmed_checked_amount,
    countIf(status = 'declined') AS num_declined,
    sumIf(total_amount, status = 'declined') AS dec_amount,
    avgIf(total_amount, status = 'declined') AS dec_average
FROM payments

┌─num_confirmed_checked─┬─confirmed_checked_amount─┬─num_declined─┬────────dec_amount─┬───────dec_average─┐
│                    39 │        11195.98991394043 │           50 │ 10780.18000793457 │ 215.6036001586914 │
└───────────────────────┴──────────────────────────┴──────────────┴───────────────────┴───────────────────┘
Aggregating on unique entries only #
It's a common case to calculate the number of unique entries. ClickHouse has several ways to do this using either COUNT(DISTINCT col) (the same as uniqExact) or theuniq() when an estimated (but faster) value is sufficient. Still, we might want to have unique values from a column used in different aggregate functions. The Distinct combinator can be used for this:
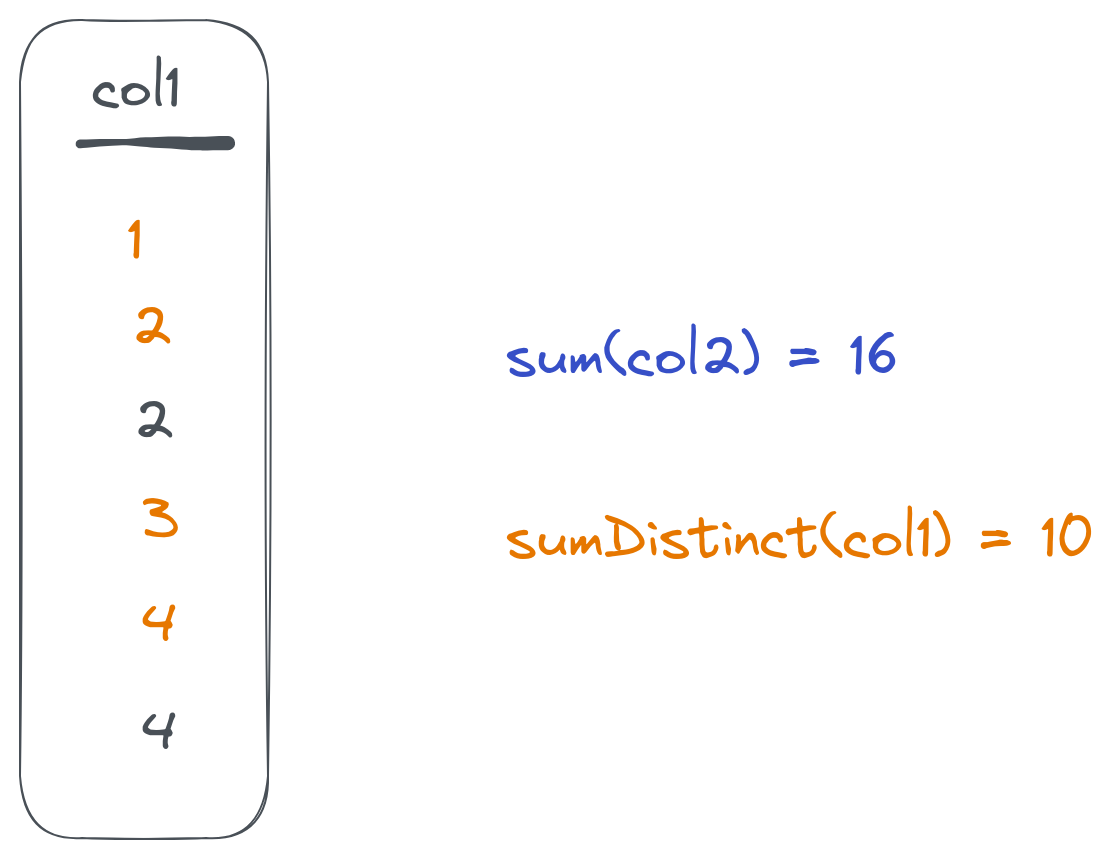
Once we add Distinct to the aggregate function, it will ignore repeated values:
SELECT
    countDistinct(toHour(create_time)) AS hours,
    avgDistinct(toHour(create_time)) AS avg_hour,
    avg(toHour(create_time)) AS avg_hour_all
FROM payments

┌─hours─┬─avg_hour─┬─avg_hour_all─┐
│     2 │     13.5 │        13.74 │
└───────┴──────────┴──────────────┘
Here, avg_hour will be calculated based on the two distinct values only, while avg_hour_all will be calculated based on all 100 records in the table.
Combining Distinct and If #
As combinators can be combined together, we can use both previous combinators with an avgDistinctIf function to address more advanced logic:
SELECT avgDistinctIf(toHour(create_time), total_amount > 400) AS avg_hour
FROM payments

┌─avg_hour─┐
│       13 │
└──────────┘
This will calculate the average on distinct hour values for records with a total_amount value of more than 400.
Splitting data into groups before aggregating #
Instead of min/max analysis, we might want to split our data into groups and calculate figures for each group separately. This can be solved using the Resample combinator.
It takes a column, range (start/stop), and a step that you want to split data on. It then returns an aggregate value for each group:
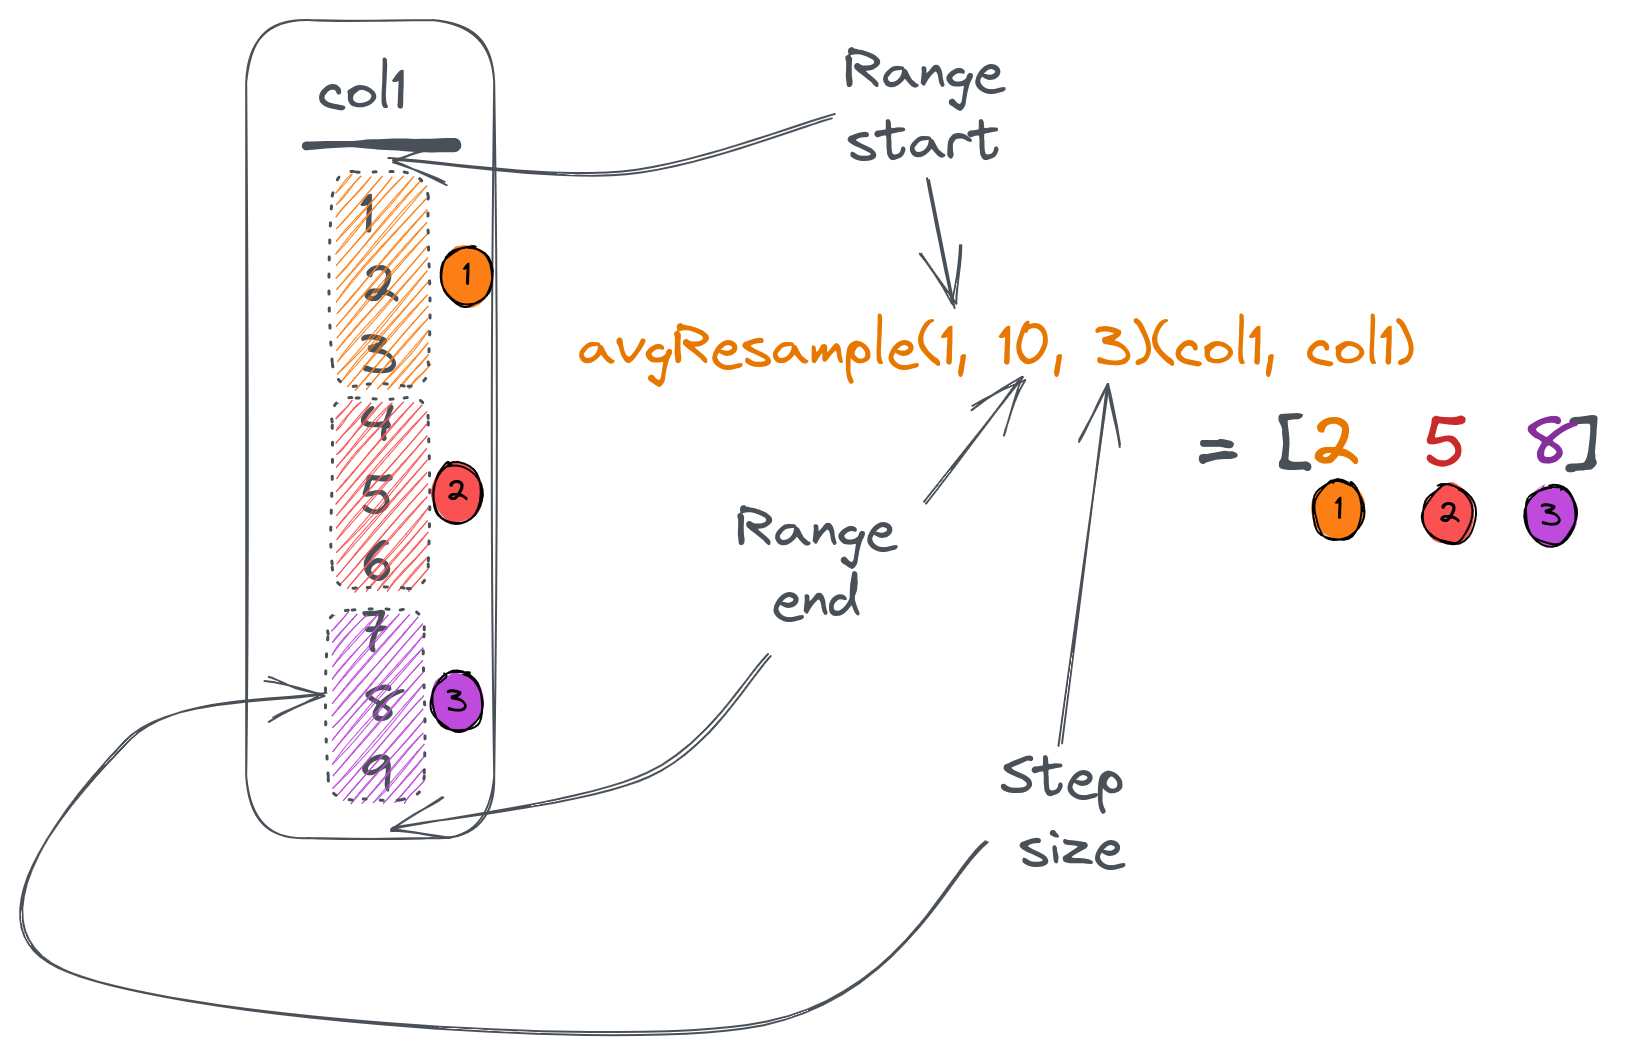
Suppose we want to split our payments table data based on the total_amount from 0 (which is the minimum) to 500 (which is the maximum) with a step of 100. Then, we want to know how many entries there are in each group as well as the groups average total:
SELECT
    countResample(0, 500, 100)(toInt16(total_amount)) AS group_entries,
    avgResample(0, 500, 100)(total_amount, toInt16(total_amount)) AS group_totals
FROM payments
FORMAT Vertical

Row 1:
──────
group_entries: [21,20,24,31,4]
group_totals:  [50.21238123802912,157.32600135803222,246.1433334350586,356.2583834740423,415.2425003051758]
Here, the countResample() function counts the number of entries in each group, and an avgResample() function calculates an average of the total_amount for each group. Resample combinator accepts column name to split based on as a last argument to the combined function.
Note that the countResample() function has only one argument (since count() doesn't require arguments at all) and avgResample() has two arguments (the first one is the column to calculate average values for). Finally, we had to use toInt16 to convert total_amount to an integer since a Resample combinator requires this.
To get the Resample() combinators output in a table layout, we can use arrayZip() and arrayJoin() functions:
SELECT
    round(tp.2, 2) AS avg_total,
    tp.1 AS entries
FROM
(
    SELECT
      arrayJoin(arrayZip(countResample(0, 500, 100)(toInt16(total_amount)),
      avgResample(0, 500, 100)(total_amount, toInt16(total_amount)))) AS tp
    FROM payments
)

┌─avg_total─┬─entries─┐
│     50.21 │      21 │
│    157.33 │      20 │
│    246.14 │      24 │
│    356.26 │      31 │
│    415.24 │       4 │
└───────────┴─────────┘
Here, we combine corresponding values from 2 arrays into tuples and unfold the resulting array into a table using an arrayJoin() function:
Controlling aggregate values for empty results #
Aggregate functions react differently to cases when the resulting set contains no data. For example, count() will return 0 while avg() will produce a nan value.
We can control this behaviour using the OrDefault() and OrNull() combinators. Both changes a returned value of an aggregate function used in case of an empty dataset:
OrDefault()will return a default value of the function instead ofnan,OrNull()will returnNULL(and will also change the return type toNullable).
Consider the following example:
SELECT
    count(),
    countOrNull(),
    avg(total_amount),
    avgOrDefault(total_amount),
    sumOrNull(total_amount)
FROM payments
WHERE total_amount > 1000

┌─count()─┬─countOrNull()─┬─avg(total_amount)─┬─avgOrDefault(total_amount)─┬─sumOrNull(total_amount)─┐
│       0 │          ᴺᵁᴸᴸ │               nan │                          0 │                    ᴺᵁᴸᴸ │
└─────────┴───────────────┴───────────────────┴────────────────────────────┴─────────────────────────┘
As we can see in the first column, zero rows were returned.
Note how countOrNull() will return NULL instead of 0, and avgOrDefault() gives 0 instead of nan.
Using with other combinators #
As well as all other combinators, orNull() and orDefault() can be used together with different combinators for a more advanced logic:
SELECT
    sumIfOrNull(total_amount, status = 'declined') AS declined,
    countIfDistinctOrNull(total_amount, status = 'confirmed') AS confirmed_distinct
FROM payments
WHERE total_amount > 420

┌─declined─┬─confirmed_distinct─┐
│     ᴺᵁᴸᴸ │                  1 │
└──────────┴────────────────────┘
We've used the sumIfOrNull() combined function to calculate only declined payments and return NULL on an empty set.
The countIfDistinctOrNull() function counts distinct total_amount values but only for rows meeting the specified condition.
Aggregating arrays #
ClickHouse's Array type is popular among its users because it brings a lot of flexibility to table structures. To operate with Array columns efficiently, ClickHouse provides a set of array functions. To make aggregations on Array types easy, ClickHouse provides the Array() combinators. These apply a given aggregate function on all values from an array column instead of the array itself:
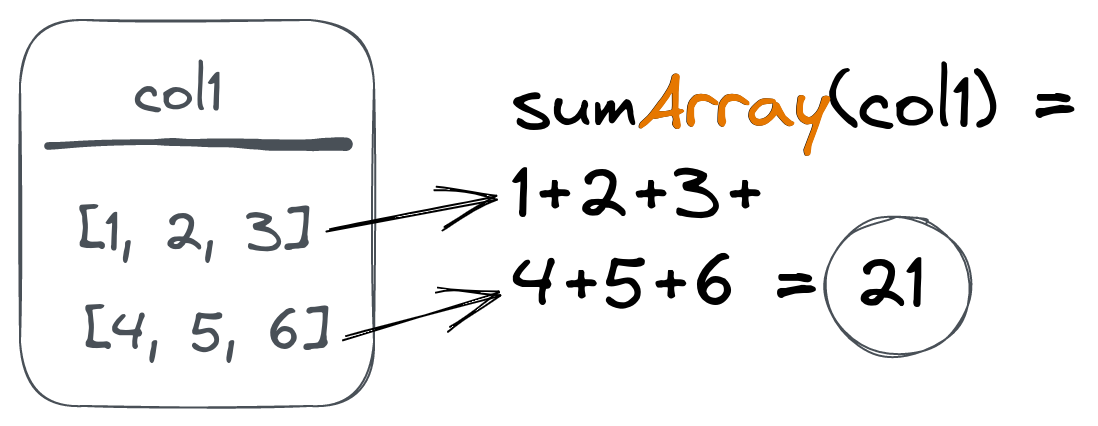
Suppose we have the following table (populated with a sample data):
CREATE TABLE article_reads
(
    `time` DateTime,
    `article_id` UInt32,
    `sections` Array(UInt16),
    `times` Array(UInt16),
    `user_id` UInt32
)
ENGINE = MergeTree
ORDER BY (article_id, time)

┌────────────────time─┬─article_id─┬─sections─────────────────────┬─times────────────────────────────────┬─user_id─┐
│ 2023-01-18 23:44:17 │         10 │ [16,18,7,21,23,22,11,19,9,8] │ [82,96,294,253,292,66,44,256,222,86] │     424 │
│ 2023-01-20 22:53:00 │         10 │ [21,8]                       │ [30,176]                             │     271 │
│ 2023-01-21 03:05:19 │         10 │ [24,11,23,9]                 │ [178,177,172,105]                    │     536 │
...
This table is used to store article reading data for each section of the article.
When a user reads an article, we save the read sections to the sections array column and the associated reading times to the times column:
Let's use the uniqArray() function to calculate a number of unique sections read for each article together with avgArray() to get an average time per section:
SELECT
    article_id,
    uniqArray(sections) sections_read,
    round(avgArray(times)) time_per_section
FROM article_reads
GROUP BY article_id

┌─article_id─┬─sections_read─┬─time_per_section─┐
│         14 │            22 │              175 │
│         18 │            25 │              159 │
...
│         17 │            25 │              170 │
└────────────┴───────────────┴──────────────────┘
We can get the min and max read time across all articles using minArray() and maxArray() functions:
SELECT
    minArray(times),
    maxArray(times)
FROM article_reads

┌─minArray(times)─┬─maxArray(times)─┐
│              30 │             300 │
└─────────────────┴─────────────────┘
We can also get a list of read sections for each article using the groupUniqArray() function combined with an Array() combinator:
SELECT
    article_id,
    groupUniqArrayArray(sections)
FROM article_reads
GROUP BY article_id

┌─article_id─┬─groupUniqArrayArray(sections)───────────────────────────────────────┐
│         14 │ [16,13,24,8,10,3,9,19,23,14,7,25,2,1,21,18,12,17,22,4,6,5]          │
...
│         17 │ [16,11,13,8,24,10,3,9,23,19,14,7,25,20,2,1,15,21,6,5,12,22,4,17,18] │
└────────────┴─────────────────────────────────────────────────────────────────────┘
Another popular function is any(), which returns any column value under aggregation, and can also be combined Array:
SELECT
    article_id,
    anyArray(sections)
FROM article_reads
GROUP BY article_id

┌─article_id─┬─anyArray(sections)─┐
│         14 │                 19 │
│         18 │                  6 │
│         19 │                 25 │
│         15 │                 15 │
│         20 │                  1 │
│         16 │                 23 │
│         12 │                 16 │
│         11 │                  2 │
│         10 │                 16 │
│         13 │                  9 │
│         17 │                 20 │
└────────────┴────────────────────┘
Using Array with other combinators #
The Array combinator can be used together with any other combinator:
SELECT
    article_id,
    sumArrayIfOrNull(times, length(sections) > 8)
FROM article_reads
GROUP BY article_id

┌─article_id─┬─sumArrayOrNullIf(times, greater(length(sections), 8))─┐
│         14 │                                                  4779 │
│         18 │                                                  3001 │
│         19 │                                                  NULL │
...
│         17 │                                                 14424 │
└────────────┴───────────────────────────────────────────────────────┘
We have used the sumArrayIfOrNull() function to calculate the total times for articles where more than eight sections were read. Note that NULL is returned for articles with zero cases of more than eight sections read because we've also used the OrNull() combinator.
We can address even more advanced cases if we use array functions along with combinators:
SELECT
    article_id,
    countArray(arrayFilter(x -> (x > 120), times)) AS sections_engaged
FROM article_reads
GROUP BY article_id

┌─article_id─┬─sections_engaged─┐
│         14 │               26 │
│         18 │               44 │
...
│         17 │               98 │
└────────────┴──────────────────┘
Here, we first filter the times array using an arrayFilter function to remove all values under 120 seconds. Then, we use countArray to calculate filtered times (which means engaged reads in our case) for each article.
Aggregating maps #
Another powerful type available in ClickHouse is the Map. Like arrays, we can use Map() combinator to apply aggregations to this type.
Suppose we have the following table with a Map column type:
CREATE TABLE page_loads
(
    `time` DateTime,
    `url` String,
    `params` Map(String, UInt32)
)
ENGINE = MergeTree
ORDER BY (url, time)

┌────────────────time─┬─url─┬─params───────────────────────────────┐
│ 2023-01-25 17:44:26 │ /   │ {'load_speed':100,'scroll_depth':59} │
│ 2023-01-25 17:44:37 │ /   │ {'load_speed':400,'scroll_depth':12} │
└─────────────────────┴─────┴──────────────────────────────────────┘
We can use a Map() combinator for the sum() and avg() functions to get total loading times and average scroll depth:
SELECT
    sumMap(params)['load_speed'] AS total_load_time,
    avgMap(params)['scroll_depth'] AS average_scroll
FROM page_loads

┌─total_load_time─┬─average_scroll─┐
│             500 │           35.5 │
└─────────────────┴────────────────┘
The Map() combinator can also be used with other combinators:
SELECT sumMapIf(params, url = '/404')['scroll_depth'] AS average_scroll FROM page_loads
Aggregating respective array values #
Another way to work with array columns is to aggregate corresponding values from two arrays. This results in another array.
This can be used for vectorized data (like vectors or matrices) and is implemented via the ForEach() combinator:
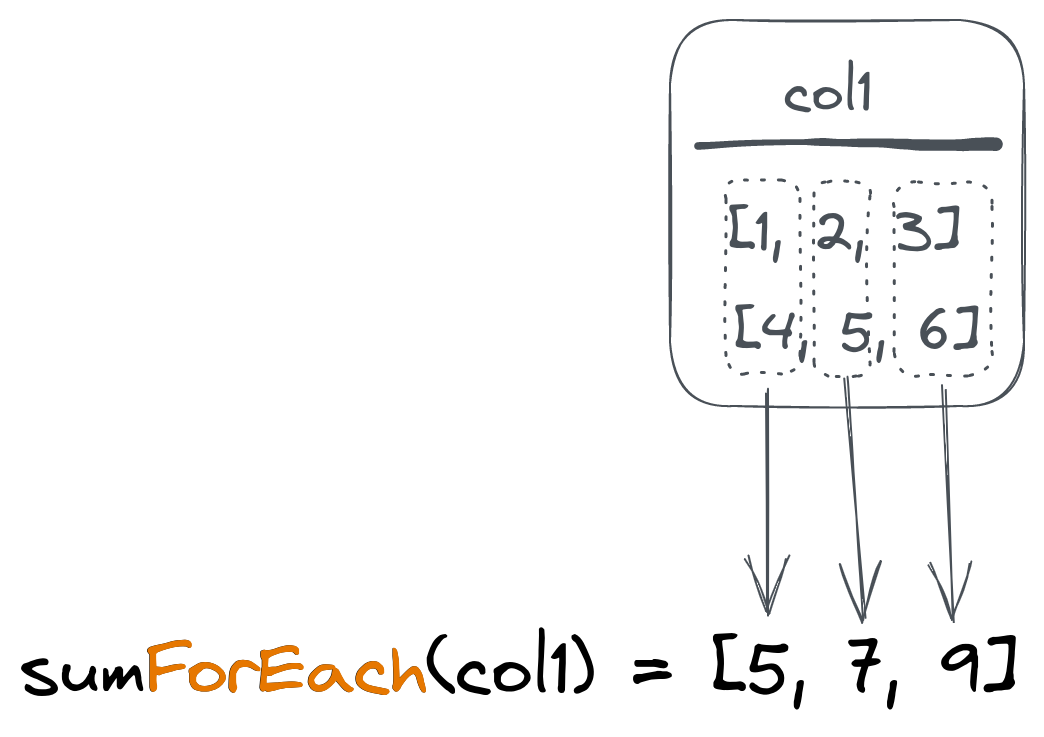
Suppose we have the following table with vectors:
SELECT * FROM vectors

┌─title──┬─coordinates─┐
│ first  │ [1,2,3]     │
│ second │ [2,2,2]     │
│ third  │ [0,2,1]     │
└────────┴─────────────┘
To calculate the average coordinates array (vector), we can use an avgForEach() combined function:
SELECT avgForEach(coordinates) FROM vectors

┌─avgForEach(coordinates)─┐
│ [1,2,2]                 │
└─────────────────────────┘
This will ask ClickHouse to calculate an average value for the first element of all coordinates arrays and put it into the first element of the resulting array. Then repeat the same for the second and third elements.
And, of course, use with other combinators is also supported:
SELECT avgForEachIf(coordinates, title != 'second') FROM vectors

┌─avgForEachIf(coordinates, notEquals(title, 'second'))─┐
│ [0.5,2,2]                                             │
└───────────────────────────────────────────────────────┘
Working with aggregation states #
ClickHouse allows working with intermediate aggregation states instead of resulting values.
Let's say we need to count unique values in our case, but we don't want to save the values themselves (because it takes space).
In this case, we can use a State() combinator for the uniq() function to save the intermediate aggregation state and then use a Merge() combinator to calculate actual value:
SELECT uniqMerge(u)
FROM
(
    SELECT uniqState(number) AS u FROM numbers(5)
    UNION ALL
    SELECT uniqState(number + 1) AS u FROM numbers(5)
)

┌─uniqMerge(u)─┐
│            6 │
└──────────────┘
Here, the first nested query will return the state for the unique count of 1...5 numbers. The second nested query returns the same for 2...6 numbers. The parent query then uses the uniqMerge() function to merge our states and get a count of all unique numbers we saw:
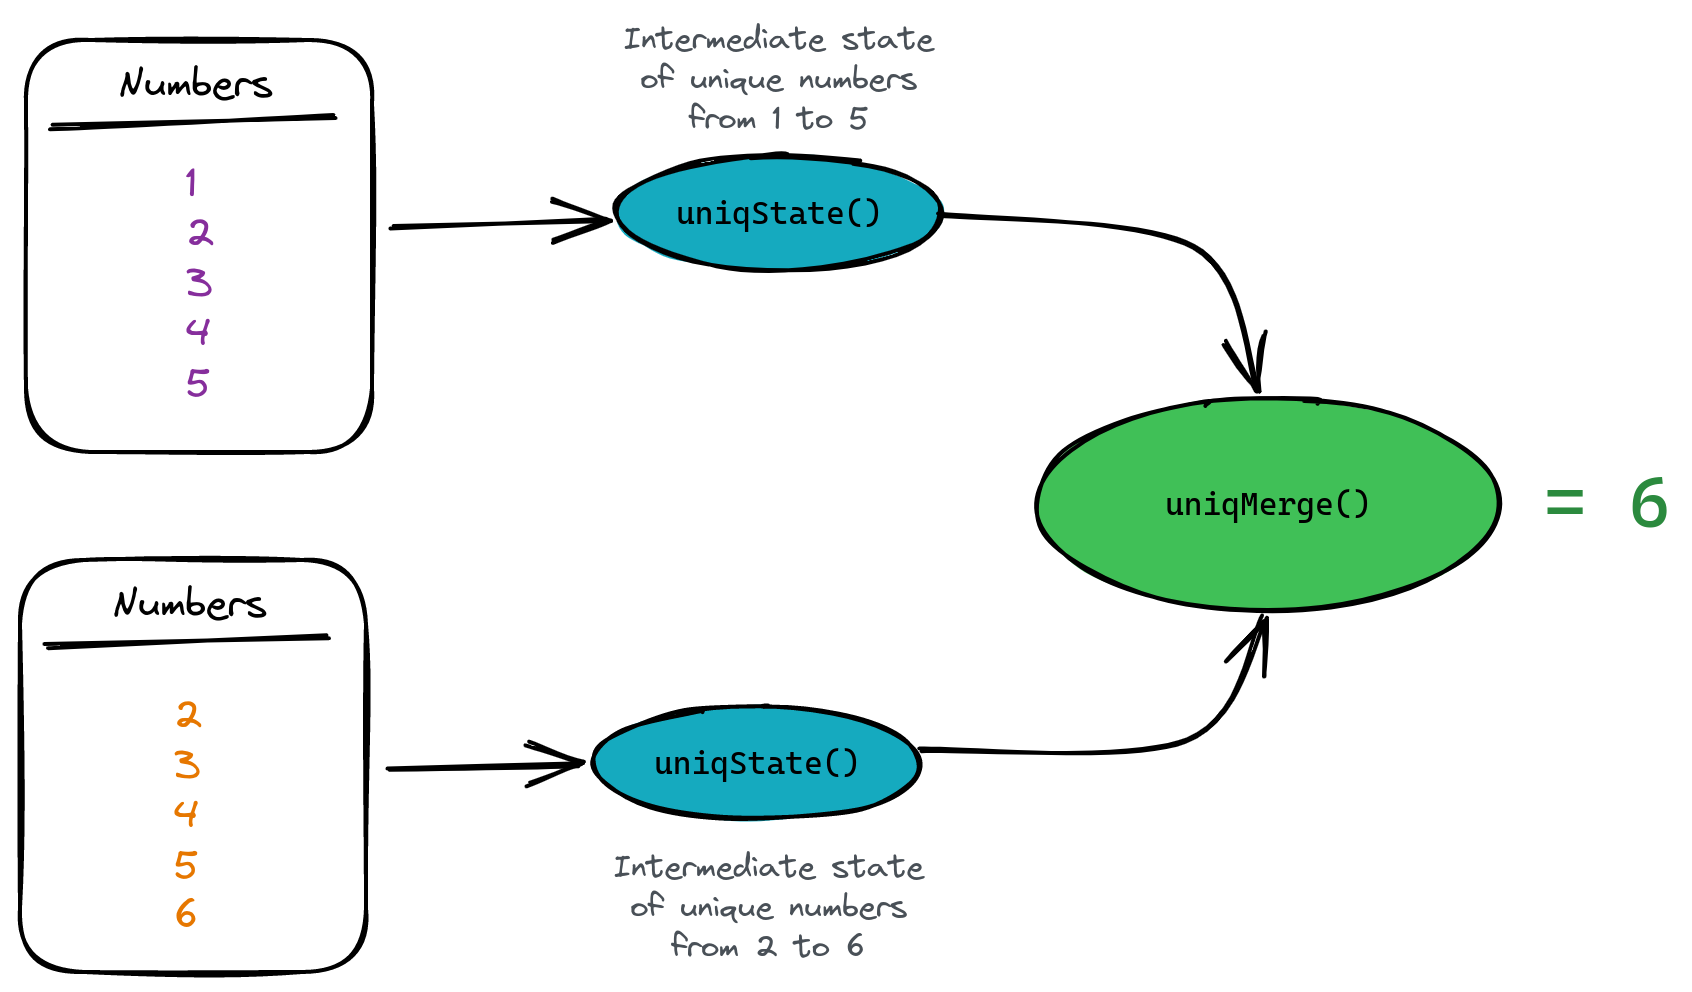
Why do we want to do this? Simply because aggregate states take much less space than the original data. This is particulartly important when we want to store this state on disk. For example, uniqState() data takes 15 times less space than 1 million integer numbers:
SELECT
    table,
    formatReadableSize(total_bytes) AS size
FROM system.tables
WHERE table LIKE 'numbers%'

┌─table─────────┬─size───────┐
│ numbers       │ 3.82 MiB   │ <- we saved 1 million ints here
│ numbers_state │ 245.62 KiB │ <- we save uniqState for 1m ints here
└───────────────┴────────────┘
ClickHouse provides an AggregatingMergeTree table engine for storing aggregation states and automatically merging them on the primary key. Let's create a table to store aggregated data for daily payments from our previous examples:
CREATE TABLE payments_totals
(
    `date` Date,
    `total_amount` AggregateFunction(sum, Float)
)
ENGINE = AggregatingMergeTree
ORDER BY date
We've used the AggregateFunction type to let ClickHouse know we're going to store aggregated total states instead of scalar values. On insert, we need to use the sumState function to insert the aggregate state:
INSERT INTO payments_totals SELECT
    date(create_time) AS date,
    sumState(total_amount)
FROM payments
WHERE status = 'confirmed'
GROUP BY date
Finally, we need to use the sumMerge() function to fetch the resulting values:
┌─sumMerge(total_amount)─┐
│     12033.219916582108 │
└────────────────────────┘
Note that ClickHouse provides an easy way to use aggregated table engines based on materialized views. ClickHouse also provides a SimpleState combinator as an optimized version that can be used with some aggregate functions (like 'sum' or 'min').
Summary #
Aggregation function combinators bring almost limitless possibilities to analytical querying on top of any data structure in ClickHouse. We can add conditions to aggregations, apply functions to array elements or get intermediate states to store data in aggregated form but still available for querying.


