For years, we have focused on building fast systems. ClickHouse is an example of that focus. Performance is not a feature we add later. It is a core design goal from the start.
We applied a similar approach when building our managed Postgres service. The result is offering one of the fastest managed Postgres services to our customers. Postgres handles transactional workloads, while ClickHouse handles analytical workloads. Together they form a unified data stack enabling a "best-of-breed" foundation SaaS and AI applications.
With that in mind, it felt natural to evaluate it the same way we evaluate ClickHouse: with a public, reproducible benchmark.
That is why we built PostgresBench, a benchmark to compare managed Postgres services.
From ClickBench to PostgresBench
ClickBench is a widely referenced OLAP benchmark. It benchmarks more than 40 databases using a transparent and reproducible methodology. All queries, datasets, and results are public and anyone can validate the numbers or submit improvements.
PostgresBench applies the same methodology to transactional Postgres workloads. The rules are straightforward:
- Use a well-understood, standard workload
- Keep infrastructure consistent across all services tested
- Publish all configuration so results can be reproduced
- Allow anyone to submit results or flag issues
If a number looks wrong, it can be checked. If a configuration is unfair, it can be fixed. That is the point.
Benchmark design
Workload
PostgresBench is built on pgbench, the standard Postgres benchmarking tool. We use the TPC-B-like workload it includes out of the box, which simulates short concurrent transactions with frequent writes and updates. It is a reasonable proxy for common transactional patterns: payments, order processing, inventory updates, and similar workloads that hit the database hard with small, frequent writes.
We chose pgbench deliberately. Tools like sysbench and Percona TPCC are designed originally for MySQL workloads. For a Postgres benchmark, pgbench feels more natural, and it ships with Postgres, which makes it easy for anyone to reproduce results without additional tooling.
Running parameters
Each benchmark run uses the following parameters:
pgbench -c 256 -j 16 -T 600 -M prepared -P 30 \
-s $SCALE_FACTOR \
-h $PGHOST -p $PGPORT -U $PGUSER -d $PGDATABASEWe ran each benchmark with 256 clients and 16 threads, which reflects realistic concurrency for a production transactional workload. Each run lasts 10 minutes, long enough to move past warmup and capture stable throughput.
We tested two scale factors: 6849 (~100 GB) and 34247 (~500 GB). These correspond to dataset sizes typical of real Postgres deployments: one where the app is getting started, growing quickly and working set reasonably fits in cache and the other that has achieved reasonable scale, is growing and working set starts spilling to disk The gap between results at these two sizes tells you something useful about how a service handles storage pressure as data grows.
Metrics captured
We report average TPS, average latency, P95 latency, and P99 latency across all three runs per configuration. We publish the ranking for the best and worst run, and the details of each individual run are available in the repository.
Get started with our native Postgres Service
To try ClickHouse's native Postgres service, sign up for Private Preview using this link.
Sign upFairness
No benchmark is perfectly neutral. Every choice, from instance type to Postgres configuration, can favor one system over another. We explain our thinking behind each decision below, and document the exact settings used for each system in the benchmark repository alongside the results.
Client machine setup
We provisioned a 16 vCPU, 64 GB instance in the us-east-2 region to run the benchmark client, sized to ensure the client is never the bottleneck. All services were tested in the same region, so results reflect only database performance, not cross-region network latency. We also do not colocate client and database by availability zone, since not all services offer this capability. However, to ensure fairness for those that do, this is something we may consider adding in the future. Contributions are welcome.
Instance selection
For most services, we targeted a 1:4 CPU-to-RAM ratio and tested two sizes: 4 vCPUs/16GB RAM and 16 vCPUS/64GB RAM. Aurora does not offer an instance class that provides this ratio so we used a 1:8 ratio at two sizes as well: 4 vCPUs/32 GB RAM and 16 vCPUS/128 GB RAM.
We used Graviton instances with NVMe caching for all services that support them, including AWS RDS and Aurora. This gives competitors the same hardware advantage, even though NVMe in those cases is used for caching rather than primary storage.
Single-node
While all services offer high availability, the underlying architectures differ. Some use standby replication, others use shared or distributed storage layers. Since we are focused on single-node compute and storage performance, we tested without HA enabled to isolate that. We may add HA configurations as a separate dimension in the future.
Default Postgres configuration
We do not modify default PostgreSQL configurations across services; each system is tested using its out-of-the-box settings. This reflects typical user behavior, where most expect performance without tuning. We may incorporate Postgres configs as an additional dimension in the future.
A note on pricing
We did not compare pricing. Postgres managed by ClickHouse had not yet been released at the time of testing. We expect pricing to be competitive for similar hardware profiles and you'll be able to extrapolate price-performance from the results here once it is available.
The first cohort
Systems included
The first release of PostgresBench covers five services, each tested in two instance configurations: a smaller 4 vCPU / 16 GB setup and a larger 16 vCPU / 64 GB setup, or equivalent. This lets us observe how each service scales with more resources, not just how it performs at a single point.
All services were tested in us-east-2 with HA disabled, using Postgres 17 or 18 depending on what each provider supports. Aurora is the only service in this cohort still on Postgres 17 at time of testing.
| System | T-shirt size | Instance | vCPUs | RAM | Instance storage | Primary storage |
|---|---|---|---|---|---|---|
| Postgres managed by ClickHouse | Small | m8gd.xlarge | 4 | 16 GB | 237 GB - NVMe | NVMe |
| Postgres managed by ClickHouse | Large | m8gd.4xlarge | 16 | 64 GB | 950 GB - NVMe | NVMe |
| AWS Aurora PostgreSQL | Small | db.r6gd.xlarge | 4 | 32 GB | 237 GB - NVMe | Aurora storage |
| AWS Aurora PostgreSQL | Large | db.r6g.4xlarge | 16 | 128 GB | 950 GB - NVMe | Aurora storage |
| AWS RDS for PostgreSQL | Small | db.m8gd.xlarge | 4 | 16 GB | 237 GB - NVMe | 1000 GB - GP3 (16K IOPS) |
| AWS RDS for PostgreSQL | Large | db.m8gd.4xlarge | 16 | 64 GB | 950 GB - NVMe | 1000 GB - GP3 (16K IOPS) |
| Neon | Small | Serverless | 4 | 16 GB | N/A | N/A |
| Neon | Large | Serverless | 16 | 64 GB | N/A | N/A |
| Crunchy Bridge | Small | Standard-16 | 4 | 16 GB | N/A | 6,000 Baseline IOPS / 40,000 Maximum IOPS |
| Crunchy Bridge | Large | Standard-64 | 16 | 64 GB | N/A | 20,000 Baseline IOPS/ 40,000 Maximum IOPS |
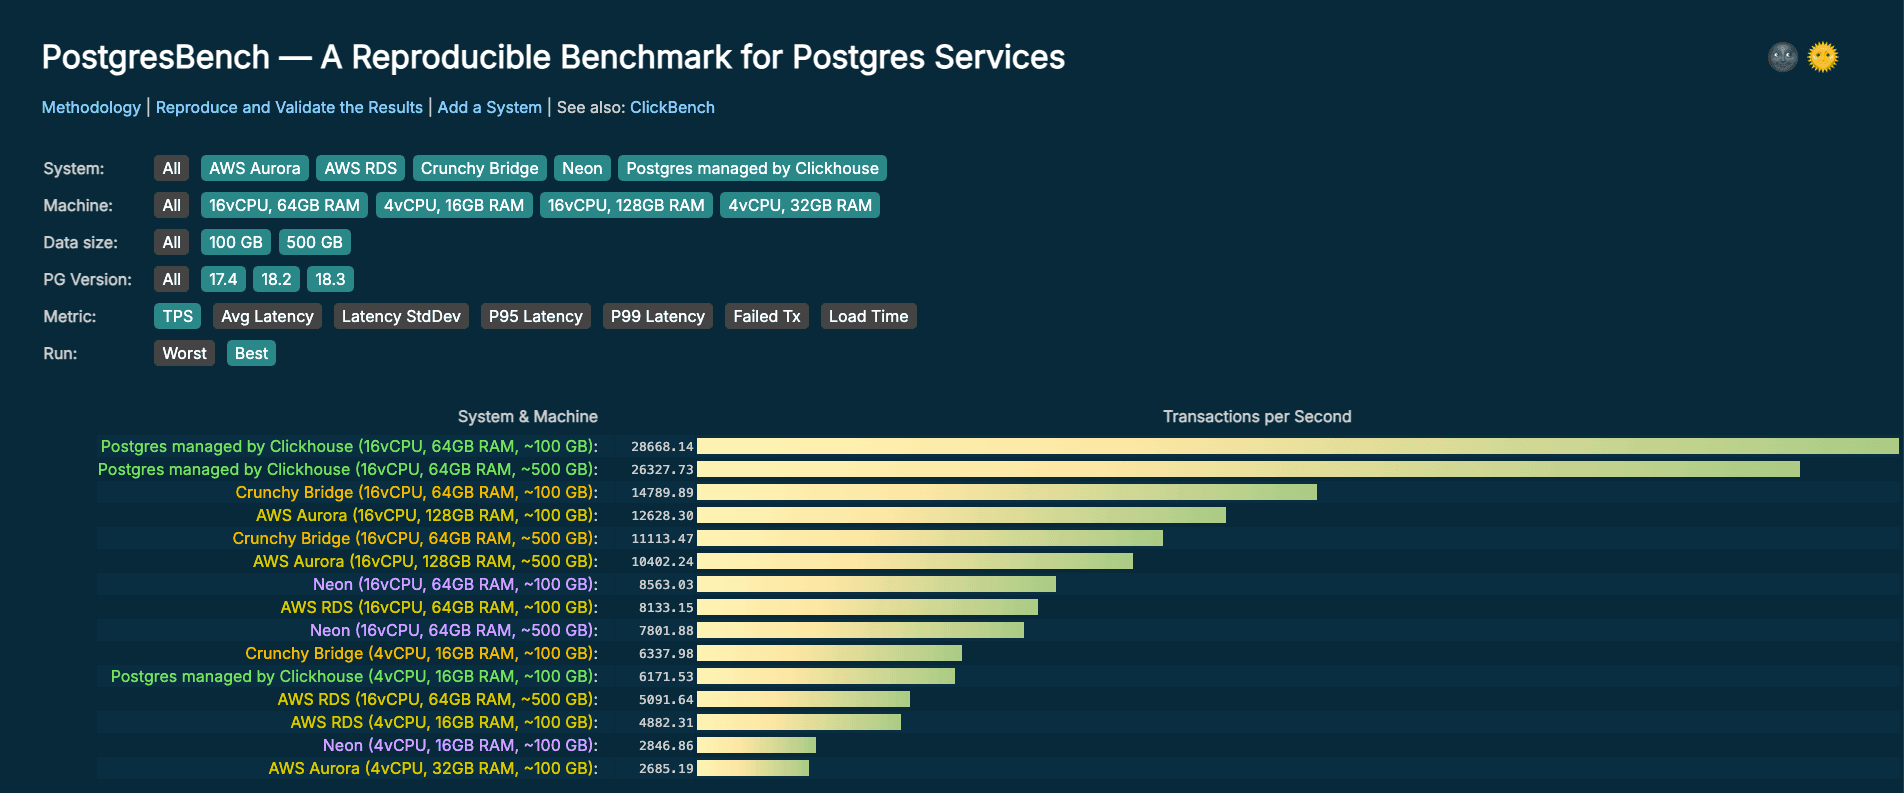
Results
The same script runs the same benchmark on all systems. Each run is done in isolation, no other concurrent processes are running on the machine or the database. Below is a summary table of the results. All results are available on PostgresBench.
Scale factor 6849 (~100 GB)
| Service | T-shirt size | TPS | Avg Latency (ms) | P95 (ms) | P99 (ms) |
|---|---|---|---|---|---|
| Postgres managed by Clickhouse | Small | 6172 | 41.466 | 64.027 | 80.89 |
| Postgres managed by Clickhouse | Large | 28668 | 8.908 | 10.231 | 11.683 |
| AWS Aurora | Small | 2685 | 95.297 | 165.546 | 298.391 |
| AWS Aurora | Large | 12628 | 20.242 | 30.972 | 39.044 |
| AWS RDS | Small | 4882 | 52.419 | 98.005 | 124.198 |
| AWS RDS | Large | 8133 | 31.435 | 72.509 | 97.688 |
| Neon | Small | 2847 | 89.907 | 106.145 | 116.473 |
| Neon | Large | 8563 | 29.832 | 41.423 | 49.213 |
| Crunchy Bridge | Small | 6338 | 40.376 | 66.109 | 85.837 |
| Crunchy Bridge | Large | 14790 | 17.269 | 28.322 | 34.61 |
Scale factor 34247 (~500 GB)
| Service | T-shirt size | TPS | Avg Latency (ms) | P95 (ms) | P99 (ms) |
|---|---|---|---|---|---|
| Postgres managedby Clickhouse | Large | 26328 | 9.703 | 11.402 | 13.197 |
| AWS Aurora | Large | 10402 | 24.581 | 36.178 | 46.493 |
| AWS RDS | Large | 5092 | 50.239 | 88.656 | 117.905 |
| Neon | Large | 7802 | 32.804 | 47.539 | 56.302 |
| Crunchy Bridge | Large | 11113 | 22.996 | 36.402 | 41.683 |
Why Postgres managed by ClickHouse leads this benchmark
The TPC-B workload blends both read and write operations and can become I/O-intensive due to continuous DML (UPDATE) activity generating WAL records. This pattern is typical of fast-growing OLTP workloads, where sustained write activity drives WAL generation and makes disk performance a critical dimension for Postgres performance.
Postgres managed by ClickHouse is backed by NVMe storage that is physically co-located with compute. This enables microsecond-scale disk access latency, rather than milliseconds, along with consistently high IOPS that are neither shared across tenants nor constrained by network bandwidth. As a result, it can deliver significantly better performance than architectures built on shared storage, such as EBS or object storage, without compromising availability or durability
In contrast, alternatives like EBS-backed volumes introduce network latency into the I/O path. While reads may benefit from the kernel page cache, every fsync, including transaction commits, must still be acknowledged by the remote storage layer. For write-heavy workloads like the one used in this benchmark, that per-commit overhead accumulates quickly and directly impacts performance.
TL;DR: Most of the time, Postgres isn’t slow, your storage is. Stay tuned for a deeper technical dive on this topic coming soon.
The image below shows the reduction in P99 latency for disk-bound workloads when moving from traditional Postgres to NVMe-backed Postgres.
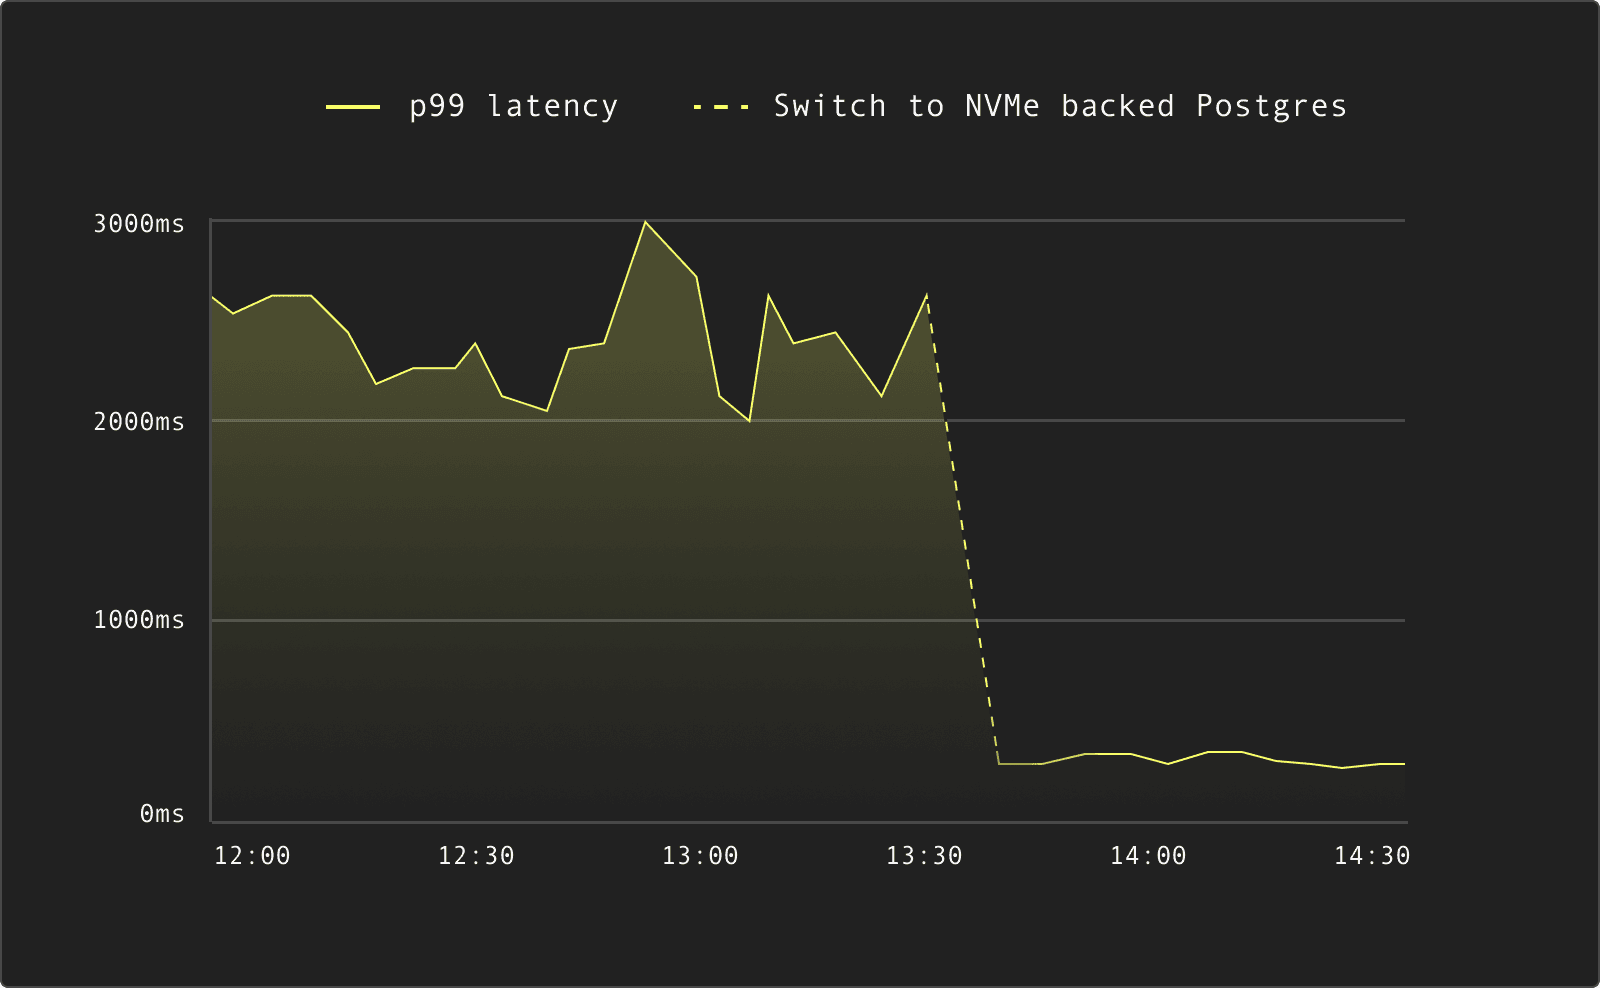
For Postgres workloads that are primarily throttled by disk IOPS and latency, this architectural difference is a decisive factor. The benchmark results reflect that directly.
Built to be verified
The full benchmark repository is open source.
Publishing structured JSON for every run means results can be compared programmatically, not just visually. The repository includes, script to run the benchmark and all raw results. If a configuration is incorrect or gives an unfair advantage to any service, it can be reviewed and corrected in the open.
The repository is available at github.com/ClickHouse/PostgresBench.
Submit results
To run the benchmark against your own instance, simply execute this command. It takes between 30 and 40 minutes to run.
# Set connection parameters
export PGHOST="your-database-host"
export PGPORT=5432
export PGUSER="postgres"
export PGPASSWORD="your-password"
export PGDATABASE="postgres"
# Required: instance hardware details
export VCPUS=16
export RAM_GB=64
# Required: instance metadata
export SYSTEM_NAME="Postgres by ClickHouse"
export INSTANCE_TYPE="m8gd.4xlarge"
export INSTANCE_STORAGE="950 GB - NVMe"
export PRIMARY_STORAGE="NVMe"
# Optional: output
export OUT_JSON="results.json" # Output file name (default: oltpbench_result.json)
# Run the benchmark
./run.shThe script handles the data initialization, runs the benchmark three times and writes the result in a JSON file.
To add your system:
- Clone the benchmark repository
- Follow the documented infrastructure setup to match the tested instance specs
- Run
run.shwith the published parameters - Create a Pull-Request to submit your results
- We will review the configuration and publish the results
PostgresBench is live
PostgresBench is now live, with all benchmark results publicly available to explore and compare.
Interested in adding your system to the board? Contributions are welcome! Clone the repository, run the benchmark, submit your results, and help make this the most complete Postgres performance reference available.
Get started with our native Postgres Service
To try ClickHouse's native Postgres service, sign up for Private Preview using this link.
Sign up


