A query that's slow is slow for a reason. Postgres exposes many of the signals; pg_stat_ch captures them per statement, and Postgres Query Insights puts them together.
Query Insights is now in preview for ClickHouse Cloud Managed Postgres: every query pattern your database runs, ranked by impact, with the full diagnostic picture of why each one is slow. pg_stat_ch is the open-source extension we built to stream per-statement telemetry into ClickHouse, and make Insights possible.
What you get
Three surfaces, in the order you'd actually use them.
Overview
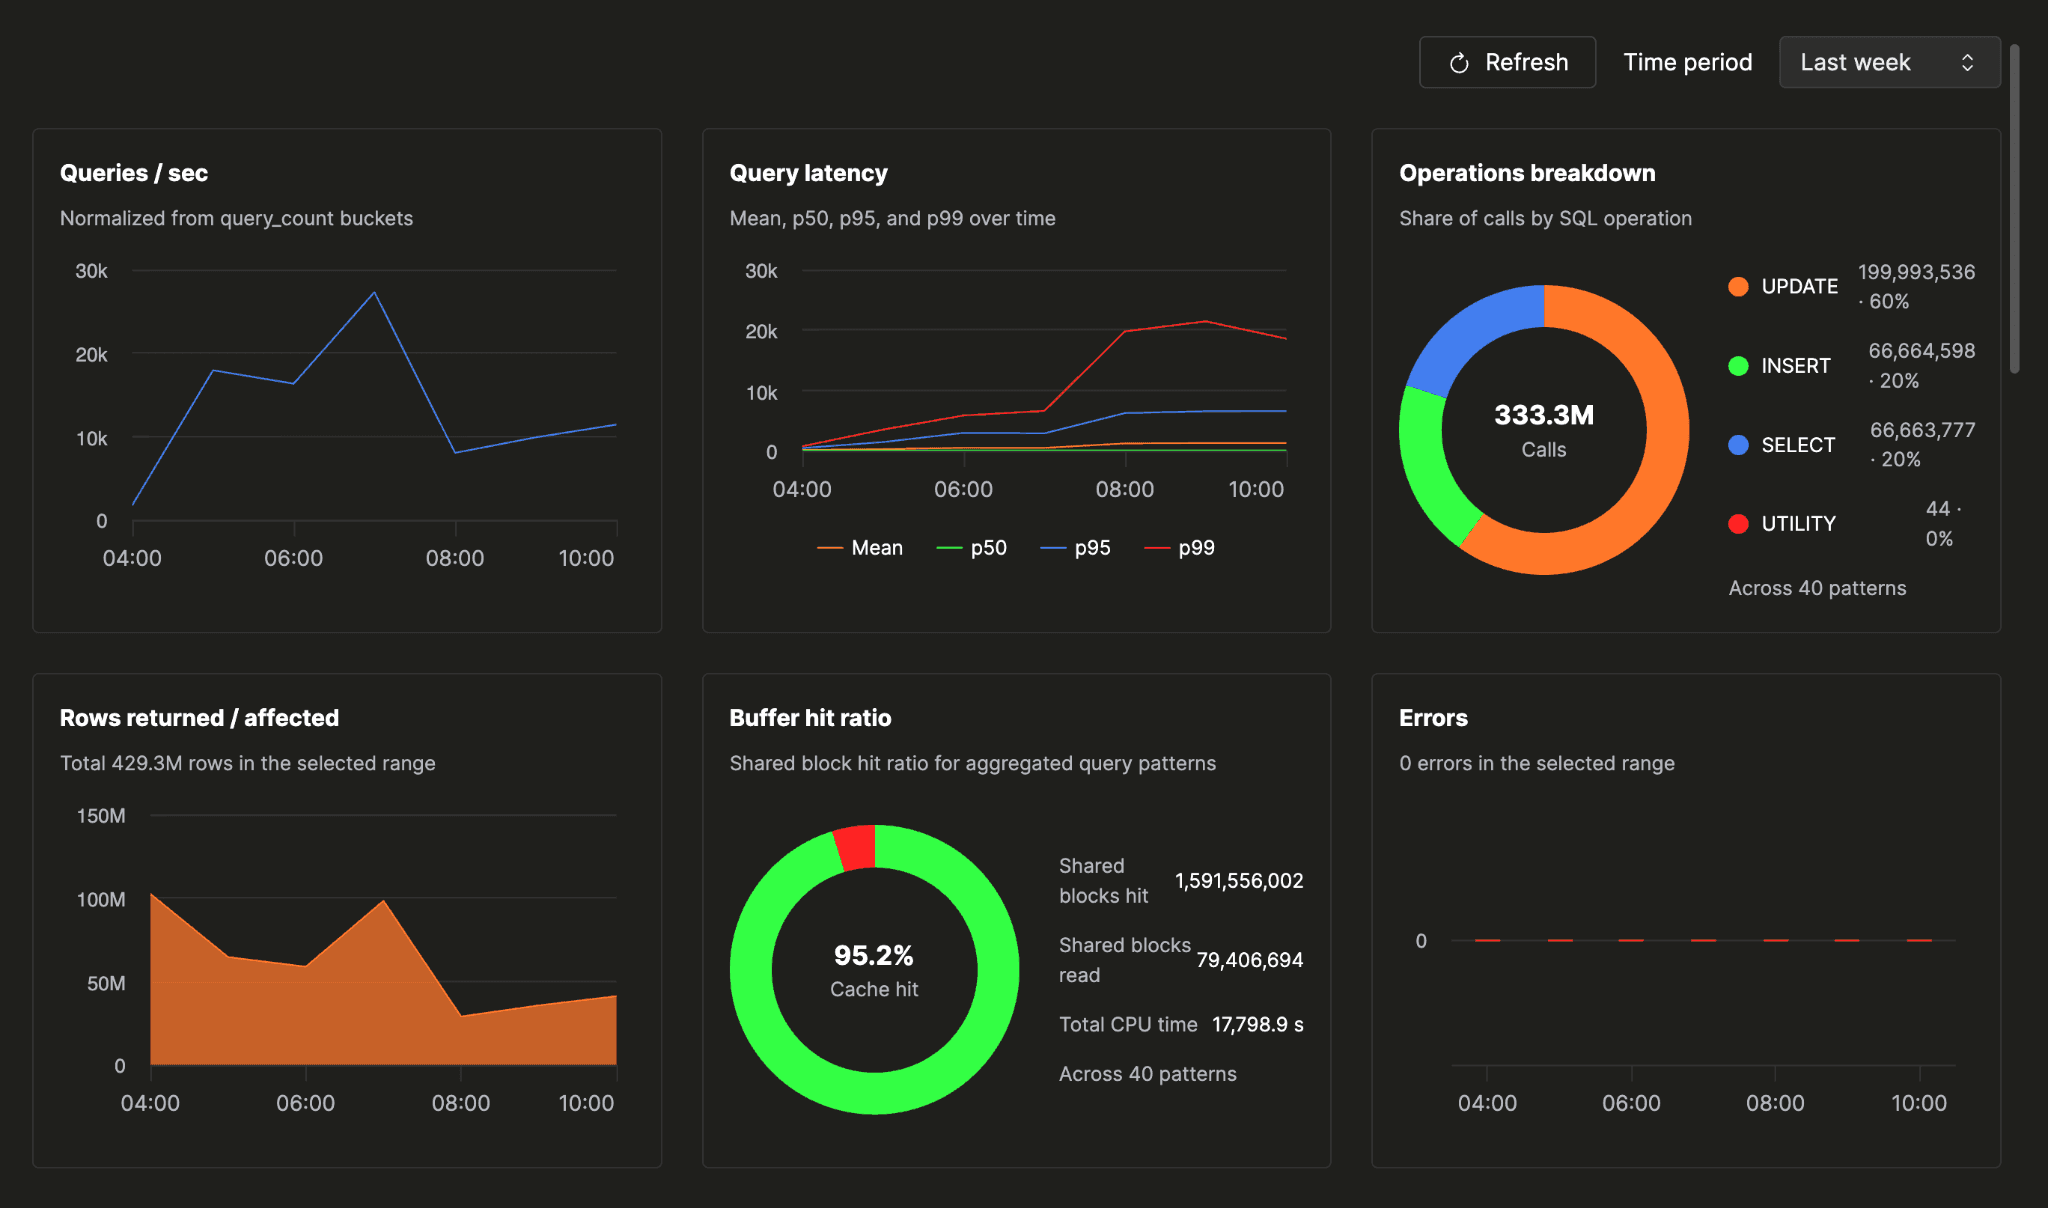
You open the Query insights tab and land on a database health check that fits on one screen:
- query volume
- error rate
- cache hit ratio
- the mix of operations your workload is actually made of
- latency over the time window you pick
One screen tells you whether your database is healthy. No drilling down, no cross-referencing, no holding multiple tabs in your head at once.
Slow patterns
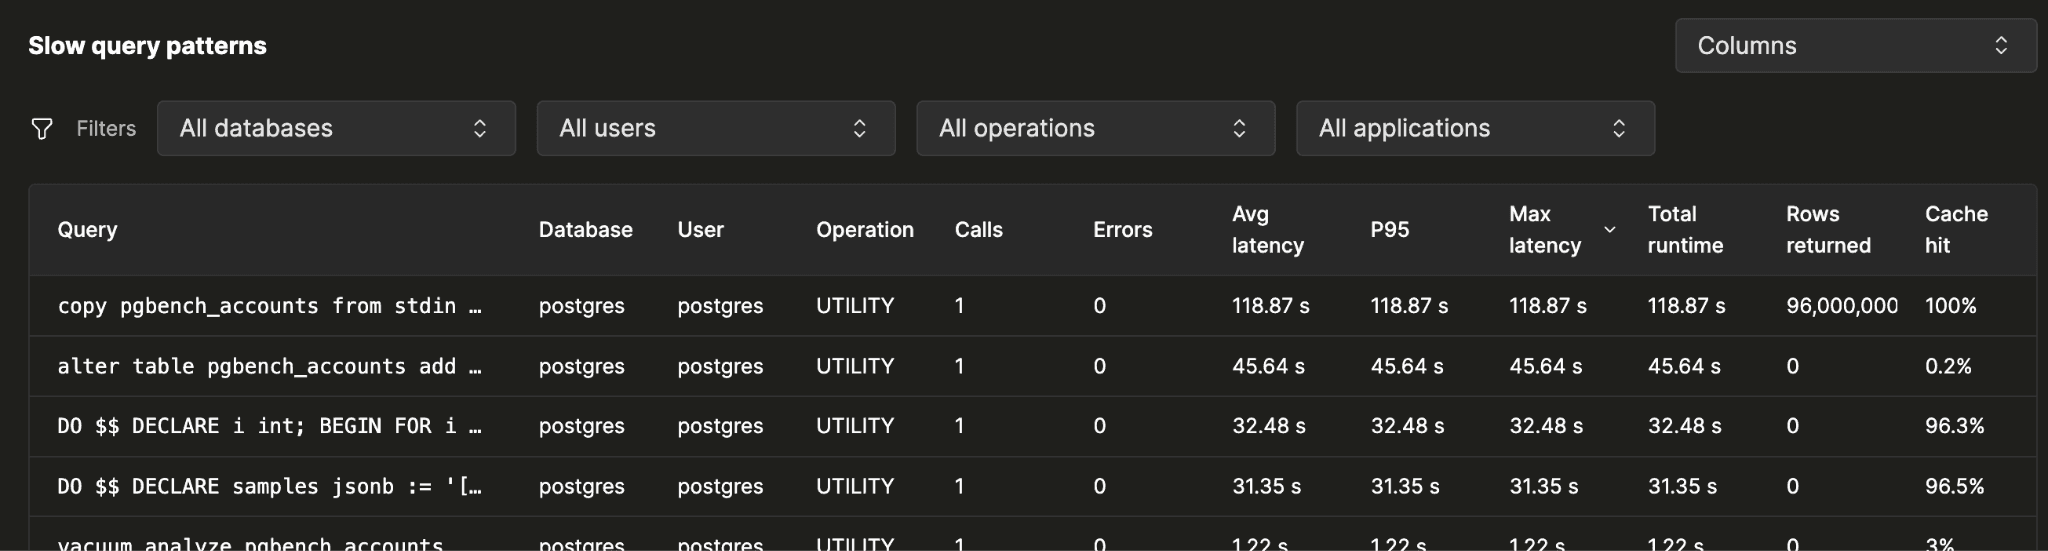
When the overview points at trouble, the patterns table is where the investigation starts. One row per query pattern your database has run, sorted by whatever you suspect:
- total runtime
- total CPU
- error count
- max latency
- P95
When you sort by total duration, the top pattern is usually the answer to "what is costing me the most?" It may not be the slowest pattern individually. A query that runs eight million times a day at twelve milliseconds can matter more than one that ran once at three seconds.
Each sort gives you a different lens. Total CPU shows compute-heavy patterns. Error count surfaces repeated failures. P95 catches the worst outliers. Together, they turn a broad sign of trouble into a specific place to start.
Narrow the table to whichever slice of your workload you're investigating, by:
- database
- application name
- operation type
- user
"Show me only what the orders service is doing on the sales db."
Detail
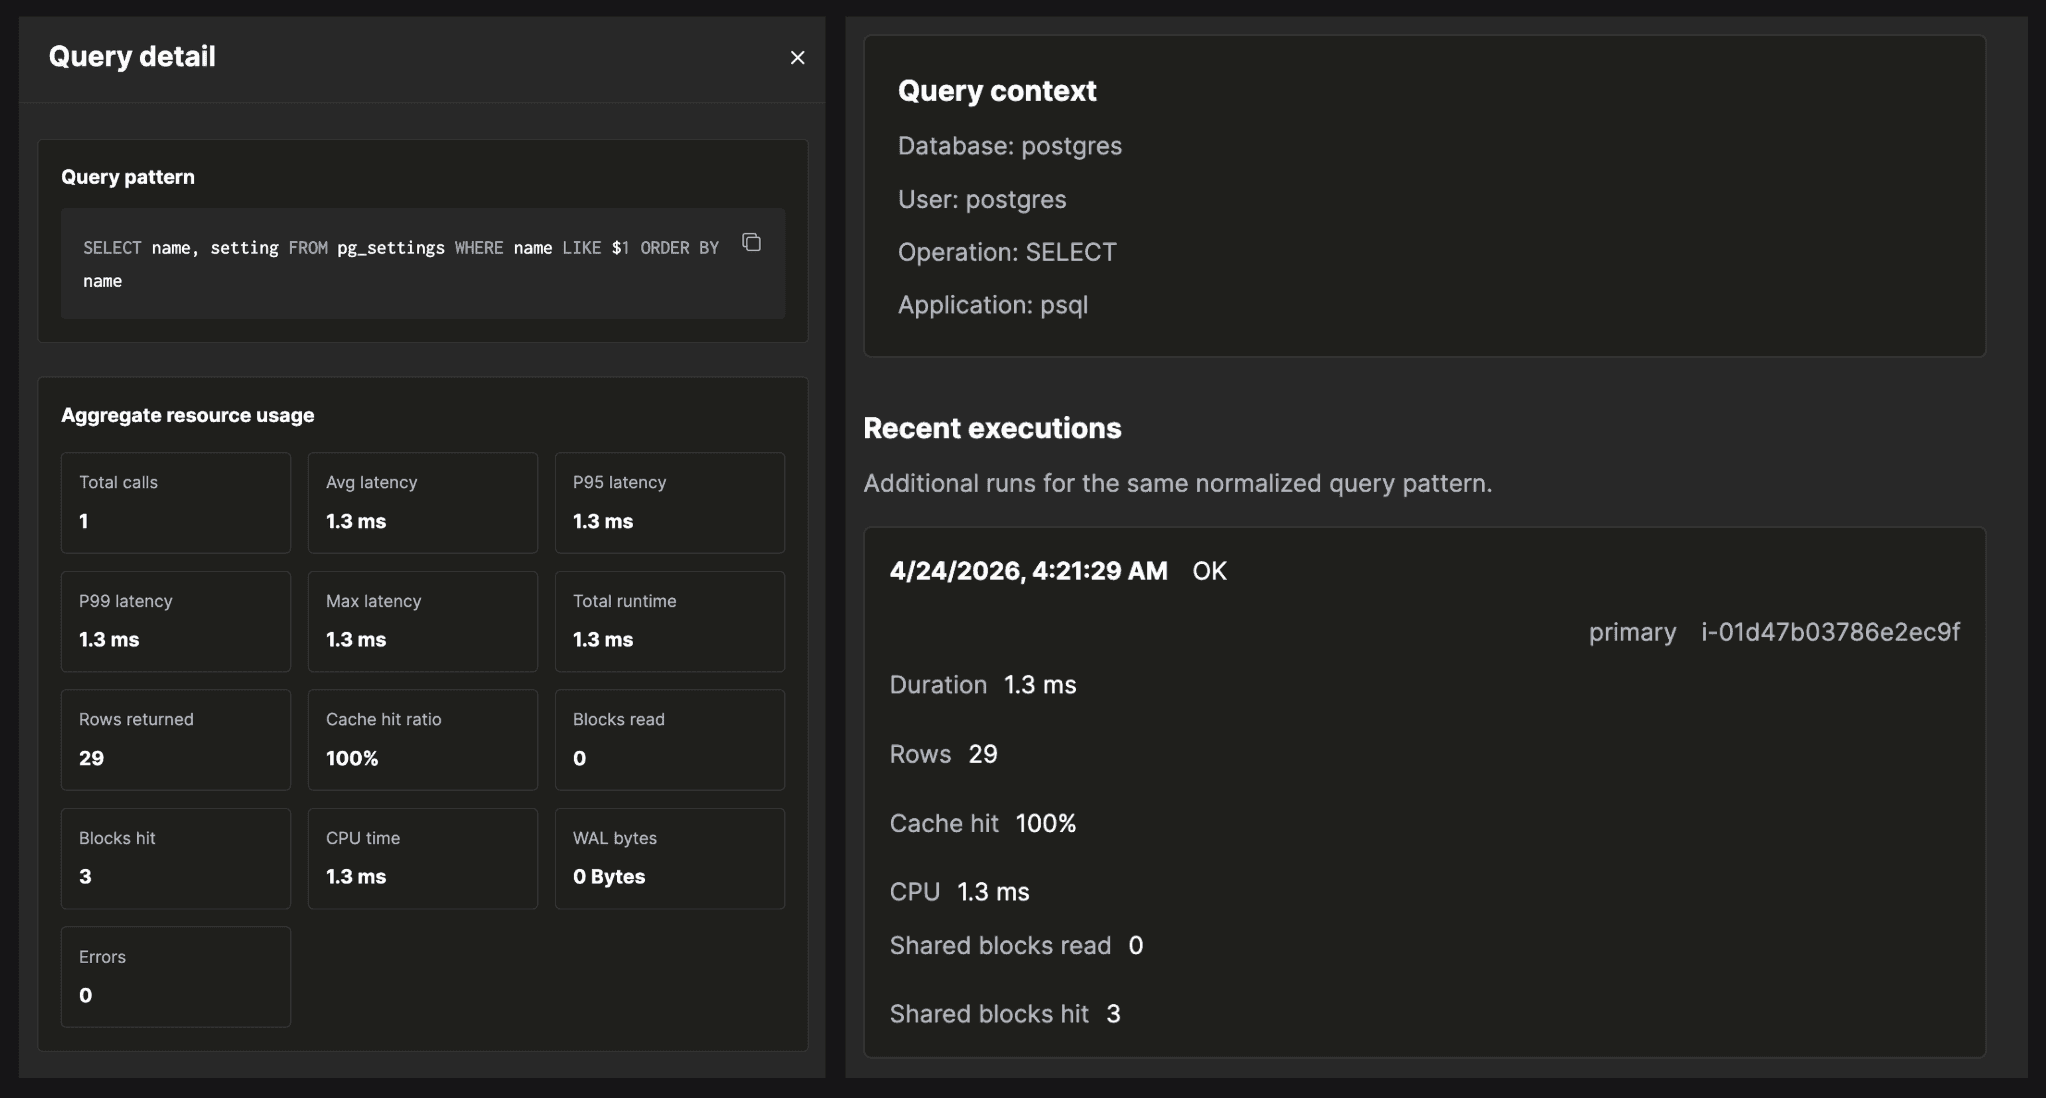
Click into a pattern's row and the flyout opens. This is where investigations land.
The flyout takes every execution of the pattern over your time range and aggregates the counters that explain why it's slow:
- percentile latencies (p95/p99)
- where the time went, by CPU
- what got read from cache versus disk
- what spilled to temp (blocks read)
- where parallel workers should have launched and didn't
- where the WAL volume came from
Everything you need to diagnose a slow pattern is in one place, in one glance.
A latency regression, end to end
Here's a concrete walkthrough. You run a managed Postgres instance backing a sales orders dashboard. Over the past week, p99 latency on the dashboard's main endpoint has been creeping up. p50 is fine. Users are occasionally reporting slow queries and query timeouts. You open Query Insights to find out which query is responsible.
1. Open the tab.
You land on the instance, click Query insights. The stats grid: query volume flat, error rate flat, cache hit ratio at 99.4%. Nothing alarming at first glance.
2. Switch the chart metric.
The default chart is query_count. You switch it to p99_duration. The line slopes up over the week. p50 stays flat. The regression is real and it's on the tail.
3. Find the slow pattern.
You sort the patterns table by Total Duration or P99 or Avg Duration descending. The top row:
SELECT *
FROM orders
JOIN customers ON orders.customer_id = customers.id
WHERE orders.status = $1
ORDER BY orders.created_at DESC
LIMIT $2;4. Open the pattern flyout.
- Average latency is healthy, in the single-digit milliseconds
- p99 is in the hundreds of milliseconds (the tail is the actual problem)
- cache hit ratio is near 100%, so the bottleneck isn't shared buffer I/O
- WAL bytes are zero, as expected for a read-only query
Drilling into recent executions in the flyout:
Temp block opsis non-zero (the sort is spilling to disk)Parallel workers launchedis well belowparallel workers planned
That combination matters. It is not a write problem. It is not a buffer-pool problem. The query is spilling while sorting, and the spill is what's pushing the tail.
5. Fix.
Once the spill is identified, the next step is to confirm it with EXPLAIN (ANALYZE, BUFFERS). The plan will show the Sort node marked as spilling to disk, along with how much memory the sort actually consumed during execution. You'll see Sort Method: external merge Disk: NkB where a healthy plan would have shown Sort Method: quicksort Memory: NkB. The Disk figure tells you how much temp file the sort wrote. Compare it to your configured work_mem: a small overshoot is a tuning problem, a large multiple is a plan-shape problem.
From there the fix is clear: add an index that supports the filter and ordering so Postgres can avoid the sort entirely, increase work_mem for the right role or session so the sort has enough room to run in memory, or both. Query Insights points you at the pattern; EXPLAIN ANALYZE tells you what to do about it.
Healthy instance
After applying the fix, the difference shows up immediately in Query Insights. The spill disappears from the pattern's detail, parallel workers launch as planned, and the p99 comes back down to match the p50. The overview confirms it: cache hit ratio steady, no new errors, latency flat across the board. The instance is healthy again.
A healthy instance has a familiar shape. Cache hit ratio sits in the high nineties. Query volume moves with your application traffic, not against it. Error rate stays flat or zero. The patterns table has no single dominant offender: total duration is spread across many patterns, none of them pulling far ahead of the rest. Latency percentiles track each other closely, with p99 staying within a reasonable multiple of p50. When everything looks like this, Query Insights is quiet in the best possible way.
How it's built
A few design choices behind the product:
We use the same engine our customers do. The Insights backend is ClickHouse Cloud — the fastest way we know to store and query data at this shape and volume. Per-query telemetry from a busy Postgres instance is millions of rows a day. ClickHouse ingests from many producers, columnar compression that keeps months of per-execution detail cheap to retain, and sub-second aggregations over billions of rows. The UI stays interactive when you're slicing across a week or a month of every executed statement on a busy database: percentile recomputes, ranking resorts, filter changes are very fast.
Normalized in Postgres, before the wire. We hook the parse-analyze phase, the moment after Postgres parses a statement and identifies the location of every literal in the query text. We swap each literal for a placeholder ($1, $2, …) and cache the resulting pattern in a per-backend LRU keyed by queryid. When the executor finishes the statement, that cached pattern is what gets attached to the event before it's enqueued. The exact statement with values never leaves the database. PII and PHI are not in the telemetry stream by design.
Out of the way of the database. ~3% producer overhead per statement: enqueue path uses a non-blocking try-lock on a shared-memory ring buffer. If the lock is contended, the producer queues locally and flushes at transaction end rather than spinning or blocking. Under pressure, the extension drops events with a counter rather than back-pressuring Postgres. The first rule of telemetry: never become the bottleneck you were trying to measure.
Open source. pg_stat_ch is Apache 2.0 License. Run it against any Postgres, ship to any ClickHouse.
Raw events, not aggregates. pg_stat_ch emits one raw event per executed statement (top-level and nested), subject to sampling. Every percentile, ranking, and breakdown in the UI is a ClickHouse query against the same event stream.
What's next
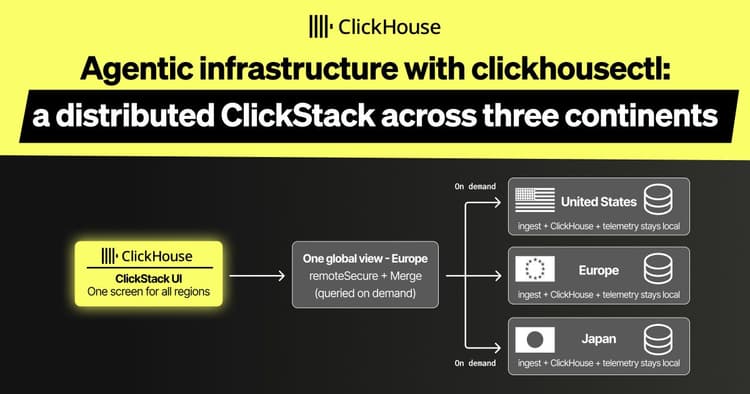
Some of what we're working on next: an Open API exposing the same data the UI runs which is purpose-built for the agentic era. Give your AI agents direct access to pattern aggregates and per-execution counters, so they can reason over your data, autonomously identify bottlenecks, and take action to fix slow or failing parts of your application.
Here is a sneak peek into the open API and how it empowers agents. We tested this against a demo application called HouseClick.
PR from that demo: https://github.com/ClickHouse/HouseClick/pull/55
We are also working on wait events for per-execution attribution of what Postgres was actually waiting on (I/O, locks, buffer pins, IPC, client), for the UI case where CPU and I/O counters are both small but the query still took hundreds of milliseconds.
We also plan to expose EXPLAIN plans for slower queries to help users identify slow parts of the execution plan. The goal is to keep this configurable to manage load on the database, for example, enabling ANALYZE without BUFFERS, or setting query latency thresholds for plan collection.
On top of this data, we plan to provide actionable recommendations such as index hints, work_mem tuning suggestions, and autovacuum guidance to reduce the cognitive load of figuring out "what to do next." We also want to add regression alerts for cases like p99 latency doubling, new top offenders emerging, or error counts crossing defined thresholds.
Try it
Try Query Insights by signing up for ClickHouse Cloud and provisioning a Postgres service. If you already have a Postgres service and don't see Query Insights, please create a support ticket and we will enable it for you. To get started:
The extension that powers Query Insights for Postgres lives at github.com/clickhouse/pg_stat_ch under Apache 2.0: file issues, send PRs, run it against any Postgres.
Sign up for Postgres managed by ClickHouse
Want to learn more about using Postgres managed by ClickHouse?
Sign up