50.3k
50.3k
Earlier this month, I joined a webinar with the Moniepoint engineering team to talk about something I have been thinking about since the PeerDB days: what changes when Postgres runs on local NVMe and what doesn’t?
The first part of the answer is about storage. Once a Postgres working set grows beyond memory, storage latency can become the bottleneck behind problems that look like database problems.
The second part is architectural. Faster storage can make Postgres dramatically faster for transactional workloads, but it doesn’t change the physical layout of a row store. At some point, analytical workloads need something different.
This post is the condensed version of that conversation.
Postgres isn't slow. Your storage is.
Postgres can go a long way. But as datasets grow into the hundreds of gigabytes or terabytes, and concurrency and throughput ramp up, a familiar set of performance problems starts to appear.
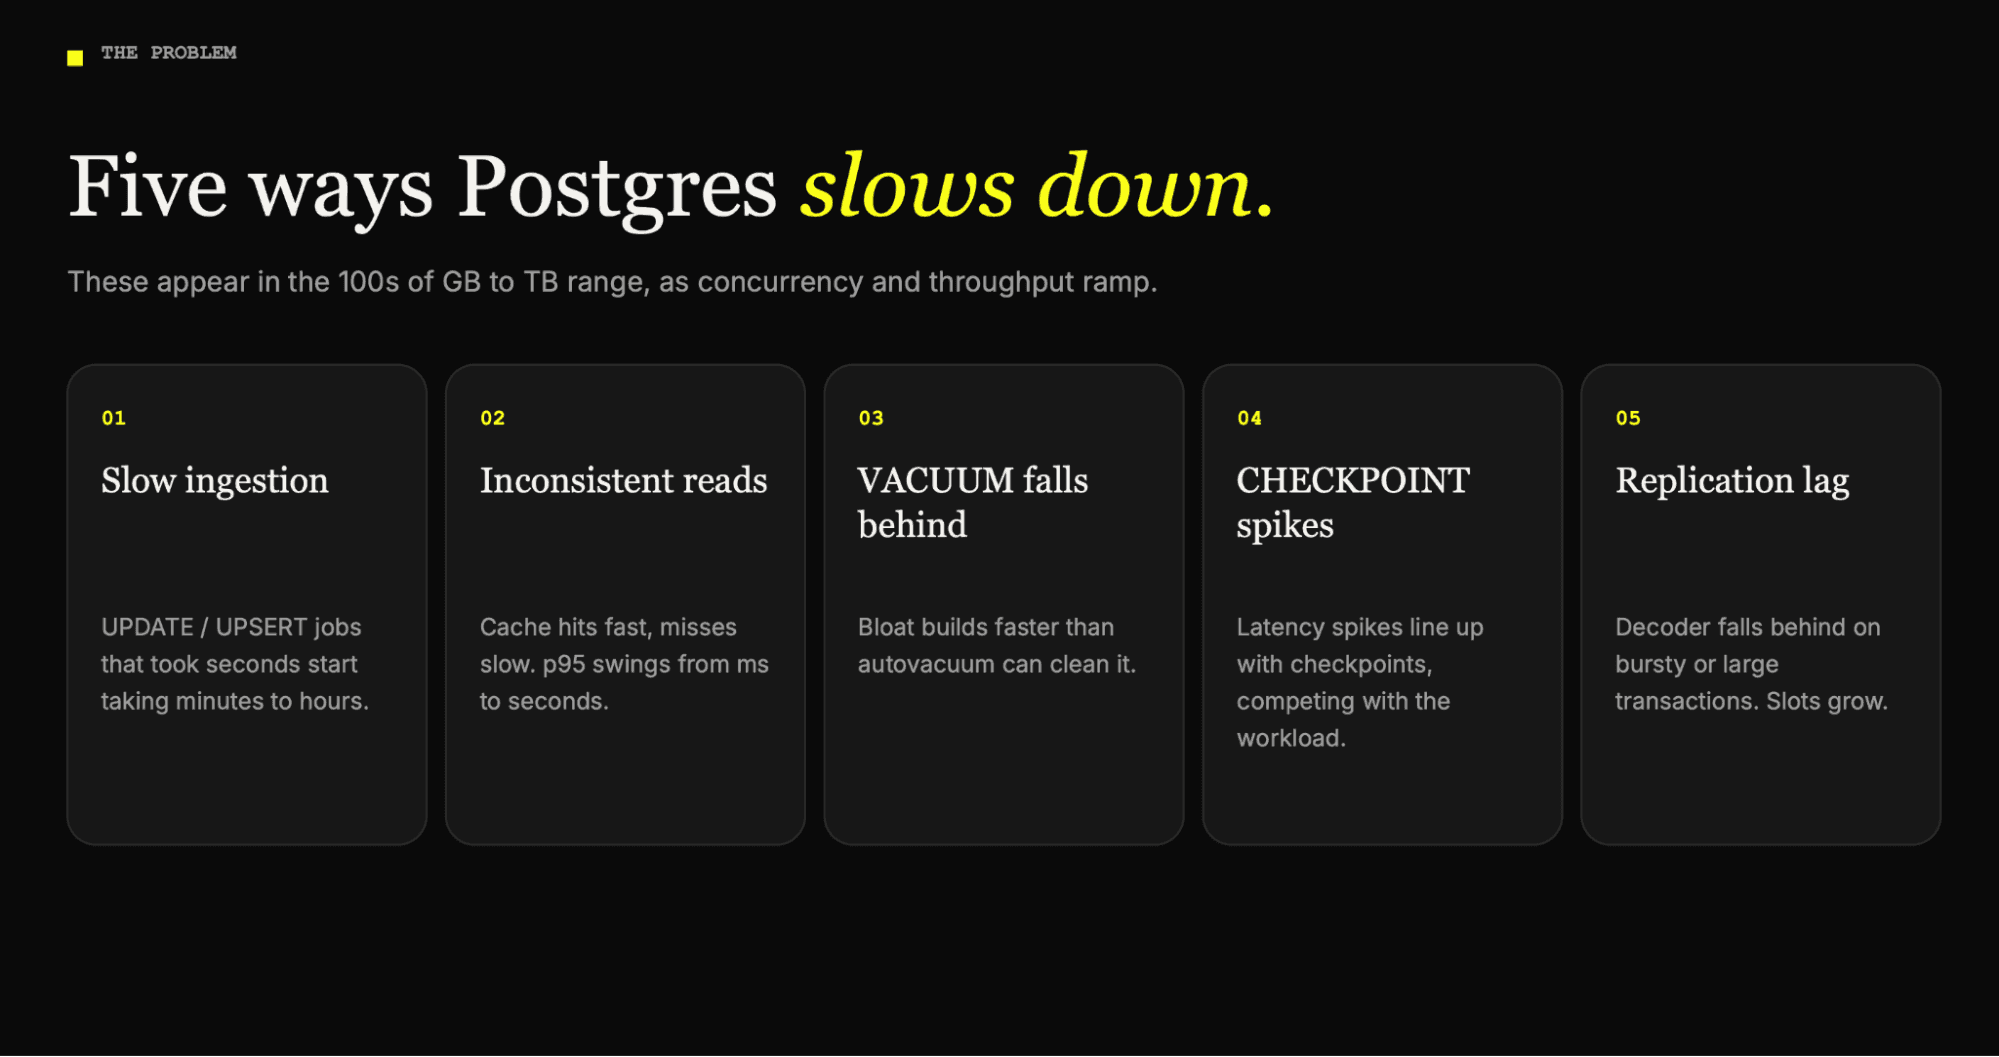
I see the same five repeatedly:
- Ingestion slows down: UPDATE and UPSERT jobs that took seconds start taking minutes or hours.
- Reads become inconsistent: Cache hits stay fast but misses don't, and p95/p99 latency can climb from milliseconds to seconds.
- VACUUM falls behind: Dead tuples pile up faster than autovacuum can clean them.
- Checkpoints create pressure: Writes and fsyncs compete with the application for I/O.
- Logical replication lags: The decoder can't keep up, slots grow, downstream systems fall behind.
For a payments company like Moniepoint, these map directly to slower transactions, slower balance lookups, late reconciliation, and fraud pipelines. At this scale, those consequences are unacceptable.
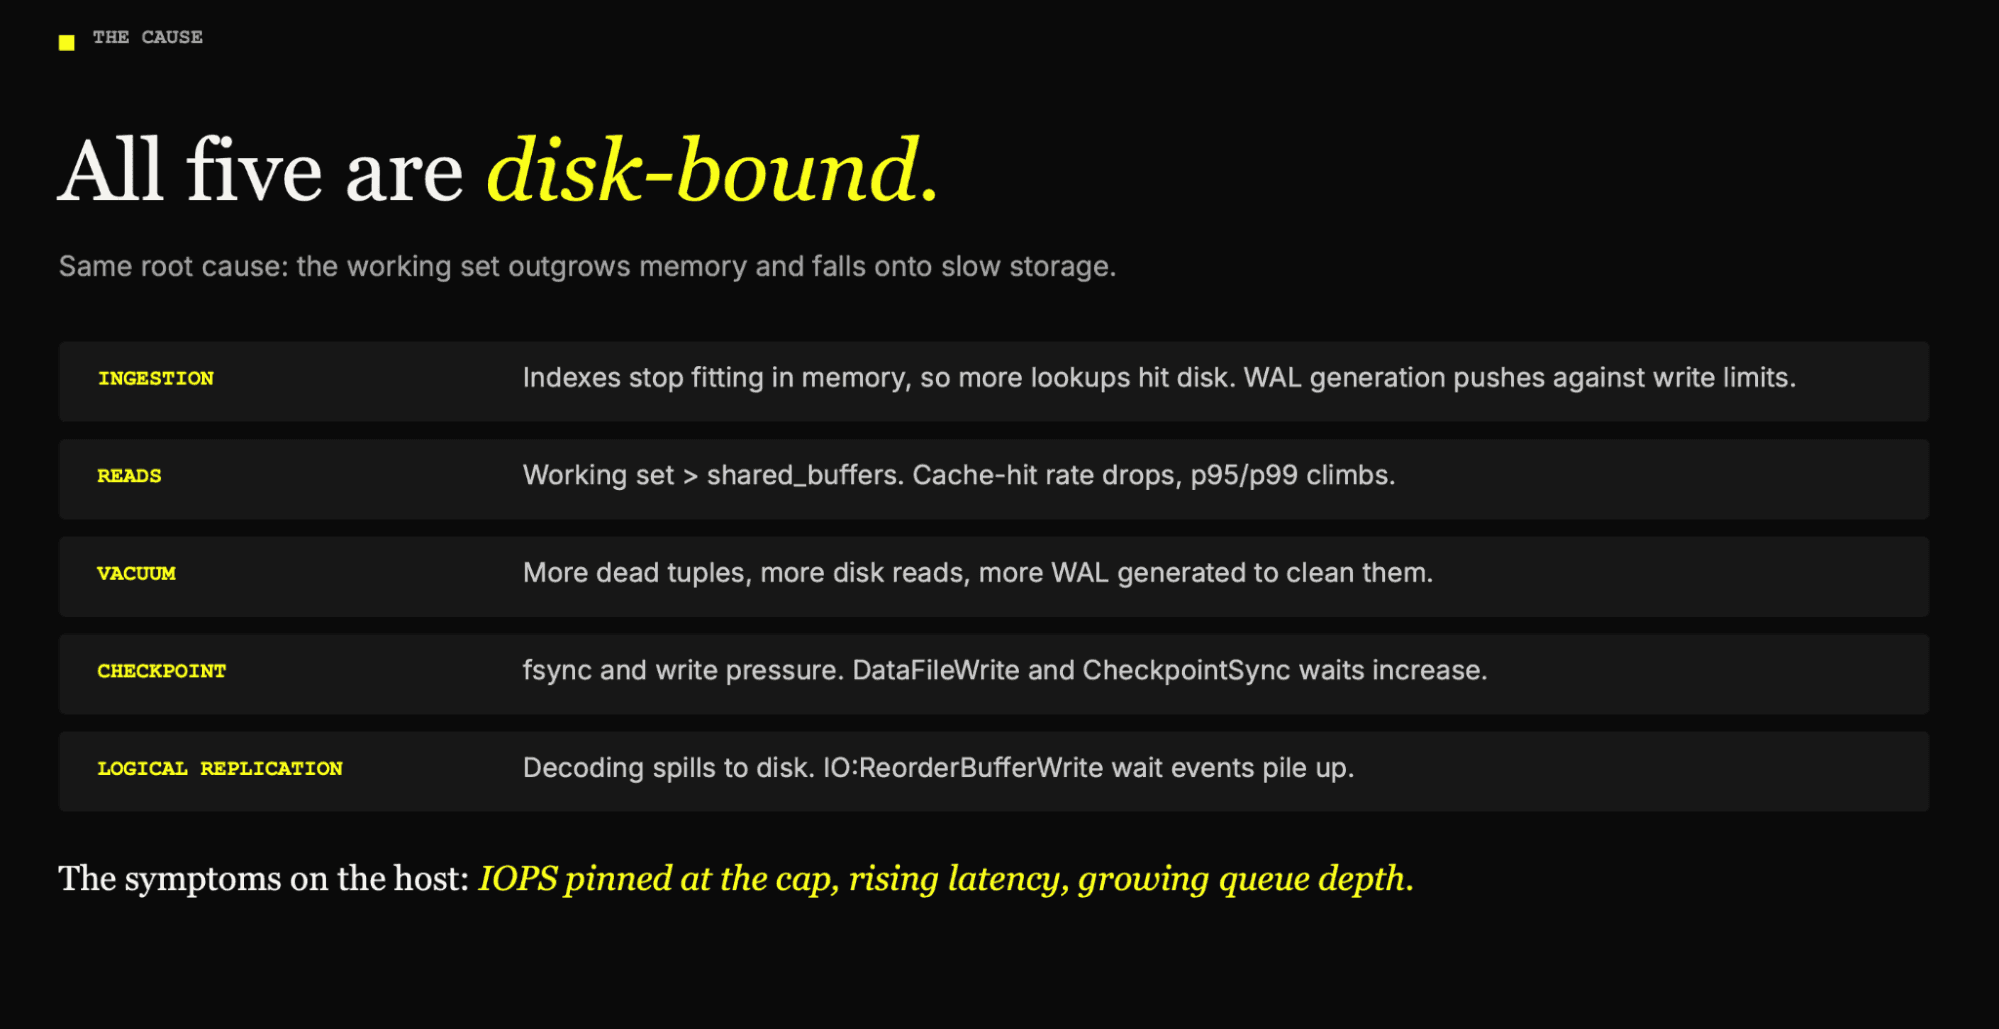
These problems have different symptoms, but they can share the same underlying cause: the working set outgrows memory, and the overflow lands on disk.
Indexes that no longer stay hot in memory require more disk reads. Cache misses make read latency less predictable. VACUUM has more pages to read and clean. Checkpoints introduce write and fsync pressure. Logical decoding can spill to disk.
On the host, the pattern is familiar: IOPS approach their limit, latency rises and queue depth grows.
What if disk behaved like a second tier of memory?
CPU caches are nanoseconds. DRAM, where shared_buffers lives, is around a hundred nanoseconds. Network-attached SSD such as EBS is one to ten milliseconds. Local NVMe sits in between at tens of microseconds: two orders of magnitude slower than RAM, but roughly a hundred times faster than EBS.
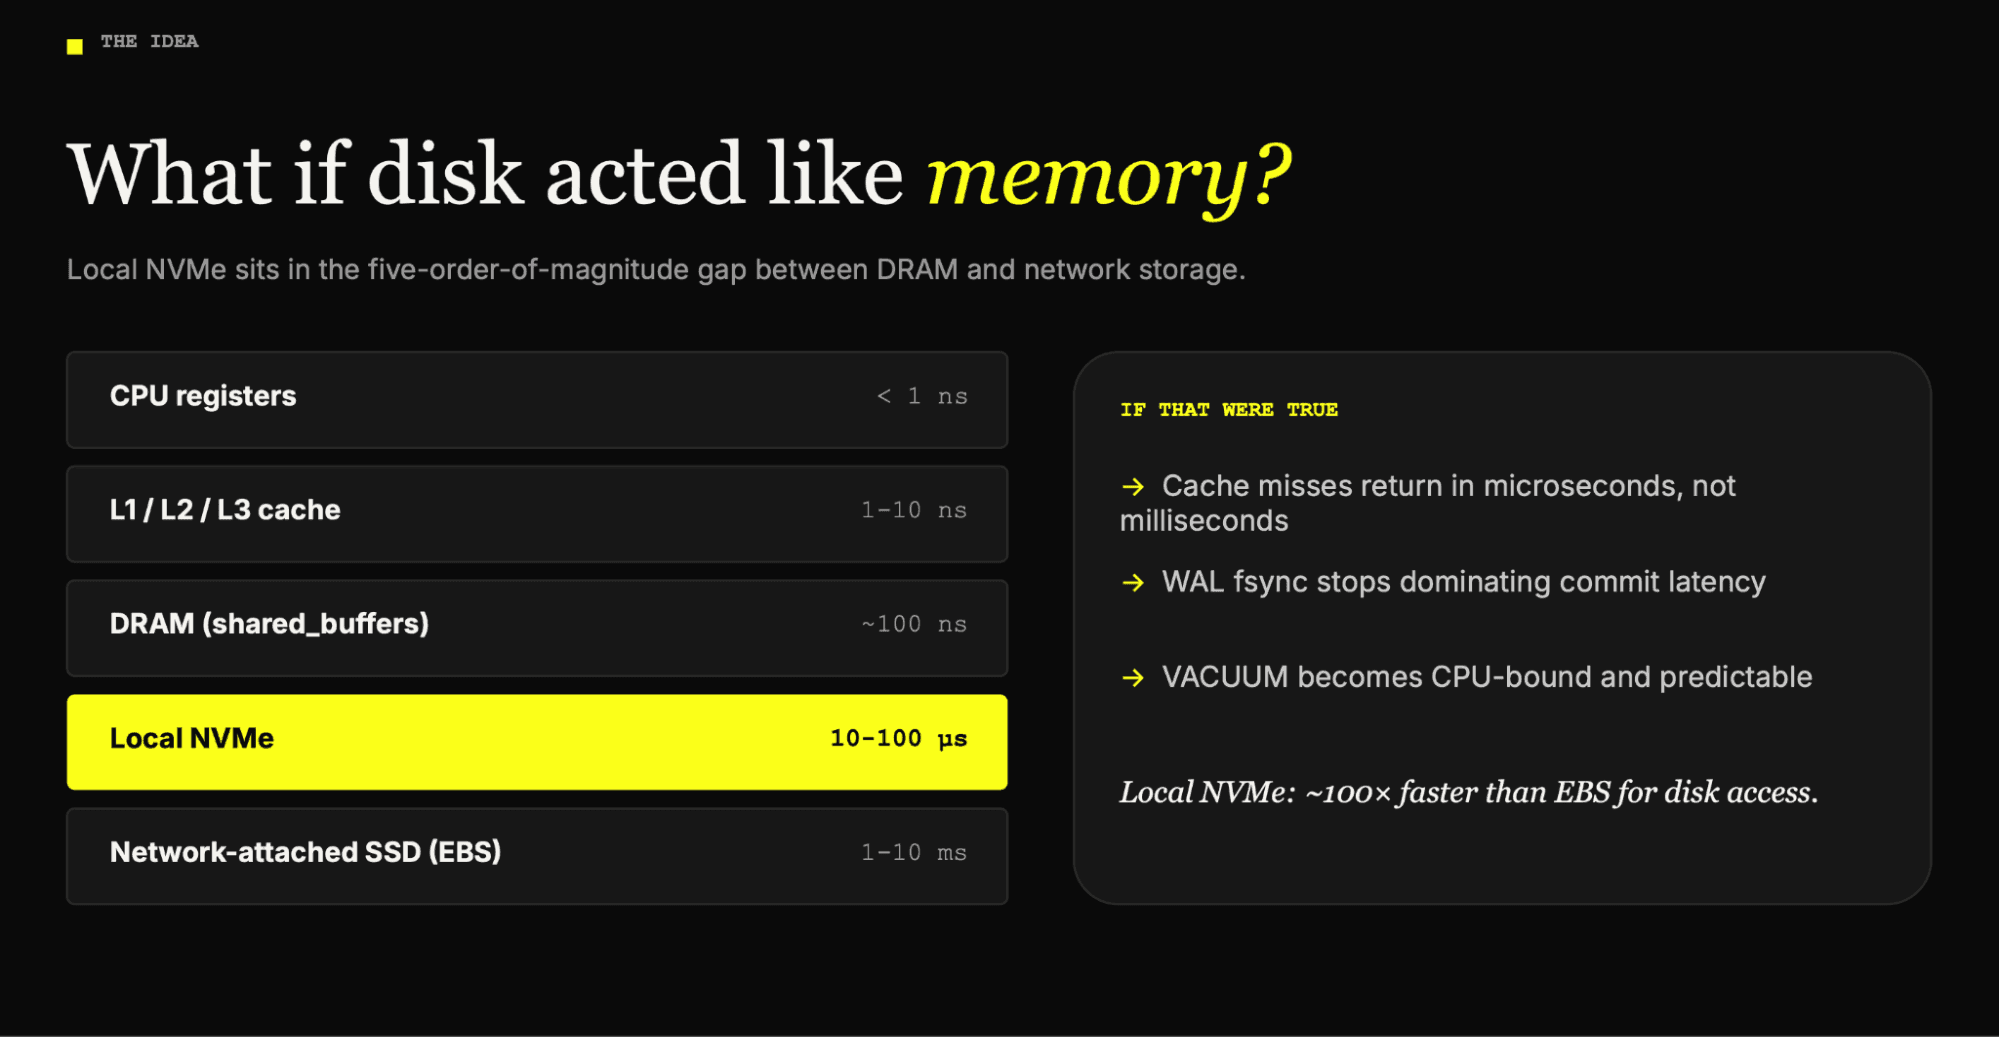
Compress a cache miss from milliseconds to microseconds and the system behaves as if it had more RAM than it does. Tail latencies improve because the cold reads that cause them are cheap. WAL fsync stops dominating commit latency. VACUUM becomes CPU-bound and predictable.
The benchmark
We set up eight identical clusters where the only variable was the storage class of the data volume: m6id.4xlarge (16 vCPU, 64 GiB RAM), a source build of Postgres 18.3, shared_buffers = 16 GB, checksums on.
Four used the instance-store NVMe, four used gp3 EBS at the 3,000 IOPS baseline. The dataset was pgbench at scale factor 33,000: 482 GiB of heap, 3.3 billion rows, about 30 times more than fits in memory. That is what a grown-up Postgres looks like, and far more representative than a benchmark that fits in cache.
The workload was 64 clients on 16 threads for five minutes, each transaction updating a random row across all 3.3 billion, with all eight hosts running in parallel and continuous profiling (Parca with eBPF, pg_stat_activity sampled at 1 Hz) on every host.
The result: 9.2× more throughput on NVMe, a median of 16,030 TPS against 1,734 on EBS. The number I care about more is latency: 4.0 ms per UPDATE on NVMe vs 36.9 ms on EBS. That is the difference between a predictable workload and a stream of hard-to-reproduce "some users see slowness" tickets.
Where the 37 ms goes
We can look at a mid-run snapshot of pg_stat_activity to understand what's going on.
On EBS, 29 of the 64 backends per host (45%) were parked in IO:DataFileRead at any moment, and none were on-CPU without a wait. On NVMe, 9 backends (14%) were in IO:DataFileRead and 13 were on-CPU doing real work. The rest on both sides were mostly in LWLock:WALWrite, the same CPU-side work either way.
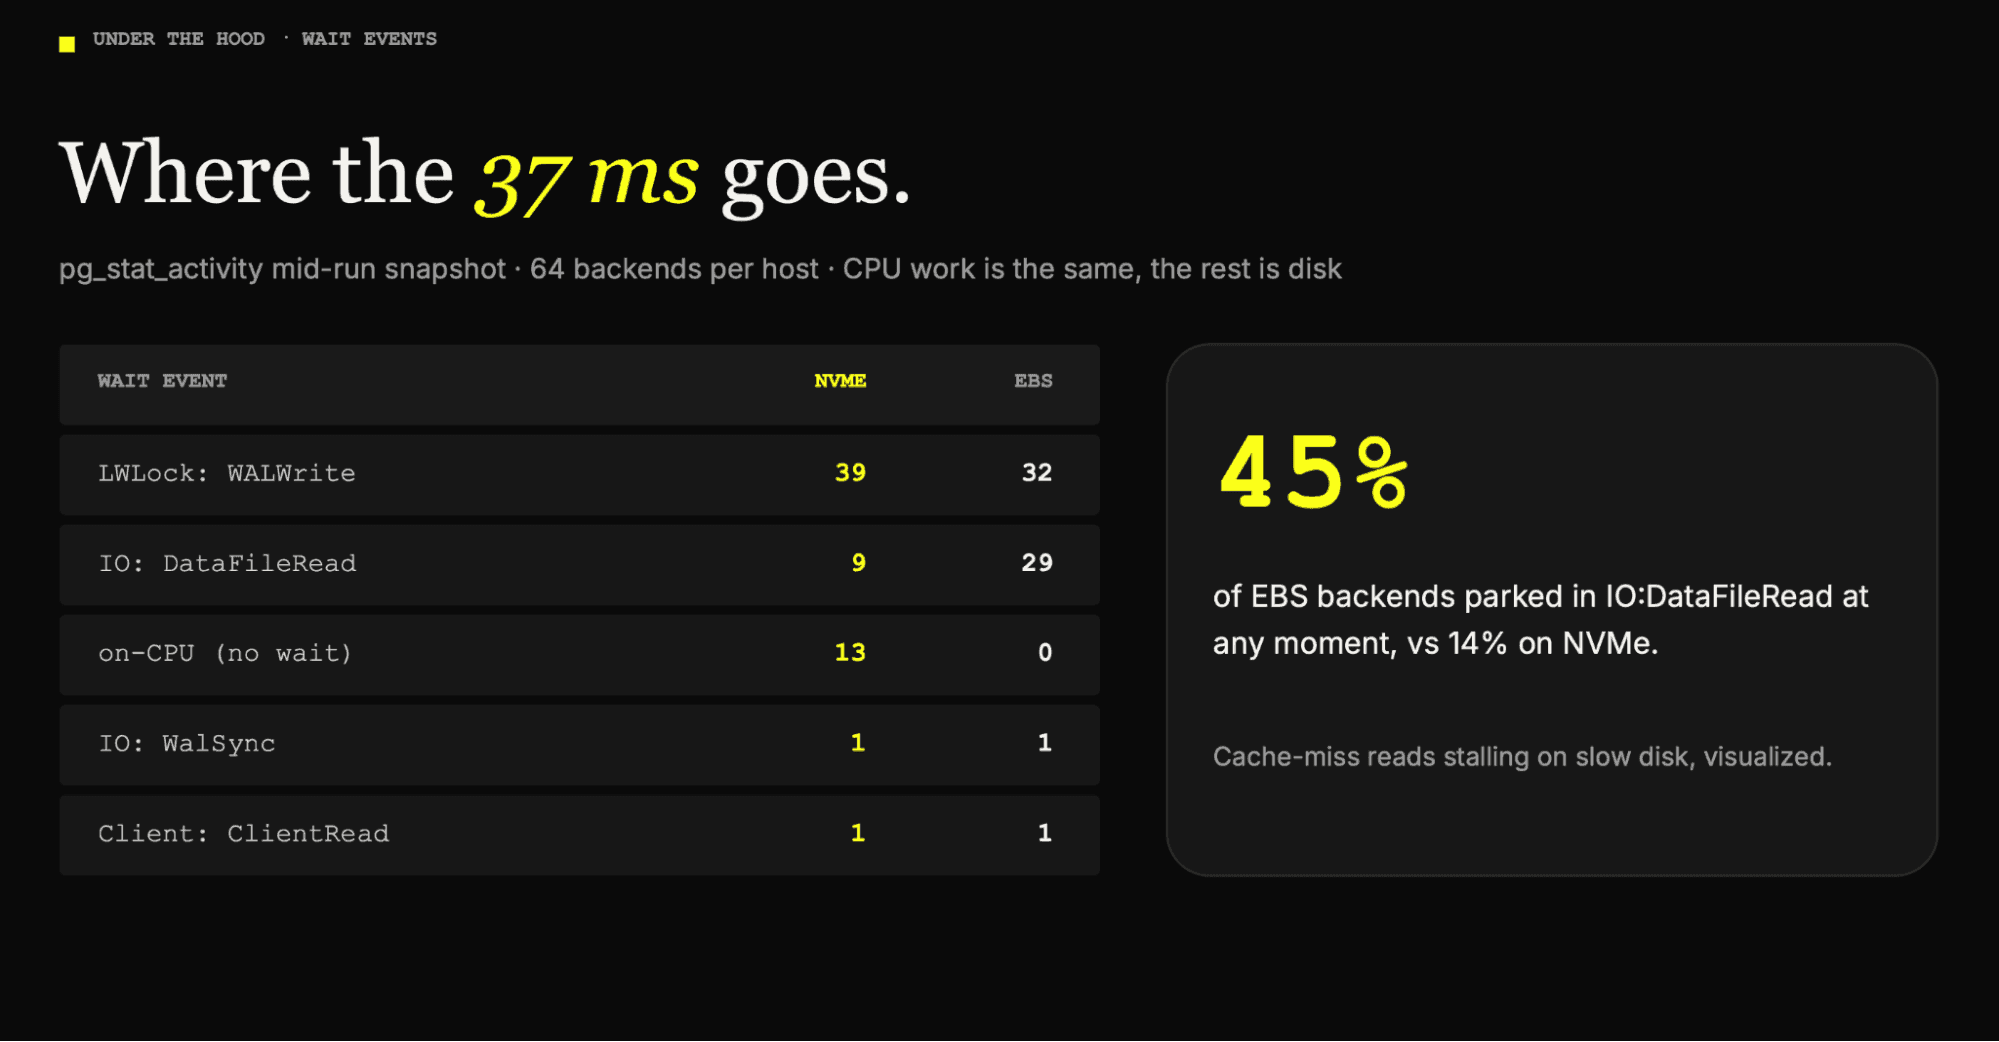
The counterintuitive part came from the CPU profiles. You might think EBS is underutilized and smarter pipelining could close the gap. It can't. The NVMe hosts burned about 2,253 CPU-seconds over the run (roughly 9.4 cores busy), compared to 251 on EBS (about one core). Per-function CPU share looks higher on EBS, but that is proportion, not throughput. Postgres does the same work on both; on EBS, it spends 89% of wall time off-CPU waiting for I/O. EBS isn't busy. It's blocked.
The other subsystems told the same story. Cleaning 10 GB of bloat with VACUUM took 366 s on NVMe versus 964 s on EBS (2.6×), with I/O wait dropping from 387 s to 3 s. Logical decoding of a ~10 GB slot ran at 89 MB/s versus 52 MB/s, only 1.7× because the decoder is single-threaded and reads WAL serially.
The objection: local NVMe is ephemeral
There is an obvious reason database operators don't simply replace durable network storage with local NVMe everywhere.
Instance-store NVMe is tied to the lifetime of the instance. Lose the instance or its underlying hardware, and the local volume is gone. You cannot detach it and attach it somewhere else.
You also don't get the block-storage snapshot model that many teams are accustomed to, and capacity is determined by the instance type.
So the interesting question isn't simply whether local NVMe is faster. It is whether we can get its latency while designing durability somewhere else.
Quorum HA with streaming replication
One building block is synchronous streaming replication across availability zones. A topology can use a primary plus two standbys, each with local NVMe, distributed across AZs. PostgreSQL's quorum synchronous replication can be configured with synchronous_standby_names = 'ANY 1 (standby1, standby2)'.
A commit waits for the fastest standby to acknowledge, never the slowest, and you can lose a node or an entire AZ without losing acknowledged transactions. Failover is a solved problem with tools such as Patroni or repmgr.
You are moving replication out of the storage layer and into Postgres, which understands LSNs and transactions and does the job better.
Continuous WAL archival
The second building block is continuous WAL archival.
Periodic base backups plus every WAL segment shipped to S3 in real time with WAL-G. RPO in seconds, eleven nines of durability, and an archive that lives outside your compute fleet and survives node, AZ and even region loss. The NVMe volume becomes a cache of state that is always recoverable: lose the node, replay the archive. The same archive gives you PITR, read replicas that never touch the primary, and branches from any LSN.
Faster disks raise the ceiling. They don't change the shape.
If local NVMe removes so much I/O wait, why not simply run everything on a very fast Postgres? Because storage latency is only one part of the problem. NVMe makes random access dramatically cheaper. It doesn't turn a row store into a column store. Transactional and analytical workloads ask fundamentally different things of a storage engine.
Postgres stores complete rows in 8 KB pages. A point read touches one page, MVCC keeps row versions in place so writers never block readers, and B-tree indexes make selective lookups cheap. The cost is that an aggregation over a billion rows reads every page of every row, whether it needs those columns or not. sum(amount) GROUP BY country still loads whole rows, even when each page comes back in microseconds.
ClickHouse stores and processes data column-by-column. Each column lives in its own file, an aggregation reads only the columns it references, execution is vectorized in cache-sized batches, and similar values compress extremely well under per-column codecs (10× is routine). MergeTree absorbs append-heavy ingest with background merges instead of materializing every insert on a page immediately.
What has changed is when teams hit this wall. Growing from 10 GB to 100 GB used to take 12–18 months; now it takes one to three. AI-native products log inference and agent runs from day one, and need analytics on them from day one. Security platforms ingest append-only event streams and quickly reach terabytes of data. Product analytics SaaS sells dashboards to customers, and a 30-second dashboard is a dashboard nobody trusts.
One architecture, two engines
The pattern I keep seeing in the field is simple. The application keeps writing to Postgres: transactions, ACID, point lookups, unchanged. Change data capture streams every insert, update, and delete to ClickHouse with seconds-level freshness. And pg_clickhouse, an open-source Postgres extension, lets the application query the ClickHouse copy over its existing Postgres connection, so ClickHouse behaves almost like an analytical read replica.
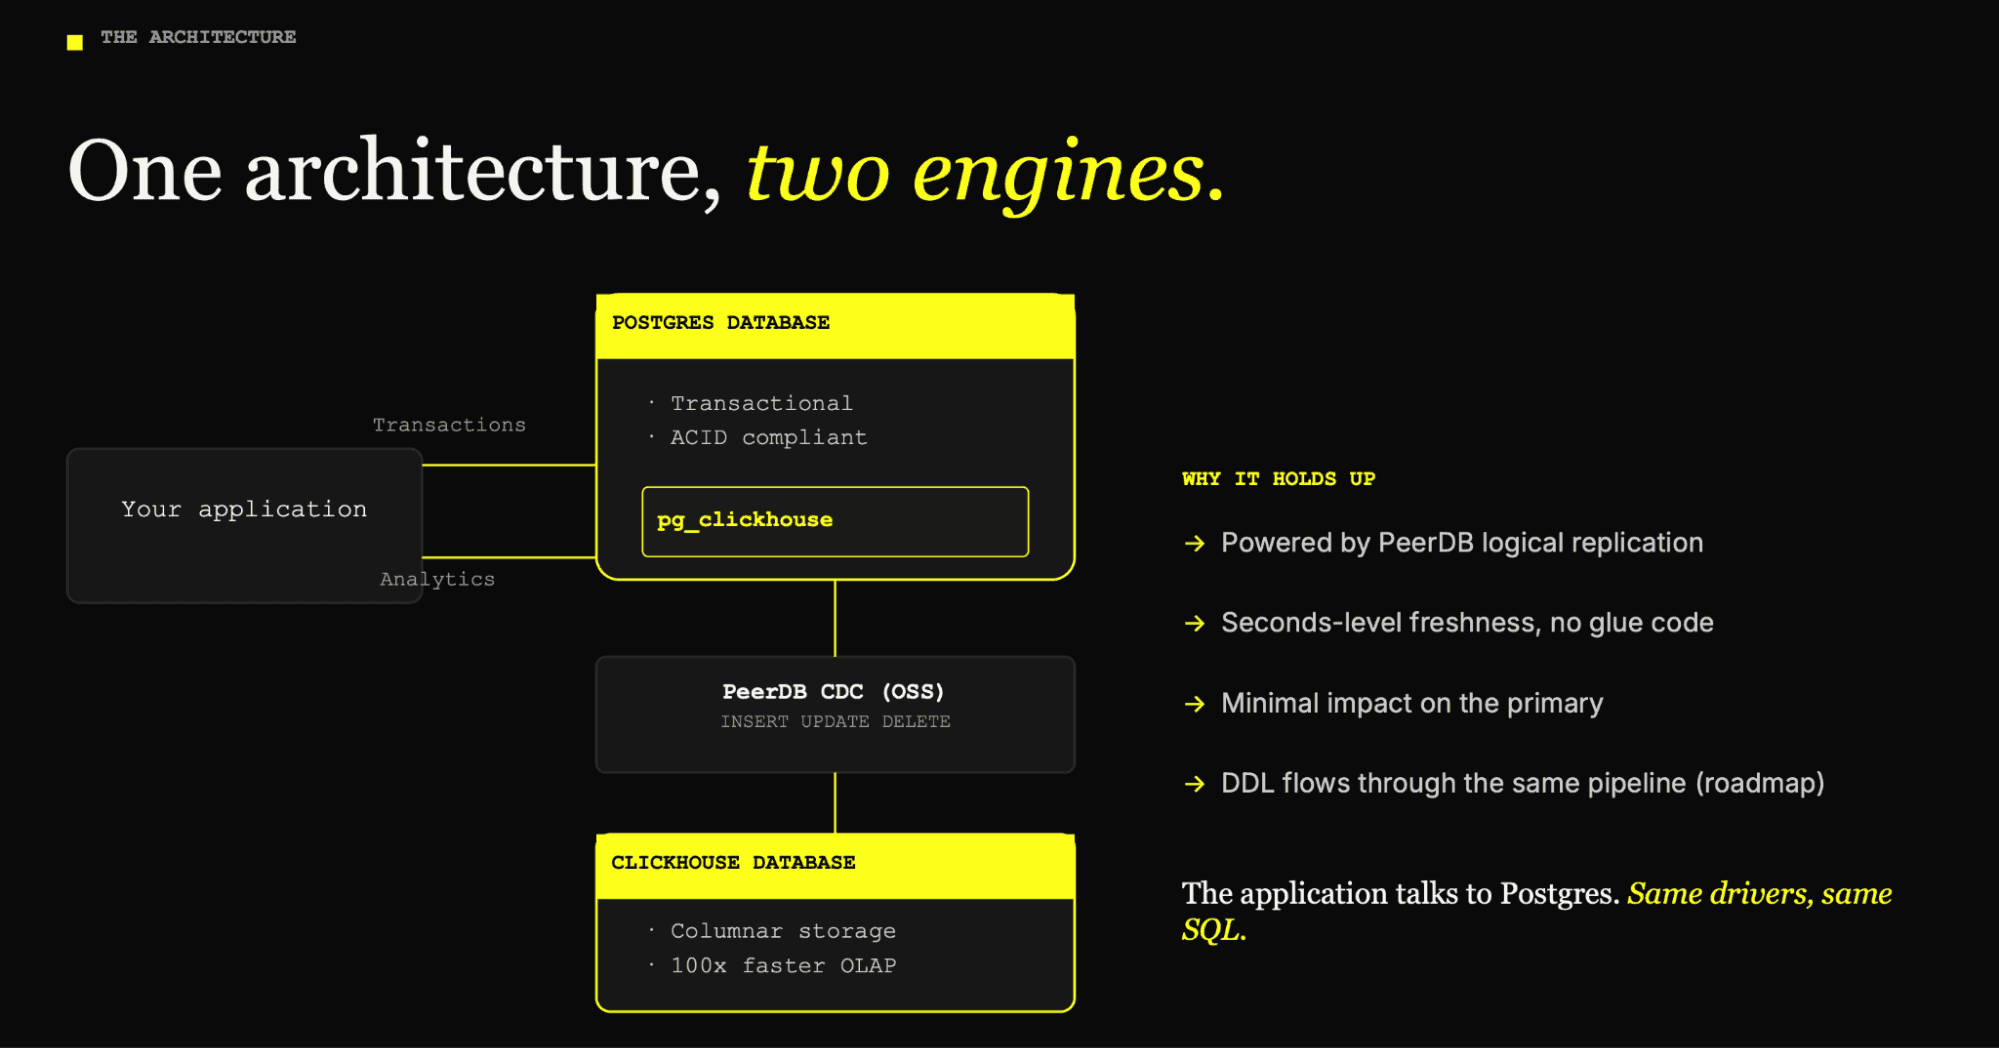
Three pillars hold this up. WAL-based CDC: we use PeerDB (open source; ClickPipes is the managed offering), which replicates on the order of 200 TB a month in production, landing updates and deletes in ReplacingMergeTree with minimal impact on the primary. Query pushdown: the extension has to be deeply query-aware, rewriting Postgres plans into ClickHouse SQL (JOIN syntax differs, for one), and pushdown coverage is the thing to evaluate carefully. Schema sync: DDL flowing through the same pipeline as data, so a column added in Postgres appears in ClickHouse.
New: WalShadow for sub-second Postgres-to-ClickHouse replication
Since this webinar was recorded, we introduced WalShadow, an open-source replication engine now available in Private Preview with ClickHouse Managed Postgres. Unlike logical CDC through PeerDB or ClickPipes, WalShadow reads directly from the physical Postgres WAL and converts changes into ClickHouse-native blocks. This enables sub-second replication without logical replication slots, while keeping inserts, updates, deletes, and supported schema changes in sync.
The practical result is that you stop sizing Postgres for terabytes of analytical history. Keep a small, fast Postgres for the transactional hot path and let the scan-heavy queries hit ClickHouse.
Takeaways
Fast OLTP is a storage problem. Local NVMe changes the constants: microsecond cache misses, cheap fsyncs, predictable VACUUM. With quorum replication and WAL archival you get network-storage-grade resilience without network-storage latency.
Fast OLAP is an architecture problem. No storage device makes a row store good at scanning a billion rows; a columnar layout does. CDC plus a column store changes the shape.
Everything here is open source: Postgres, WAL-G, repmgr, PeerDB, pg_clickhouse and ClickHouse. You can run the whole stack on a laptop. And if you would rather not run it yourself, this is exactly the stack we are building into ClickHouse's managed Postgres with ClickPipes CDC.
Get started with ClickHouse Managed Postgres today
Interested in seeing how ClickHouse Managed Postgres works on your data? Get started with ClickHouse Cloud in minutes and receive $300 in free credits.
Sign up