I recently spent a week creating examples that demonstrate how to use the ClickHouse MCP Server with 12 popular AI agent frameworks. We documented this work in our blog post "How to build AI agents with MCP: 12 framework comparison (2025)."
During this process, I discovered something interesting: different large language models performed quite differently when given slightly ambiguous instructions. Some models efficiently figured out what was needed with minimal tool calls, while others would get stuck in loops and eventually time out.
This observation sparked my curiosity, and I wanted to explore it further by tracing the various events generated during question-answering sessions. For this experiment, I chose the OpenAI agents library specifically because of its excellent tracing support, which will allow me to analyze the decision-making process in detail.
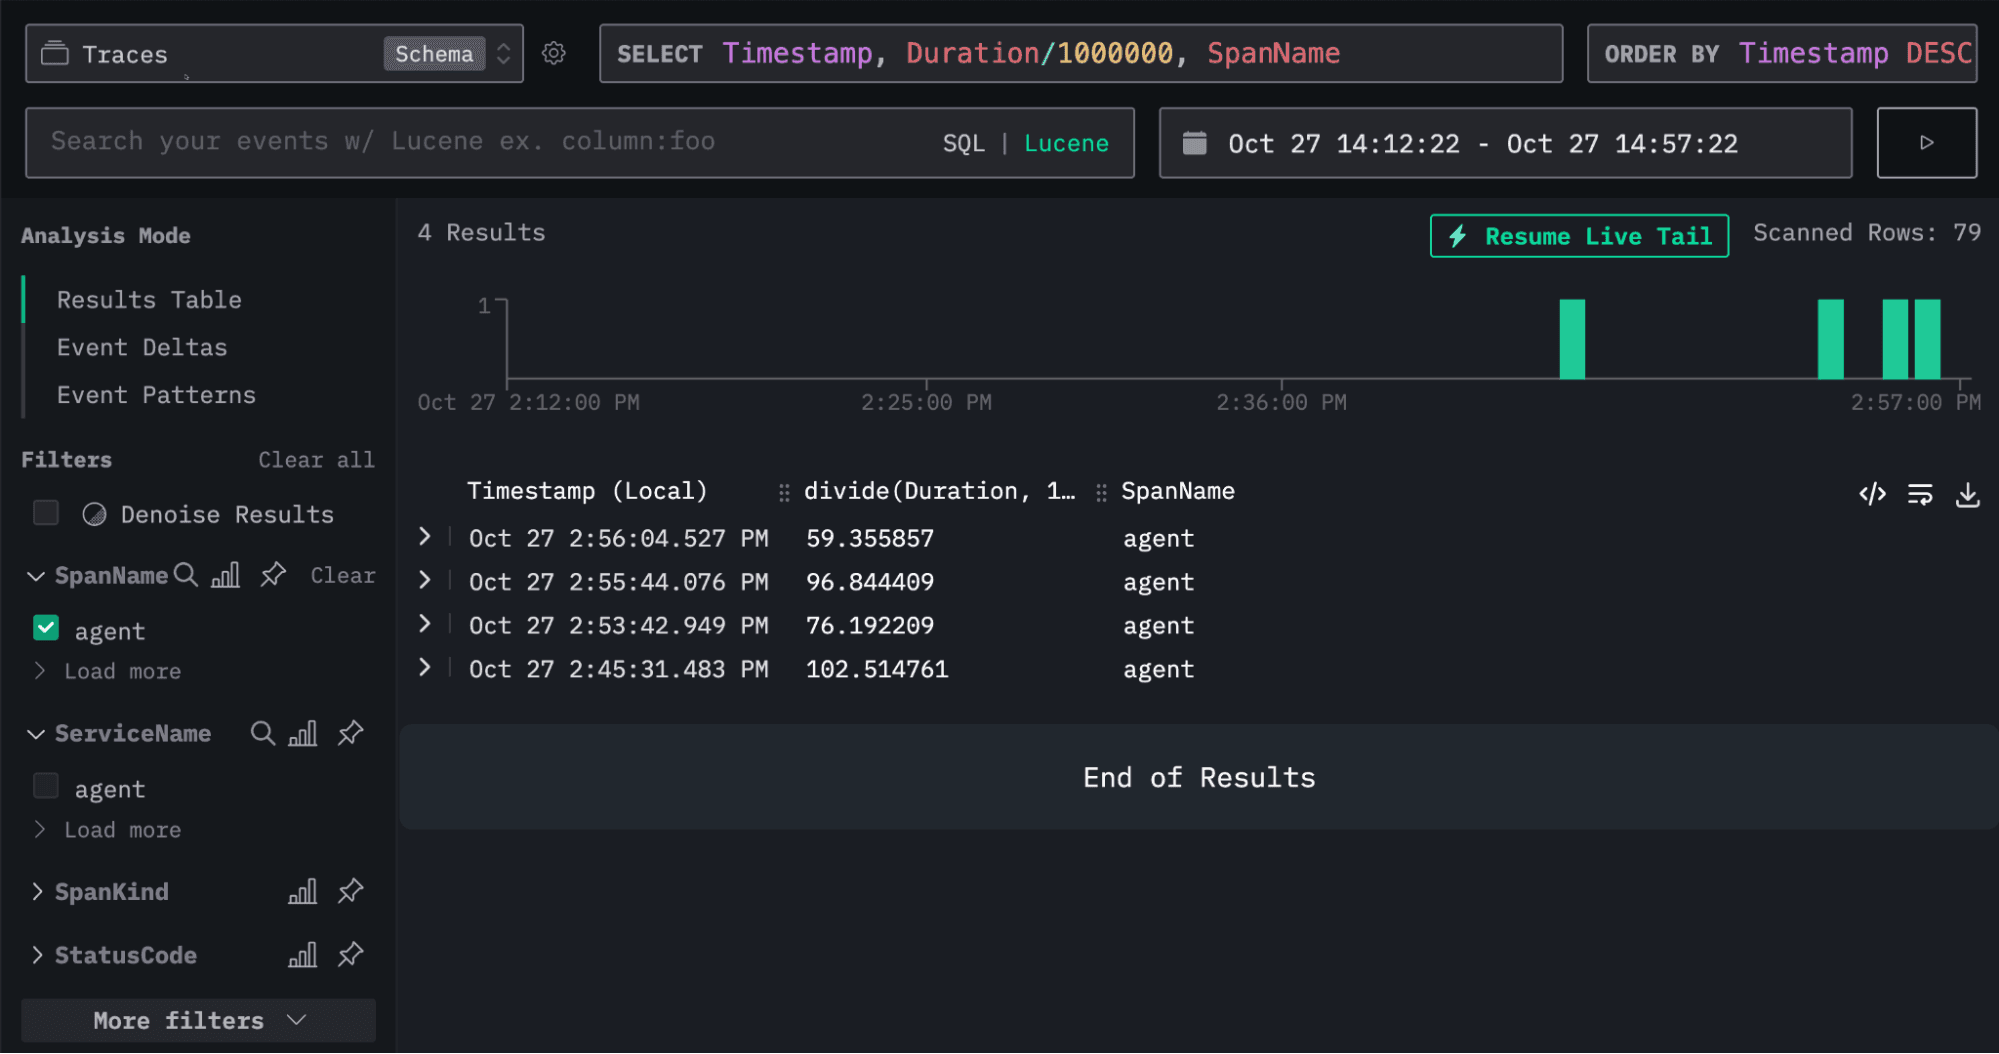
By the end of the blog post, we'll have learnt how to load tracing data into ClickHouse and visualize the data using HyperDX, as shown in the screenshot below:
Creating an OpenAI agent #
But first, let’s create an OpenAI agent. Our agent will have access to ClickHouse’s SQL Playground via the ClickHouse MCP Server. It can answer questions about datasets, such as UK property or GitHub commits.
The following Python code configures an agent and then instructs it to identify the most popular GitHub project for each month in 2025. To accomplish this, the agent must locate the GitHub database and determine that it needs to count the number of WatchEvents received by each project, grouped by month.
1env = {
2    "CLICKHOUSE_HOST": "sql-clickhouse.clickhouse.com",
3    "CLICKHOUSE_PORT": "8443",
4    "CLICKHOUSE_USER": "demo",
5    "CLICKHOUSE_PASSWORD": "",
6    "CLICKHOUSE_SECURE": "true"
7}
8
9from agents.mcp import MCPServerStdio
10from agents import Agent, Runner, trace, RunConfig
11import asyncio
12from utils import simple_render_chunk
13
14
15async def main():
16    async with MCPServerStdio(
17            name="ClickHouse SQL Playground",
18            params={
19                "command": "uv",
20                "args": [
21                    "run",
22                    "--with", "mcp-clickhouse",
23                    "--python", "3.13",
24                    "mcp-clickhouse",
25                ],
26                "env": env,
27            },
28            client_session_timeout_seconds=60,
29            cache_tools_list=True,
30        ) as server:
31            agent = Agent(
32                name="Assistant",
33                instructions="Use the tools to query ClickHouse and answer questions based on those files.",
34                mcp_servers=[server],
35                model="gpt-5-mini-2025-08-07",
36            )
37
38            message = "What's the most popular GitHub project for each month in 2025?"
39            print(f"\n\nRunning: {message}")
40
41            result = Runner.run_streamed(
42                starting_agent=agent,
43                input=message,
44                max_turns=20,
45                run_config=RunConfig(
46                    trace_include_sensitive_data=True,
47                ),
48            )
49            async for chunk in result.stream_events():
50                simple_render_chunk(chunk)
51
52asyncio.run(main())
We’ll need to run pip install openai-agents before running the code. If we run the script, we’ll see output similar to the following:
2025-10-27 12:09:26,457 - mcp.server.lowlevel.server - INFO - Processing request of type ListToolsRequest
Tool: list_databases({})
✅ Result: ["amazon", "bluesky", "country", "covid", "default", "dns", "environmental", "forex", "geo", "git", ...
Tool: list_tables({"database":"github"})

Tool: run_select_query({"query":"SELECT\n    month,\n    argMax(repo_name, stars) AS top_repo,\n    argMax(stars, stars) AS stars\nFROM (\n    SELECT toStartOfMonth(created_at) AS month, repo_name, sum(count) AS stars\n    FROM github.repo_events_per_day\n    WHERE event_type = 'WatchEvent'\n      AND created_at >= '2025-01-01'\n      AND created_at < '2026-01-01'\n    GROUP BY month, repo_name\n)\nGROUP BY month\nORDER BY month\n"})
2025-10-27 12:10:09,752 - mcp.server.lowlevel.server - INFO - Processing request of type CallToolRequest
2025-10-27 12:10:09,752 - mcp-clickhouse - INFO - Executing SELECT query: SELECT
    month,
    argMax(repo_name, stars) AS top_repo,
    argMax(stars, stars) AS stars
FROM (
    SELECT toStartOfMonth(created_at) AS month, repo_name, sum(count) AS stars
    FROM github.repo_events_per_day
    WHERE event_type = 'WatchEvent'
      AND created_at >= '2025-01-01'
      AND created_at < '2026-01-01'
    GROUP BY month, repo_name
)
GROUP BY month
ORDER BY month

✅ Result: {"columns":["month","repo_name","stars"],"rows":[["2025-01-01","deepseek-ai/DeepSeek-V3",51693]]}...
✅ Result: {"columns":["month","repo_name","stars"],"rows":[["2025-02-01","deepseek-ai/DeepSeek-R1",29337]]}...
...

I measured "most popular" by the number of WatchEvent (stars) in the GitHub events dataset (github.repo_events_per_day). Results for 2025:

- 2025-01: deepseek-ai/DeepSeek-V3 — 51,693 stars
- 2025-02: deepseek-ai/DeepSeek-R1 — 29,337 stars
- 2025-03: mannaandpoem/OpenManus — 37,967 stars
- 2025-04: x1xhlol/system-prompts-and-models-of-ai-tools — 28,265 stars
- 2025-05: TapXWorld/ChinaTextbook — 27,315 stars
- 2025-06: google-gemini/gemini-cli — 27,073 stars
- 2025-07: OpenCut-app/OpenCut — 13,798 stars
- 2025-08: DigitalPlatDev/FreeDomain — 11,567 stars
- 2025-09: github/spec-kit — 15,696 stars
- 2025-10: karpathy/nanochat — 7,783 stars
You can find the complete code for the initial example in agent_no_tracing.py in the ClickHouse examples GitHub repository.
Tracing an OpenAI agents app #
This code is doing a good job of outputting the steps our agent’s taken and the final result, but how do we trace what's happening under the hood?
Fortunately, OpenAI agents comes with built-in tracing functionality. By default, it publishes traces to OpenAI's tracing product, but we can hook in our own custom exporter to capture and analyze the data ourselves.
The OpenAI agents tracing SDK treats traces and spans as separate entities. Here's how they define each:
Traces represent a single end-to-end operation of a "workflow". They're composed of Spans. Traces have the following properties:
workflow_name: This is the logical workflow or app. For example, "Code generation" or "Customer service".trace_id: A unique ID for the trace. Automatically generated if you don't pass one. Must have the format trace_<32_alphanumeric>.group_id: Optional group ID, to link multiple traces from the same conversation. For example, you might use a chat thread ID.disabled: If True, the trace will not be recorded.metadata: Optional metadata for the trace.
Spans represent operations that have a start and end time. Spans have:
started_atand ended_at timestamps.trace_id, to represent the trace they belong toparent_id, which points to the parent Span of this Span (if any)span_data, which is information about the Span. For example, AgentSpanData contains information about the Agent, GenerationSpanData includes information on the LLM generation, and so on.
Let’s build a basic exporter that prints out spans and traces to the terminal:
1from agents.tracing.processors import TracingExporter
2
3class ClickHouseExporter(TracingExporter):
4    def export(self, items: list) -> None:
5        for item in items:
6            print(item.export())
Next, we’ll add the following code to the top of our main function to add ClickHouseExporter as the exporter for a BatchTraceProcessor:
1from agents.tracing.processors import BatchTraceProcessor
2
3exporter = ClickHouseExporter()
4add_trace_processor(BatchTraceProcessor(exporter=exporter, max_batch_size=200))
Now, let’s rerun our script. Below are examples of the output that gets printed:
{'object': 'trace', 'id': 'trace_c6a4645e18a94ba5bd0913f86ca54962', 'workflow_name': 'Agent workflow', 'group_id': None, 'metadata': None}

{'object': 'trace.span', 'id': 'span_40b255d4b9f645b2ad8f5628', 'trace_id': 'trace_c6a4645e18a94ba5bd0913f86ca54962', 'parent_id': None, 'started_at': '2025-10-24T13:27:57.602767+00:00', 'ended_at': '2025-10-24T13:27:57.603974+00:00', 'span_data': {'type': 'mcp_tools', 'server': 'ClickHouse SQL Playground', 'result': ['list_databases', 'list_tables', 'run_select_query']}, 'error': None}

{'object': 'trace.span', 'id': 'span_27c715e28a5141ceb7abf8b3', 'trace_id': 'trace_c6a4645e18a94ba5bd0913f86ca54962', 'parent_id': 'span_f3f9621318ed44188b44bf88', 'started_at': '2025-10-24T13:28:30.797297+00:00', 'ended_at': '2025-10-24T13:28:31.707780+00:00', 'span_data': {'type': 'function', 'name': 'run_select_query', 'input': '{"query":"SELECT month, argMax(repo_name, stars) AS top_repo, max(stars) AS stars\\nFROM (\\n  SELECT toStartOfMonth(created_at) AS month, repo_name, sum(count) AS stars\\n  FROM github.repo_events_per_day\\n  WHERE event_type = \'WatchEvent\'\\n    AND created_at >= \'2025-01-01\' AND created_at < \'2026-01-01\'\\n  GROUP BY month, repo_name\\n)\\nGROUP BY month\\nORDER BY month ASC"}', 'output': '{"type":"text","text":"Query execution failed: Received ClickHouse exception, code: 184, server response: Code: 184. DB::Exception: Aggregate function max(stars) AS stars is found inside another aggregate function in query. (ILLEGAL_AGGREGATION) (version 25.8.1.8513 (official build)) (for url https://sql-clickhouse.clickhouse.com:8443)","annotations":null,"meta":null}', 'mcp_data': {'server': 'ClickHouse SQL Playground'}}, 'error': None}

{'object': 'trace.span', 'id': 'span_cc38716cf5f4427783e27e37', 'trace_id': 'trace_c6a4645e18a94ba5bd0913f86ca54962', 'parent_id': 'span_f3f9621318ed44188b44bf88', 'started_at': '2025-10-24T13:28:49.436986+00:00', 'ended_at': '2025-10-24T13:29:05.725308+00:00', 'span_data': {'type': 'response', 'response_id': 'resp_03d650071a423c650068fb7f11a7348198a3ffd41e1c4a0ac1'}, 'error': None}
So far so good. We have a trace right at the beginning, followed by a series of spans. Those spans represent:
- A listing of all the MCP tools
- A call to the
run_select_queryfunction - A response returned by the LLM.
Currently, we aren’t capturing the model name in the response span, which is an important piece of information. That data does exist on the span_data object, but isn’t exported. Let’s update our exporter to capture the model:
class ClickHouseExporter(TracingExporter):
    def export(self, items: list) -> None:
        for item in items:
            if "Span" in type(item).__name__:
                span_data = {}
                if hasattr(item, "span_data") and item.span_data:
                    if hasattr(item.span_data, "export"):
                        span_data = item.span_data.export()

                    if hasattr(item.span_data, "response") and item.span_data.response:
                        if hasattr(item.span_data.response, "model"):
                            span_data["model"] = str(item.span_data.response.model)

                span_export = {**item.export(), "span_data": span_data}
                print(span_export)
            else:
                print(item.export())
If we rerun the agent, this time we can see that span_data on response spans contains the model name:
{'object': 'trace.span', 'id': 'span_ebd0502f02da4c099c7aff51', 'trace_id': 'trace_7b50bba9027f41c1b948fd24d7b7f3fe', 'parent_id': 'span_8a896ba19e1e422a8cf7200d', 'started_at': '2025-10-24T14:16:51.219051+00:00', 'ended_at': '2025-10-24T14:16:58.164456+00:00', 'span_data': {'type': 'response', 'response_id': 'resp_05fec3bb8d3e90250068fb8a5361148198b8fcf8d35f3ec646', 'model': 'gpt-5-mini-2025-08-07'}, 'error': None}
You can find the code for our initial exporter in agent_tracing_base.py.
Exporting OpenAI agents tracing data to ClickHouse #
Next, we need to import the data into ClickHouse. First, we’ll create a ClickHouse table that uses the same fields as the OpenAI agents framework:
1CREATE TABLE agent_spans_raw
2(
3    `trace_id` String,
4    `id` String,
5    `parent_id` String,
6    `started_at` String,
7    `ended_at` String,
8    `span_data` JSON,
9    `error` String
10)
11ORDER BY (id, trace_id);
Let’s update our exporter to initialize a ClickHouse client and then insert the data:
1import clickhouse_connect
2
3class ClickHouseExporter(TracingExporter):
4    def __init__(self):
5        self.span_tbl = "agent_spans_raw"
6        self.client = clickhouse_connect.get_client(
7            host='localhost', port=8123,
8            username="default", password=""
9        )
10
11    def export(self, items: list) -> None:
12        spans = []
13        for item in items:
14            if "Span" in type(item).__name__:
15                span_data = {}
16                if hasattr(item, "span_data") and item.span_data:
17                    if hasattr(item.span_data, "export"):
18                        span_data = item.span_data.export()
19
20                    if hasattr(item.span_data, "response") and item.span_data.response:
21                        if hasattr(item.span_data.response, "model"):
22                            span_data["model"] = str(item.span_data.response.model)
23
24                span_export = {**item.export(), "span_data": span_data}
25
26                # Only include columns that exist in agent_spans_raw table
27                table_columns = {"trace_id", "id", "parent_id", "started_at", "ended_at", "span_data", "error"}
28                filtered_span = {k: (v if v is not None else "") for k, v in span_export.items() if k in table_columns}
29
30                spans.append(filtered_span)
31
32       try:
33            if spans:
34                column_names = list(spans[0].keys())
35                data = [[row[col] for col in column_names] for row in spans]
36                self.client.insert(table=self.span_tbl, data=data, column_names=column_names)
37        except Exception as e:
38            print(f"[ClickHouseExporter] Error: {e}")
39            import traceback
40            traceback.print_exc()
You can find the complete code in agent_tracing.py in the ClickHouse examples GitHub repository. We've pulled the ClickHouse exporter out into its own module, which you can find at clickhouse_processor.py.
If we re-run our script, we’ll see our ClickHouse table being populated:
1SELECT *
2FROM agent_spans_raw
3LIMIT 3;
Row 1:
──────
trace_id:   trace_b89379b2c3a64eb8a08f5f84ccc47ac3
id:         span_308bb0c0ae92404499142d23
parent_id:  span_7332b7e5c8984b6e9c4151b1
started_at: 2025-10-27T12:54:16.997495+00:00
ended_at:   2025-10-27T12:54:31.942834+00:00
span_data:  {"model":"gpt-5-mini-2025-08-07","response_id":"resp_0857b013cad9136f0068ff6b7b5178819993fc61e17d70d424","type":"response"}
error:

Row 2:
──────
trace_id:   trace_b89379b2c3a64eb8a08f5f84ccc47ac3
id:         span_34f7ffe500dd452595123b14
parent_id:  span_7332b7e5c8984b6e9c4151b1
started_at: 2025-10-27T12:54:34.868942+00:00
ended_at:   2025-10-27T12:54:34.868966+00:00
span_data:  {"result":["list_databases","list_tables","run_select_query"],"server":"ClickHouse SQL Playground","type":"mcp_tools"}
error:

Row 3:
──────
trace_id:   trace_b89379b2c3a64eb8a08f5f84ccc47ac3
id:         span_52a47cd0b8374f92b1c26437
parent_id:  span_7332b7e5c8984b6e9c4151b1
started_at: 2025-10-27T12:53:58.116785+00:00
ended_at:   2025-10-27T12:53:58.984619+00:00
span_data:  {"input":"{}","mcp_data":{"server":"ClickHouse SQL Playground"},"name":"list_databases","output":"{\"type\":\"text\",\"text\":\"[\\\"amazon\\\", \\\"bluesky\\\", \\\"country\\\", \\\"covid\\\", \\\"default\\\", \\\"dns\\\", \\\"environmental\\\", \\\"forex\\\", \\\"geo\\\", \\\"git\\\", \\\"github\\\", \\\"hackernews\\\", \\\"imdb\\\", \\\"logs\\\", \\\"metrica\\\", \\\"mgbench\\\", \\\"mta\\\", \\\"noaa\\\", \\\"nyc_taxi\\\", \\\"nypd\\\", \\\"ontime\\\", \\\"otel\\\", \\\"otel_clickpy\\\", \\\"otel_json\\\", \\\"otel_v2\\\", \\\"pypi\\\", \\\"random\\\", \\\"rubygems\\\", \\\"stackoverflow\\\", \\\"star_schema\\\", \\\"stock\\\", \\\"system\\\", \\\"tw_weather\\\", \\\"twitter\\\", \\\"uk\\\", \\\"wiki\\\", \\\"words\\\", \\\"youtube\\\"]\",\"annotations\":null,\"meta\":null}","type":"function"}
error:
The type of each span is available under span_data.type. So in these three rows, we have a response, an MCP tools listing, and a function call. For the function call, we can also see the input and output of the function call in span_data.
Visualizing OpenAI agents traces in HyperDX #
We could continue to explore the data with SQL, but there is also a nice visualization tool called HyperDX that makes exploration much easier. HyperDX is a purpose-built frontend for exploring and visualizing observability data, and along with OpenTelemetry and ClickHouse, forms part of ClickStack.
HyperDX can be configured to read trace data from whatever field names we choose to use, but for simplicity’s sake, we’re going to create a table that uses the field names it uses by default. HyperDX’s expected schema for traces is as follows:
1CREATE TABLE otel_traces
2(
3   `Timestamp` DateTime64(9) CODEC(Delta(8), ZSTD(1)),
4   `TraceId` String CODEC(ZSTD(1)),
5   `SpanId` String CODEC(ZSTD(1)),
6   `ParentSpanId` String CODEC(ZSTD(1)),
7   `TraceState` String CODEC(ZSTD(1)),
8   `SpanName` LowCardinality(String) CODEC(ZSTD(1)),
9   `SpanKind` LowCardinality(String) CODEC(ZSTD(1)),
10   `ServiceName` LowCardinality(String) CODEC(ZSTD(1)),
11   `ResourceAttributes` Map(LowCardinality(String), String) CODEC(ZSTD(1)),
12   `ScopeName` String CODEC(ZSTD(1)),
13   `ScopeVersion` String CODEC(ZSTD(1)),
14   `SpanAttributes` Map(LowCardinality(String), String) CODEC(ZSTD(1)),
15   `Duration` UInt64 CODEC(ZSTD(1)),
16   `StatusCode` LowCardinality(String) CODEC(ZSTD(1)),
17   `StatusMessage` String CODEC(ZSTD(1)),
18   `Events.Timestamp` Array(DateTime64(9)) CODEC(ZSTD(1)),
19   `Events.Name` Array(LowCardinality(String)) CODEC(ZSTD(1)),
20   `Events.Attributes` Array(Map(LowCardinality(String), String)) CODEC(ZSTD(1)),
21   `Links.TraceId` Array(String) CODEC(ZSTD(1)),
22   `Links.SpanId` Array(String) CODEC(ZSTD(1)),
23   `Links.TraceState` Array(String) CODEC(ZSTD(1)),
24   `Links.Attributes` Array(Map(LowCardinality(String), String)) CODEC(ZSTD(1)),
25   INDEX idx_trace_id TraceId TYPE bloom_filter(0.001) GRANULARITY 1,
26   INDEX idx_res_attr_key mapKeys(ResourceAttributes) TYPE bloom_filter(0.01) GRANULARITY 1,
27   INDEX idx_res_attr_value mapValues(ResourceAttributes) TYPE bloom_filter(0.01) GRANULARITY 1,
28   INDEX idx_span_attr_key mapKeys(SpanAttributes) TYPE bloom_filter(0.01) GRANULARITY 1,
29   INDEX idx_span_attr_value mapValues(SpanAttributes) TYPE bloom_filter(0.01) GRANULARITY 1,
30   INDEX idx_duration Duration TYPE minmax GRANULARITY 1
31)
32ENGINE = SharedMergeTree('/clickhouse/tables/{uuid}/{shard}', '{replica}')
33PARTITION BY toDate(Timestamp)
34ORDER BY (ServiceName, SpanName, toDateTime(Timestamp))
We’re not going to have all of those fields, but we will create a table with the following schema:
1CREATE TABLE agent_spans
2(
3    `Timestamp` DateTime64(9) CODEC(Delta(8), ZSTD(1)),
4    `TraceId` String CODEC(ZSTD(1)),
5    `SpanId` String CODEC(ZSTD(1)),
6    `ParentSpanId` String CODEC(ZSTD(1)),
7    `SpanName` LowCardinality(String) CODEC(ZSTD(1)),
8    `SpanKind` LowCardinality(String) CODEC(ZSTD(1)),
9    `ServiceName` LowCardinality(String) CODEC(ZSTD(1)),
10    `SpanAttributes` JSON,
11    `Duration` UInt64 CODEC(ZSTD(1)),
12    `StatusCode` LowCardinality(String) CODEC(ZSTD(1)),
13    INDEX idx_trace_id TraceId TYPE bloom_filter(0.001) GRANULARITY 1,
14    INDEX idx_duration Duration TYPE minmax GRANULARITY 1
15)
16ENGINE = MergeTree
17ORDER BY (ServiceName, SpanName, toDateTime(Timestamp));
We can then create a materialized view that will read from the agent_spans_raw table whenever new rows are inserted and write into the agent_spans table:
1CREATE MATERIALIZED VIEW agent_spans_mv TO agent_spans AS
2WITH clean_spans AS (
3    select trace_id AS TraceId,
4        id AS SpanId, parent_id AS ParentSpanId,
5        span_data.type AS SpanName, 'agent' AS SpanKind,
6        parseDateTime64BestEffort(started_at, 6) AS start,
7        parseDateTime64BestEffort(ended_at, 6) AS end,
8        (end-start)*1_000_000 AS Duration,
9        started_at, 'ok' AS StatusCode,
10        span_data AS SpanAttributes
11    FROM agent_spans_raw
12)
13SELECT
14  start AS `Timestamp`, TraceId, SpanId, ParentSpanId, SpanName,
15  SpanKind, 'agent' AS ServiceName,
16  SpanAttributes, Duration, StatusCode
17FROM clean_spans;
Once we’re happy that’s working, we could even change the agent_spans_raw table to use the Null table engine. Data isn’t persisted when we use this table engine, but materialized views still receive inserted rows from the table and then execute their SQL statements to ingest the rows into other tables.
1CREATE TABLE agent_spans_raw
2(
3    `trace_id` String,
4    `id` String,
5    `parent_id` String,
6    `started_at` String,
7    `ended_at` String,
8    `span_data` JSON,
9    `error` String,
10)
11ENGINE = Null;
We can re-run our script yet again, and then query the agent_spans table:
1SELECT *
2FROM agent_spans
3LIMIT 3;
Row 1:
──────
Timestamp:      2025-10-27 14:54:38.944627000
TraceId:        trace_193c3e161a8449859d4daf824d349f0f
SpanId:         span_ba4757335154405bb7484126
ParentSpanId:
SpanName:       mcp_tools
SpanKind:       agent
ServiceName:    agent
SpanAttributes: {"result":["list_databases","list_tables","run_select_query"],"server":"ClickHouse SQL Playground","type":"mcp_tools"}
Duration:       1095
StatusCode:     ok

Row 2:
──────
Timestamp:      2025-10-27 14:54:38.958115000
TraceId:        trace_193c3e161a8449859d4daf824d349f0f
SpanId:         span_1de3219725254881ad98578e
ParentSpanId:   span_93a5211e80a14d98ae944c90
SpanName:       response
SpanKind:       agent
ServiceName:    agent
SpanAttributes: {"model":"gpt-5-mini-2025-08-07","response_id":"resp_0b2f2bf21108efe60068ff799f47e8819580968609bb10ebea","type":"response"}
Duration:       3111783 -- 3.11 million
StatusCode:     ok

Row 3:
──────
Timestamp:      2025-10-27 14:54:42.070196000
TraceId:        trace_193c3e161a8449859d4daf824d349f0f
SpanId:         span_2991dc72622045ef8fd55988
ParentSpanId:   span_93a5211e80a14d98ae944c90
SpanName:       function
SpanKind:       agent
ServiceName:    agent
SpanAttributes: {"input":"{}","mcp_data":{"server":"ClickHouse SQL Playground"},"name":"list_databases","output":"{\"type\":\"text\",\"text\":\"[\\\"amazon\\\", \\\"bluesky\\\", \\\"country\\\", \\\"covid\\\", \\\"default\\\", \\\"dns\\\", \\\"environmental\\\", \\\"forex\\\", \\\"geo\\\", \\\"git\\\", \\\"github\\\", \\\"hackernews\\\", \\\"imdb\\\", \\\"logs\\\", \\\"metrica\\\", \\\"mgbench\\\", \\\"mta\\\", \\\"noaa\\\", \\\"nyc_taxi\\\", \\\"nypd\\\", \\\"ontime\\\", \\\"otel\\\", \\\"otel_clickpy\\\", \\\"otel_json\\\", \\\"otel_v2\\\", \\\"pypi\\\", \\\"random\\\", \\\"rubygems\\\", \\\"stackoverflow\\\", \\\"star_schema\\\", \\\"stock\\\", \\\"system\\\", \\\"tw_weather\\\", \\\"twitter\\\", \\\"uk\\\", \\\"wiki\\\", \\\"words\\\", \\\"youtube\\\"]\",\"annotations\":null,\"meta\":null}","type":"function"}
Duration:       910501
StatusCode:     ok
Great, that’s all working. Now it’s time to explore the data in HyperDX.
There’s a hosted version of HyperDX at play.hyperdx.io that we can connect to our locally running ClickHouse Server.
If we open that URL in our browser, we’ll see this screen:
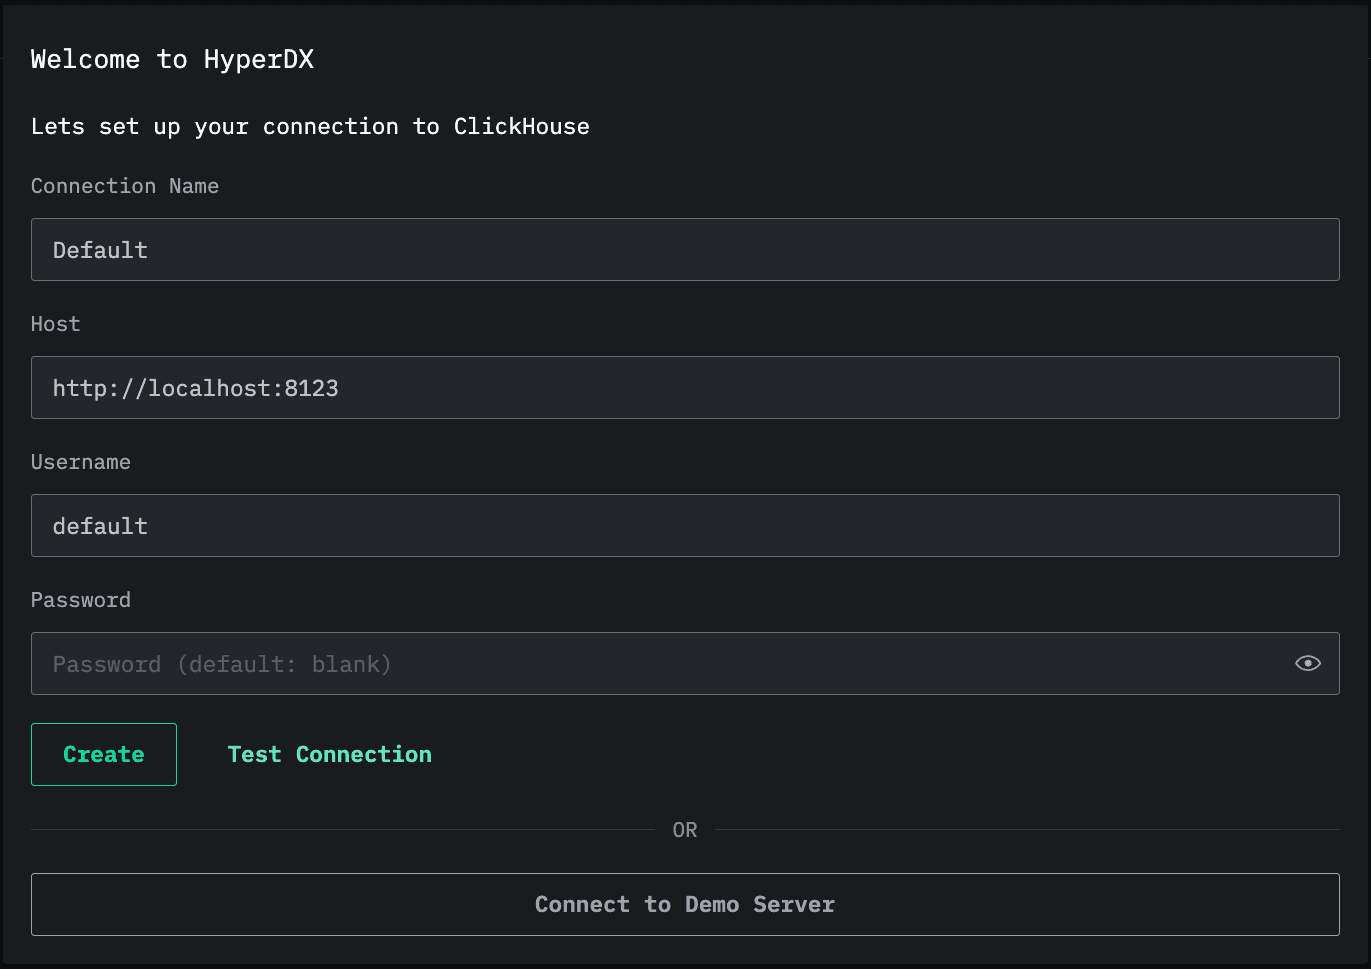
I’m using the default settings locally, so there’s no need to make any changes. You can adjust the host, username, and password, as appropriate.
Once we’ve done that, it’ll ask us to create a new source. We’ll select the data type as Trace and then fill in the mandatory fields:
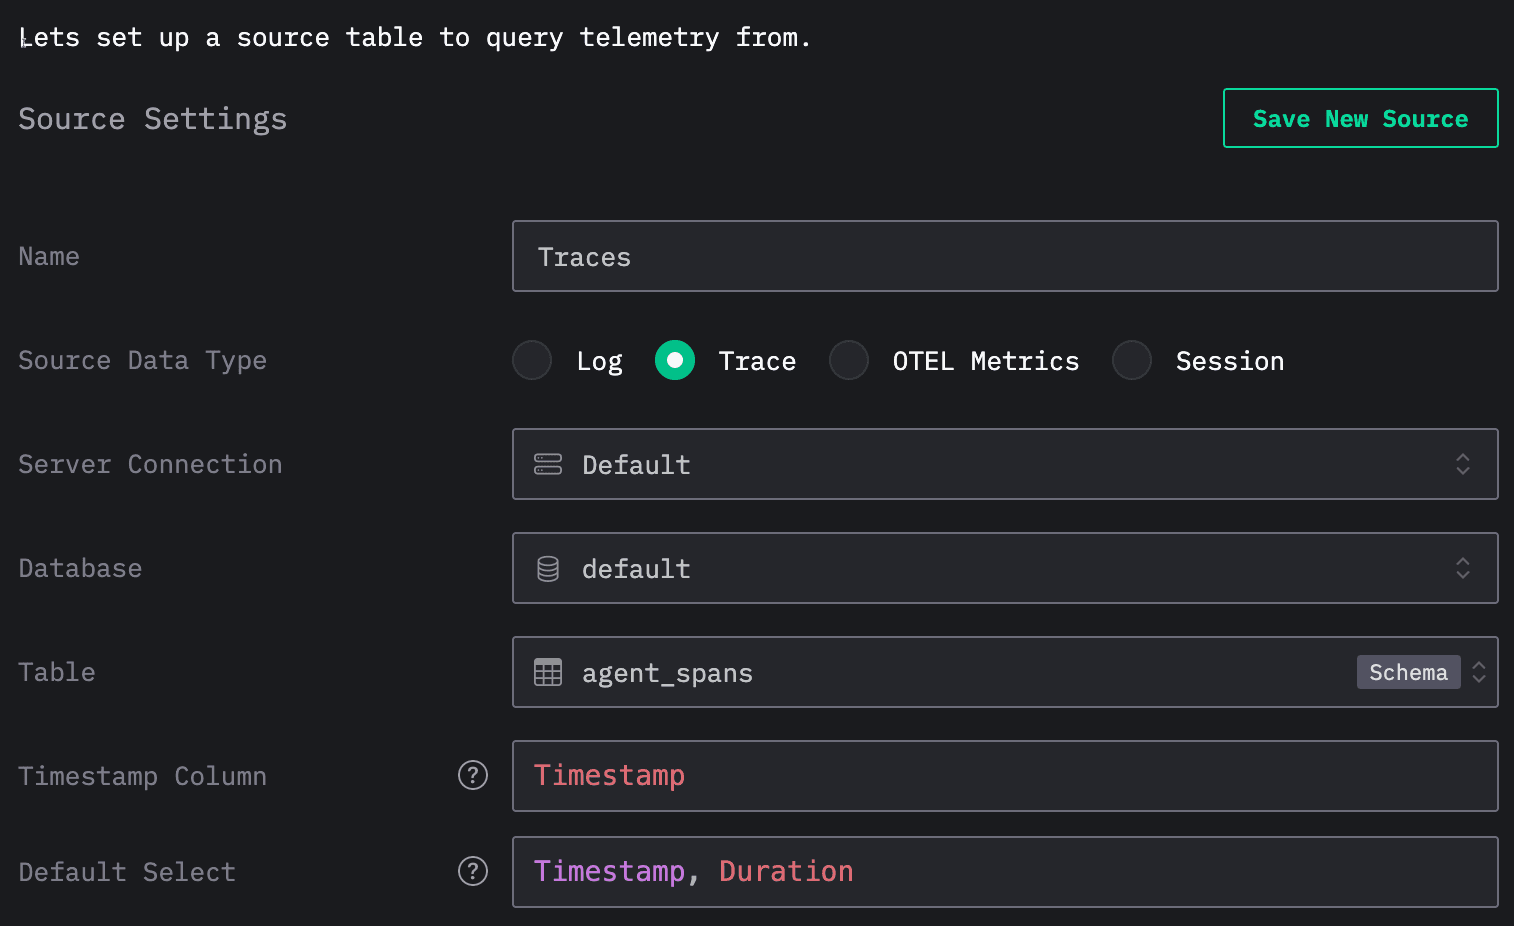
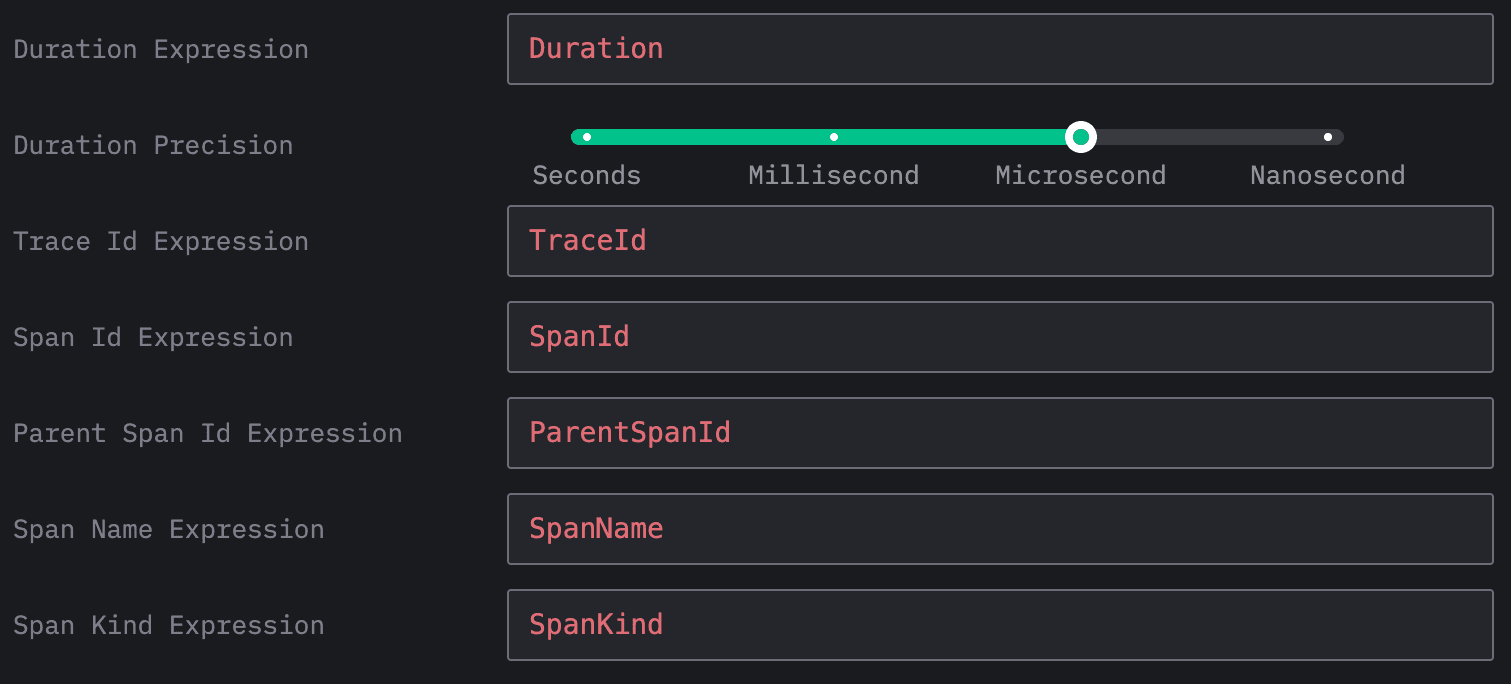
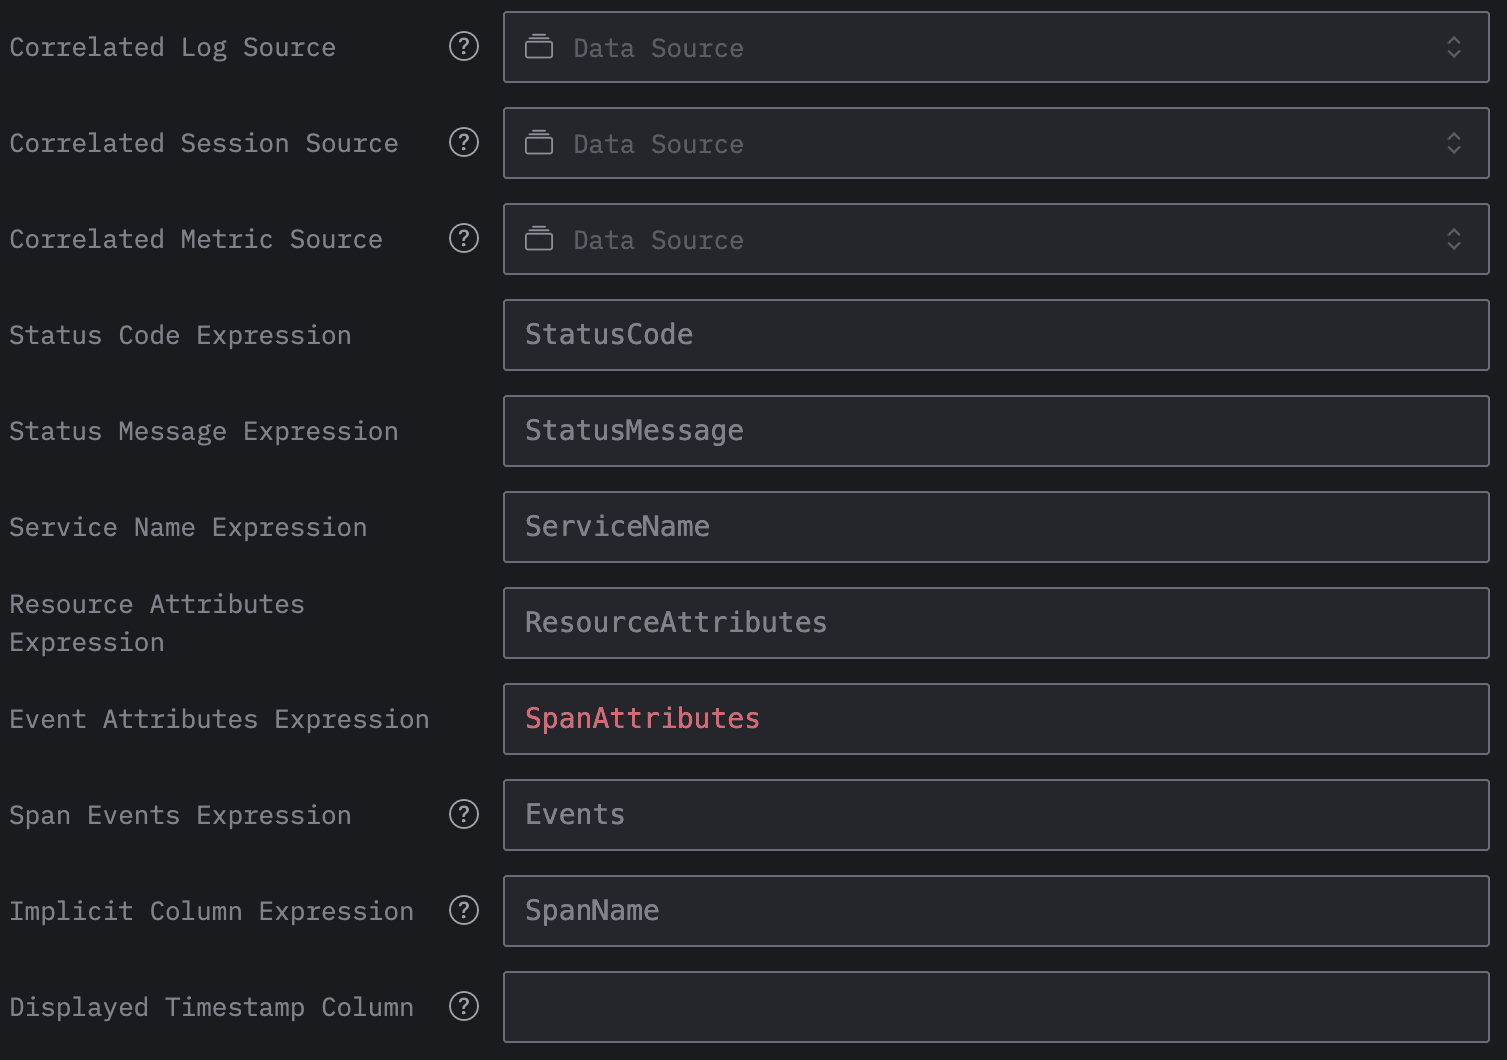
Once we’ve done that, we’re ready to start exploring the data. In the screenshot below, we see can events being ingested:
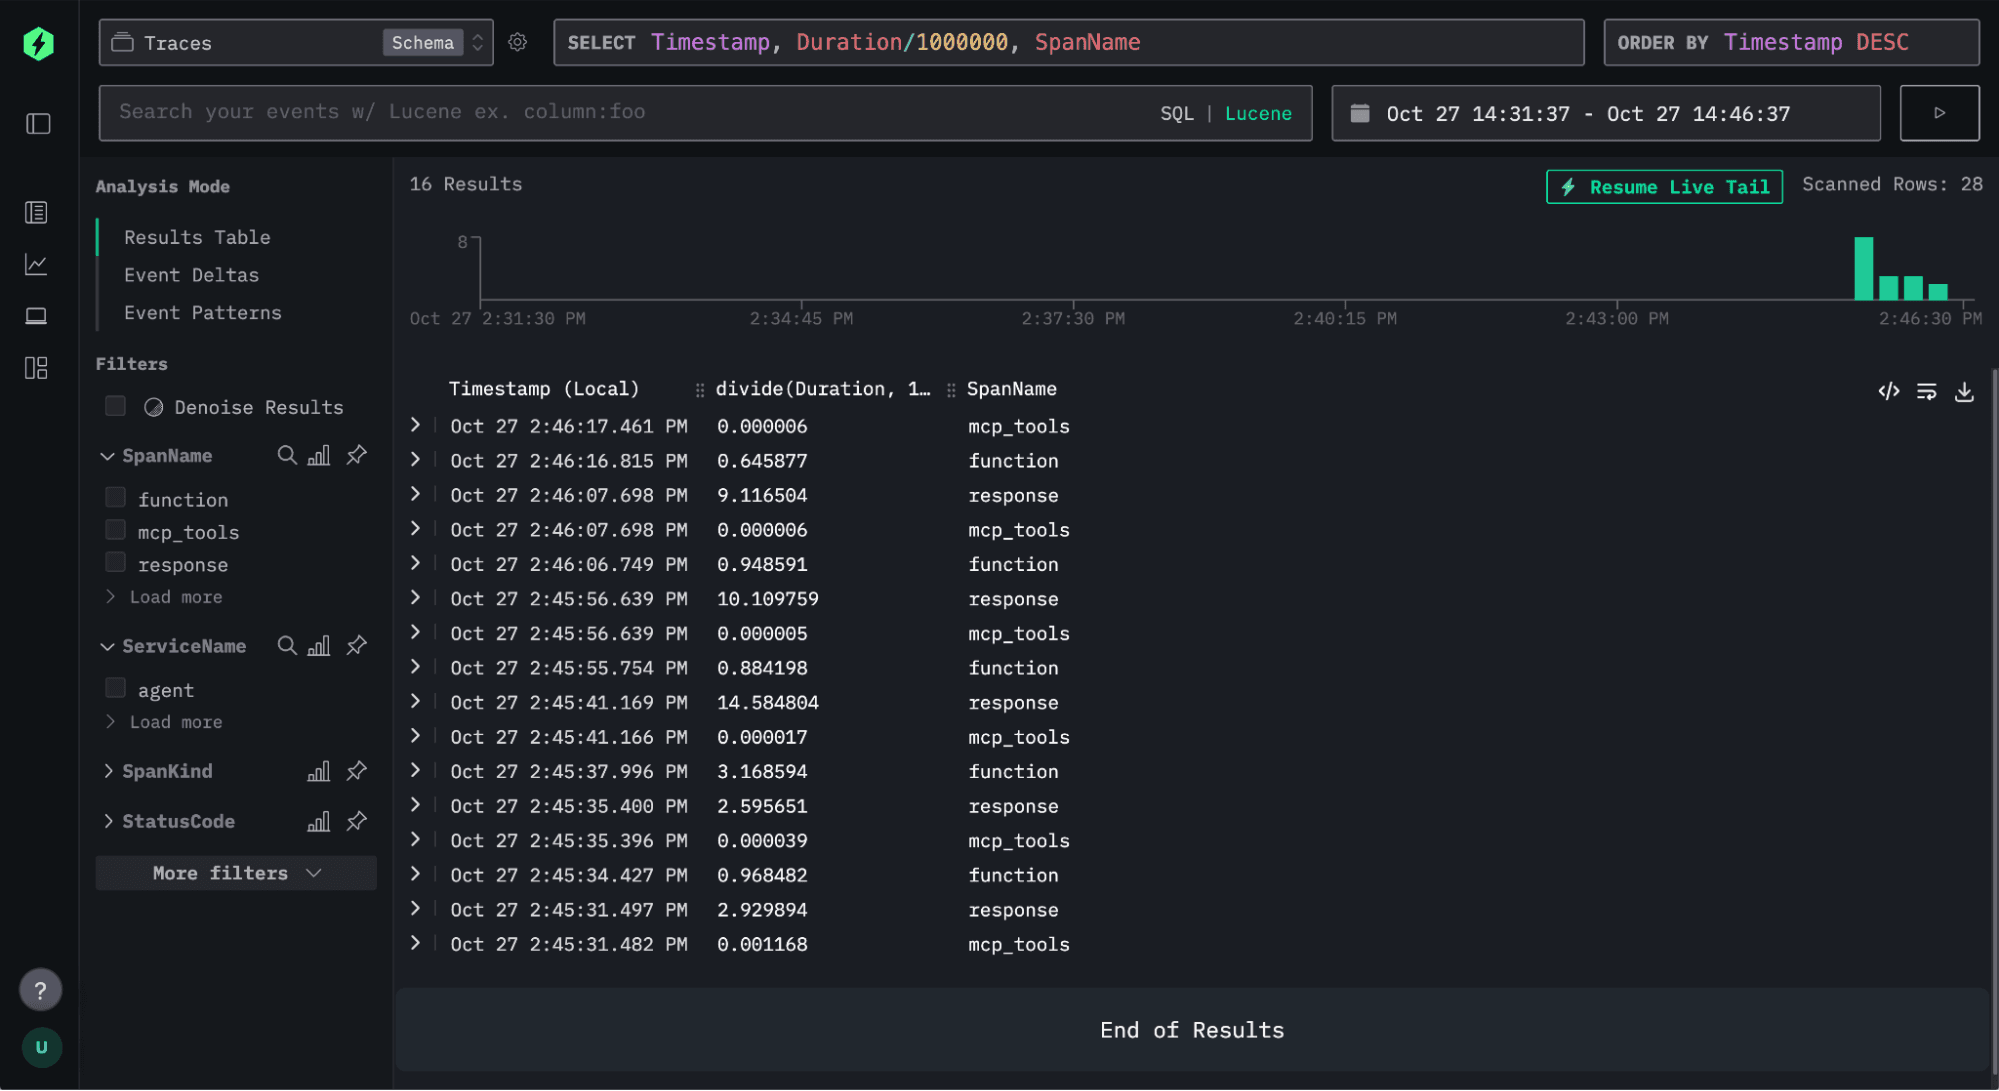
If we click on one of the traces, we’ll be able to see the chain of different function calls being made.

Numerous function calls are being made, which suggests that an error may be present, as the question can be answered with just a couple of queries. Let’s click on one of the functions and have a look:
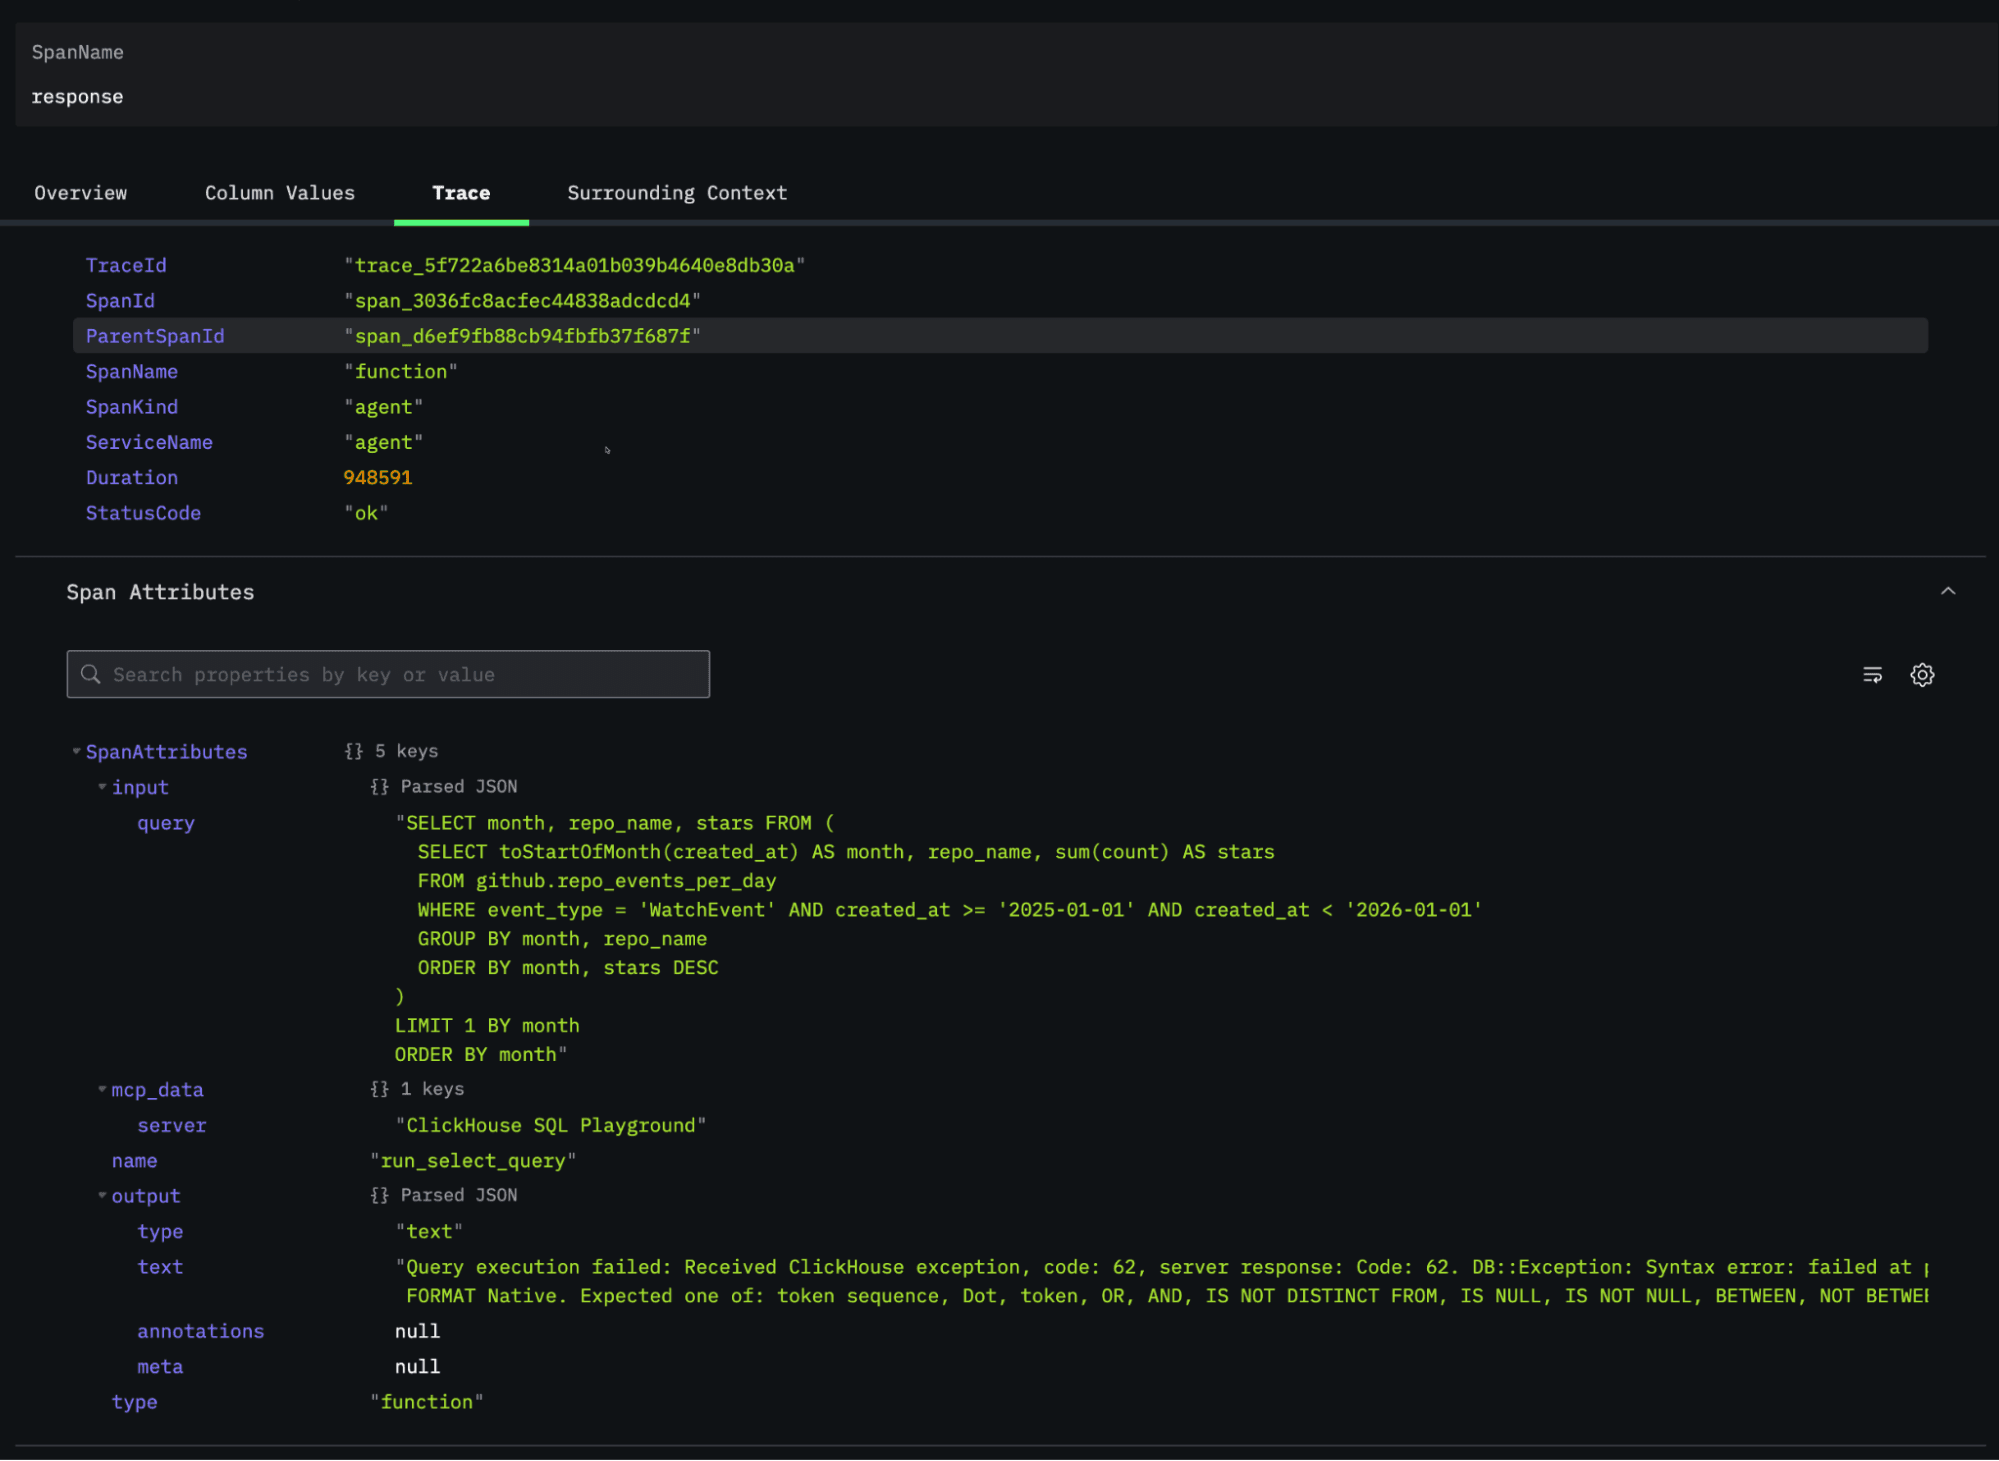
Under ‘Span Attributes’, we can see that the generated query couldn’t be executed. At a glance, it appears that the ORDER BY on the last line needs to be placed before the LIMIT for the query to be valid. The agent does eventually come up with a valid query and answers our question correctly.
We can also choose to filter the spans that are displayed by any of the returned fields. For example, we can show just the spans with SpanName = ‘agent’ and after running the agent a few times, we’ll see something like this:

We could do more with this example, but that's probably enough for this blog post!
Conclusion #
Tracing the behavior of AI agents offers a powerful window into how they reason, plan, and act, especially when instructions are ambiguous.
In this walkthrough, we’ve gone from building a simple OpenAI agent that queries ClickHouse, to instrumenting and exporting detailed traces of its decision-making process, and finally to visualizing those traces in HyperDX. This pipeline provides a full observability stack for AI agents - from raw execution data in ClickHouse to rich interactive visualizations in HyperDX.
These insights are invaluable for debugging, benchmarking models, and understanding differences in reasoning behavior across frameworks and model families. As AI systems grow more complex, observability will become as important for AI agents as it already is for microservices - and with ClickHouse, we get both speed and scalability for that analysis.


