LY Corporation uses ClickHouse to observe one of the world’s largest Kafka deployments, processing over 1 trillion messages and 2.6 PB of I/O per day. ClickHouse ingests 7 million rows per second of API logs, enabling millisecond-level debugging at a scale most traditional observability tools can’t touch. With just 24 servers, LY analyzes more than 4.1 trillion rows in real time, helping engineers identify upstream Kafka bugs and improve performance.
Summary
To understand LY Corporation, you have to think big. Not just “large tech company” big, but “nationwide digital infrastructure” big. Born from the merger of LINE and Yahoo! Japan, LY runs Japan’s most popular messaging app, one of the country’s biggest news portals, a massive payments ecosystem, and countless backend services moving data between them.
Few systems capture that scale better than LY’s company-wide Apache Kafka platform. It’s their central nervous system—the message bus carrying everything from app logs to microservice events to in-game telemetry. At peak, the platform processes 31 million messages per second. That adds up to more than 1 trillion messages and 2.6 petabytes of I/O every day.
“This is an extremely large-scale Kafka cluster,” says Haruki Okada, Senior Software Engineer and tech lead on LY’s Kafka platform team. “The scale is massive—it’s probably one of the largest deployments in the world.”
As Haruki explained at our June 2025 observability happy hour in Tokyo, running Kafka at that scale means encountering issues no one has ever seen before. Solving them requires a level of observability most companies never come close to—and a database fast, cost-efficient, and developer-friendly enough to keep up.
A Kafka deployment like no other #
In Haruki’s words, Kafka is “one of our most popular middleware solutions.” He’s not kidding. LY uses it for just about everything: classic pub/sub communication between services, logging pipelines, async processing, streaming in-game data, and CDC flows that keep databases in sync across internal systems. If a service emits data, odds are it touches Kafka.
But the real challenge isn’t merely the variety of use cases. It’s the volume. LY’s Kafka platform operates across more than 200 brokers, serving over 25,000 client servers. When you hit that level of load, even tiny inefficiencies can snowball into production outages.
And because Kafka (originally developed at LinkedIn and open-sourced in 2011) was never built with trillion-message-per-day workloads in mind, LY often finds itself in uncharted territory. As Haruki puts it, “When operating at this scale, we run into issues that no one else in the world has encountered yet.” Along the way, they’ve traced and contributed upstream fixes for everything from a race condition in log deletion, to a subtle performance issue caused by an unexpected fsync call, to a Linux kernel problem that tanked performance during sudden connection spikes.
“Since issues like these can pop up on a daily basis, observability has become extremely important,” Haruki says. “We analyze the root structure of each problem, and to get to the root cause, we need maximum observability across every part of the system stack.”
LY’s multi-layer observability stack #
To stay ahead of problems at this scale, the LY team built an observability stack that looks more like a full research laboratory than a typical monitoring setup.

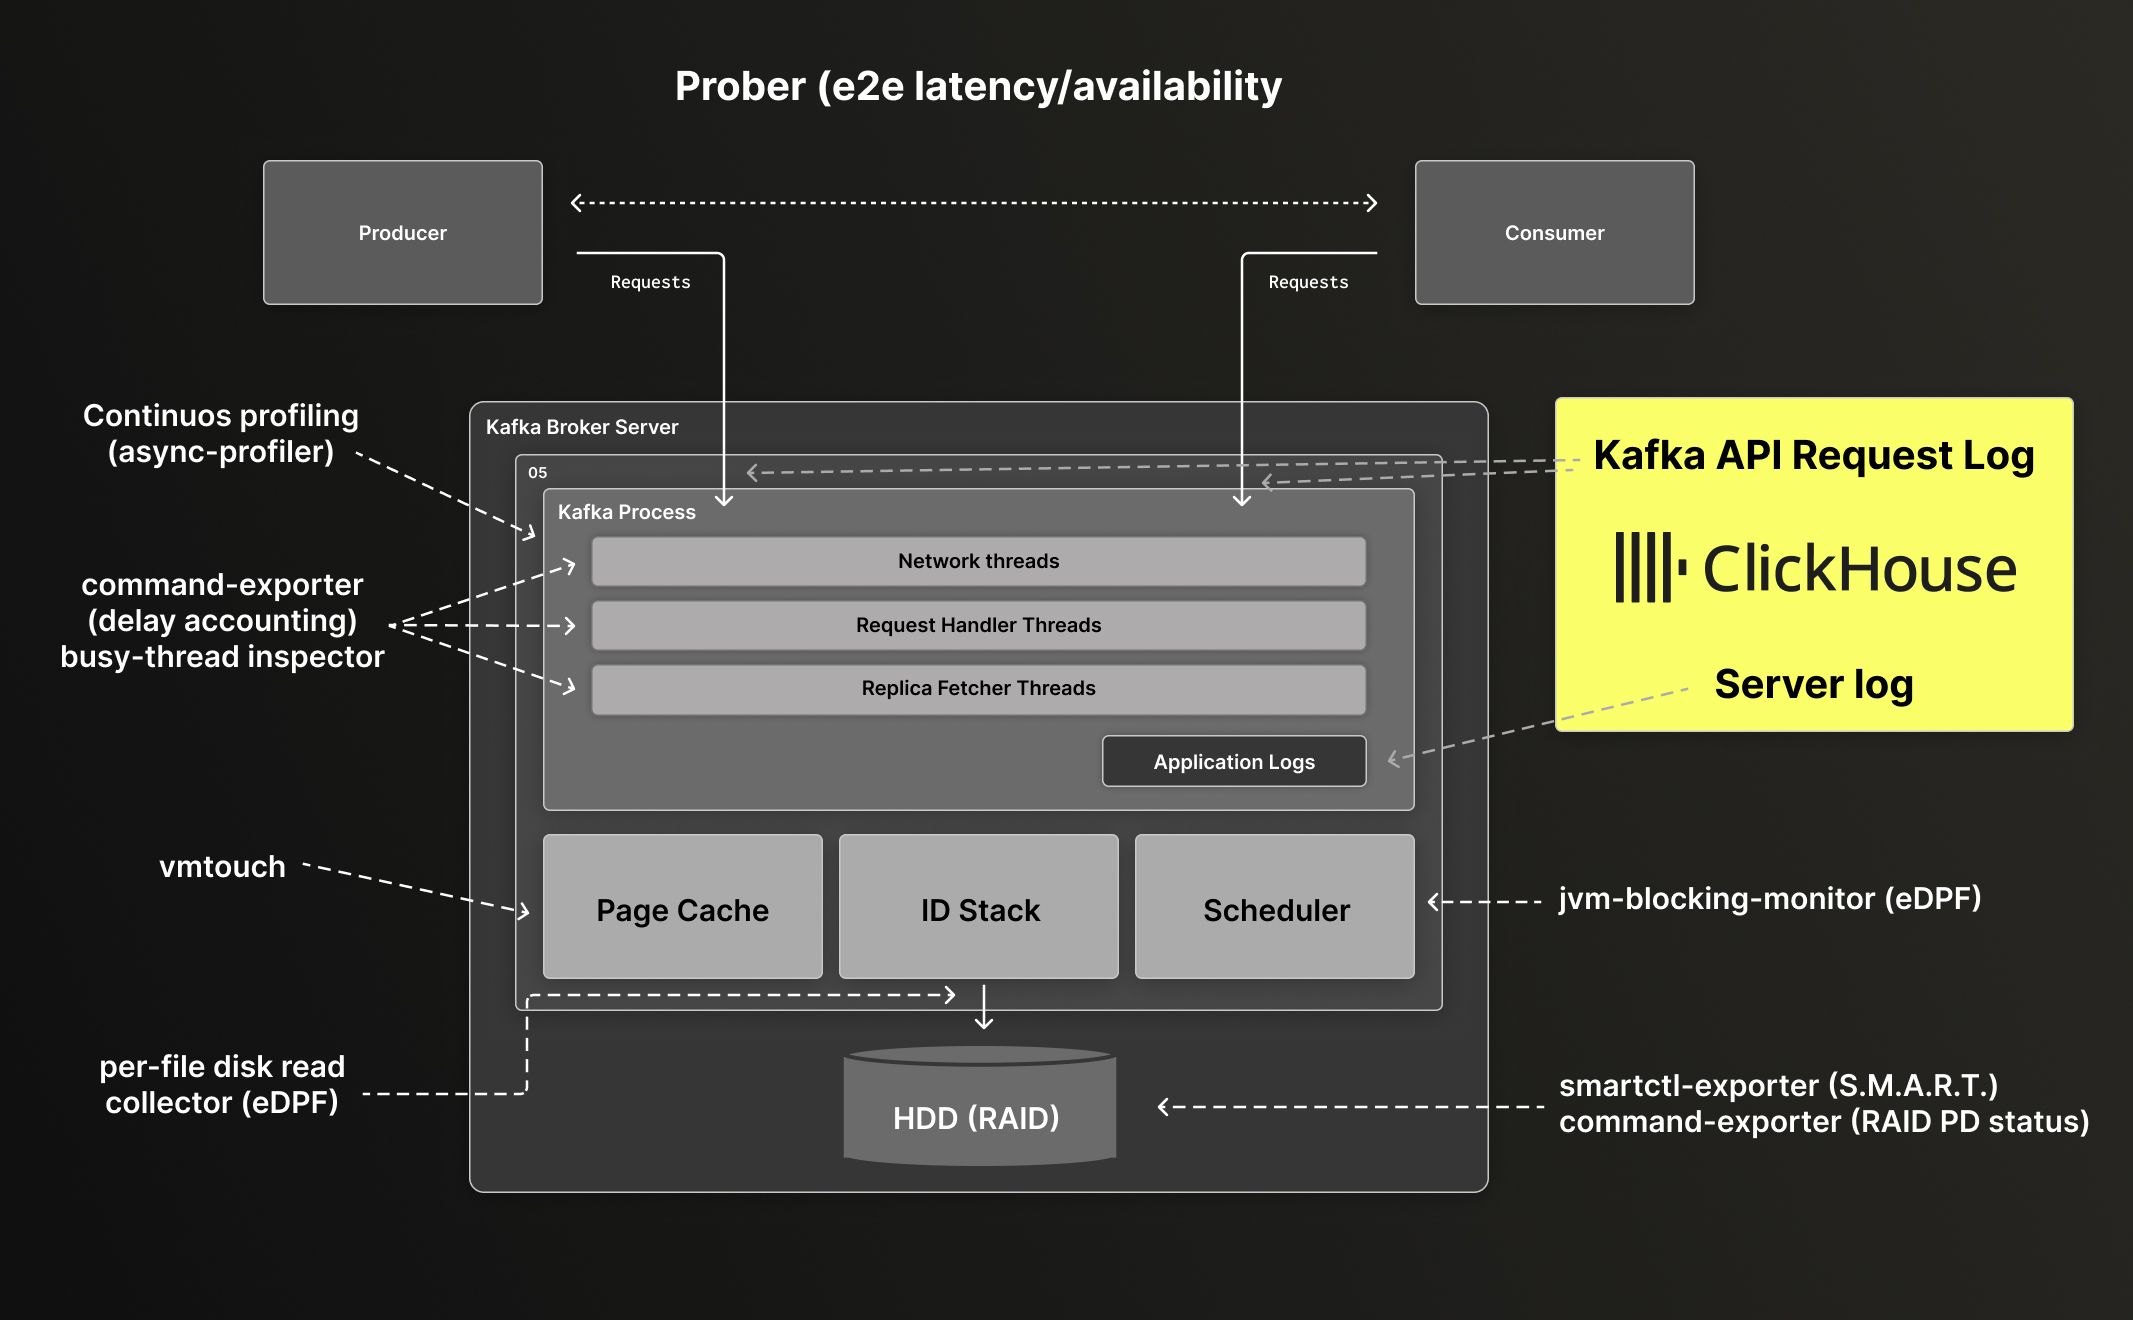
Multi-layer observability stack capturing Kafka, JVM, kernel, and disk metrics for real-time diagnosis.
At the top, they run a probe that constantly measures end-to-end performance—how long it takes for a message to make the full trip from producer to broker to consumer. Beneath that, they continuously profile the Kafka process using Async Profiler, capturing CPU behavior and JVM-level insights that help pinpoint hotspots. From there, they go even deeper, instrumenting the Linux kernel using delay accounting, eBPF tools, per-disk read collectors, and SMART data exporters. If the kernel scheduler blips, or if a disk starts behaving strangely, they know.
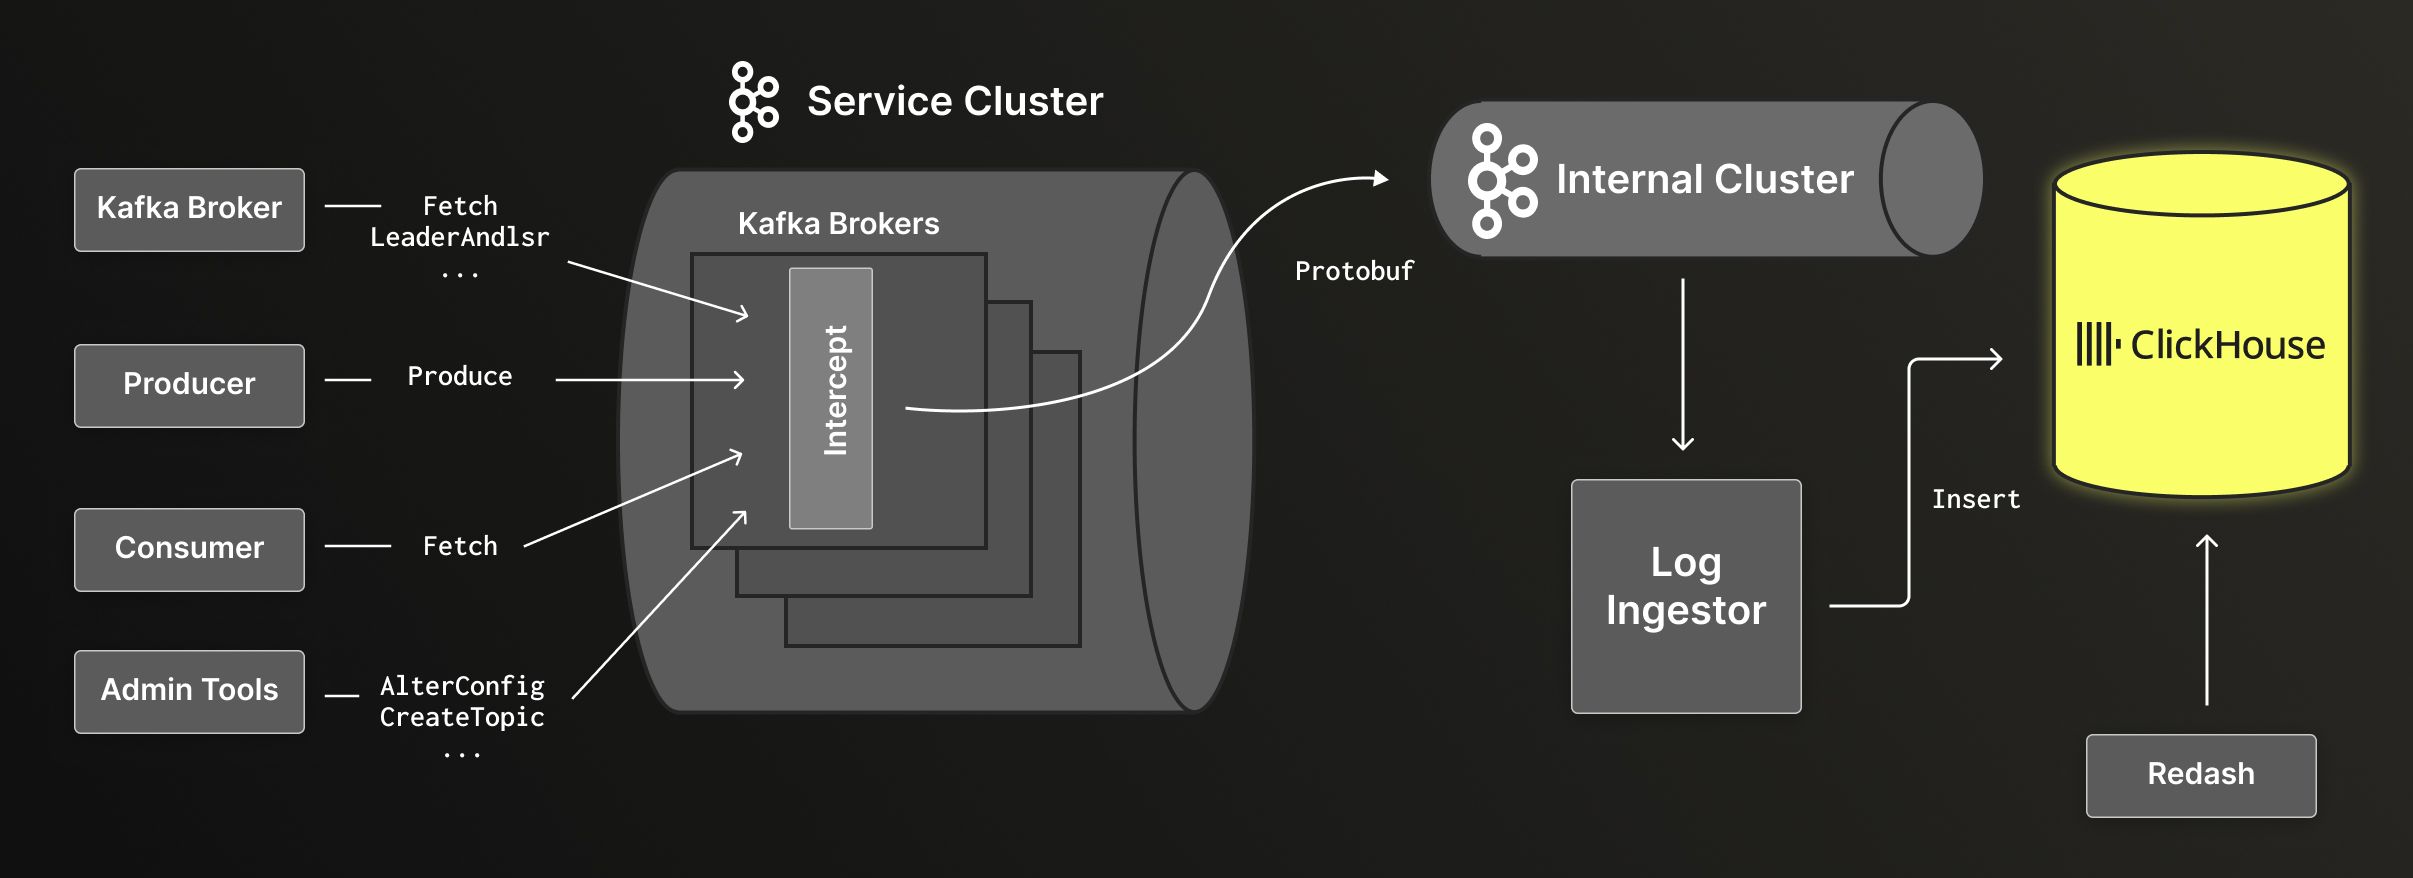
But the layer that matters most when things go wrong is the Kafka API request log pipeline, powered by ClickHouse—because that’s where LY sees exactly what the system was doing at any given moment. Every request to Kafka—produce, fetch, consume, inter-broker replication, admin operations—is intercepted, serialized via Protocol Buffers, pushed into an internal Kafka cluster, and then consumed by a “log ingestor” that writes it into ClickHouse in large batches.

Kafka API requests flow through interceptors into ClickHouse for high-volume, queryable observability.
This produces an enormous amount of data. LY stores 7 million rows per second of API request logs in ClickHouse. Over time, that’s grown into a dataset of more than 4.1 trillion rows. As Haruki puts it, “The amount of data ingested into ClickHouse is extremely large.”
Why they chose ClickHouse #
The LY team chose ClickHouse for three main reasons. The first is its SQL compatibility, which means engineers can query the data without specialized training. “SQL is the query language our developers are most familiar with,” Haruki says. “This is a major advantage.”
The second is its compression capabilities. “ClickHouse is extremely efficient in terms of storage,” Haruki says. “Thanks to its columnar architecture, it achieves very high compression rates. Even with large volumes of data, storage efficiency remains high.”
Last but not least is performance and the ability to scale horizontally. “Performance is key,” he says. “We’re ingesting 7 million rows per second, and we’re able to do this with just 24 ClickHouse cluster nodes, which is both energy-efficient and cost-effective.”
Engineers access the data through Redash dashboards or direct SQL queries, often during live debugging sessions. And as Haruki showed at our Tokyo happy hour, that queryability is how the team caught one of their strangest Kafka bugs to date.
Catching a Kafka bug in production #
The story started with something LY almost never sees: produce requests failing in a specific Kafka partition. When Haruki checked the usual dashboards, he saw something even more alarming—replication had completely stopped. The leader was receiving messages, but the followers weren’t keeping up, causing the producer to lose quorum and reject new messages.
At first glance, it looked like a follower issue. But when he dug into the follower logs, he found odd messages about “offset out of order” and “non-monotonic offsets.” That’s not supposed to happen. Offsets in Kafka partitions always move forward by exactly one. A single jump backward can break the entire replication pipeline. So he dumped the relevant buffer. That’s when he encountered a “strange phenomenon.” Offsets were counting up normally… and then suddenly jumping back dozens of values. Something deep in Kafka’s internals had gone wrong.
Haruki suspected it might be a race condition between two Kafka APIs—Produce and ListOffsets—which both touch the underlying log segment on disk. Under an extremely narrow timing window, two threads might both access or modify the offset state in a conflicting way. “At this point, I’m just forming hypotheses based on reading the code,” Haruki says. “The key was figuring out how to prove it.”
To confirm his theory, Haruki needed to know exactly which API calls happened at exactly which moments. Here, he says, “the API request log we collected with ClickHouse was really helpful.” Using the API request logs stored in ClickHouse, Haruki ran a SQL query across billions of rows for the timeframe of the incident. And there it was: a ListOffsets call had landed at the precise moment the Produce request started failing. With clear evidence that the two operations had collided, the hypothesis turned into a confirmed upstream bug.
Haruki and the LY team submitted a patch to the Kafka community, and the issue is now under review. Without ClickHouse giving them the ability to easily query trillions of API logs, the problem would have been much harder to solve.
Why ClickHouse matters at LY’s scale #
For most companies, Kafka is sturdy, predictable infrastructure. At LY Corporation’s scale, it’s a high-performance machine running at the edge of what the open-source platform was ever meant to handle.
ClickHouse gives LY something special: the ability to perform real-time forensics on a trillion-messages-per-day system using plain SQL. Engineers can take a hunch, write a query, and trace behavior down to the millisecond, across billions or even trillions of records.
As Haruki puts it, “ClickHouse plays a really important role in our automated monitoring efforts. We’re handling a massive amount of data—about seven million rows per second—but with just 24 servers, we’ve achieved outstanding cost performance.”
When you’re operating at LY’s scale, surprises are unavoidable. But with ClickHouse at the heart of their observability platform, even the oddest, rarest bugs leave a trail. And that trail is what lets Haruki and the LY team keep one of the world’s largest Kafka systems running smoothly every single day.


