When metrics work and they don't
When I get paged, I open the metrics dashboard. That hasn’t changed. Metrics are still the fastest way to get a rough sense of whether a system is unhealthy, especially when you’re dealing with known failure modes and issues you can reasonably anticipate ahead of time.
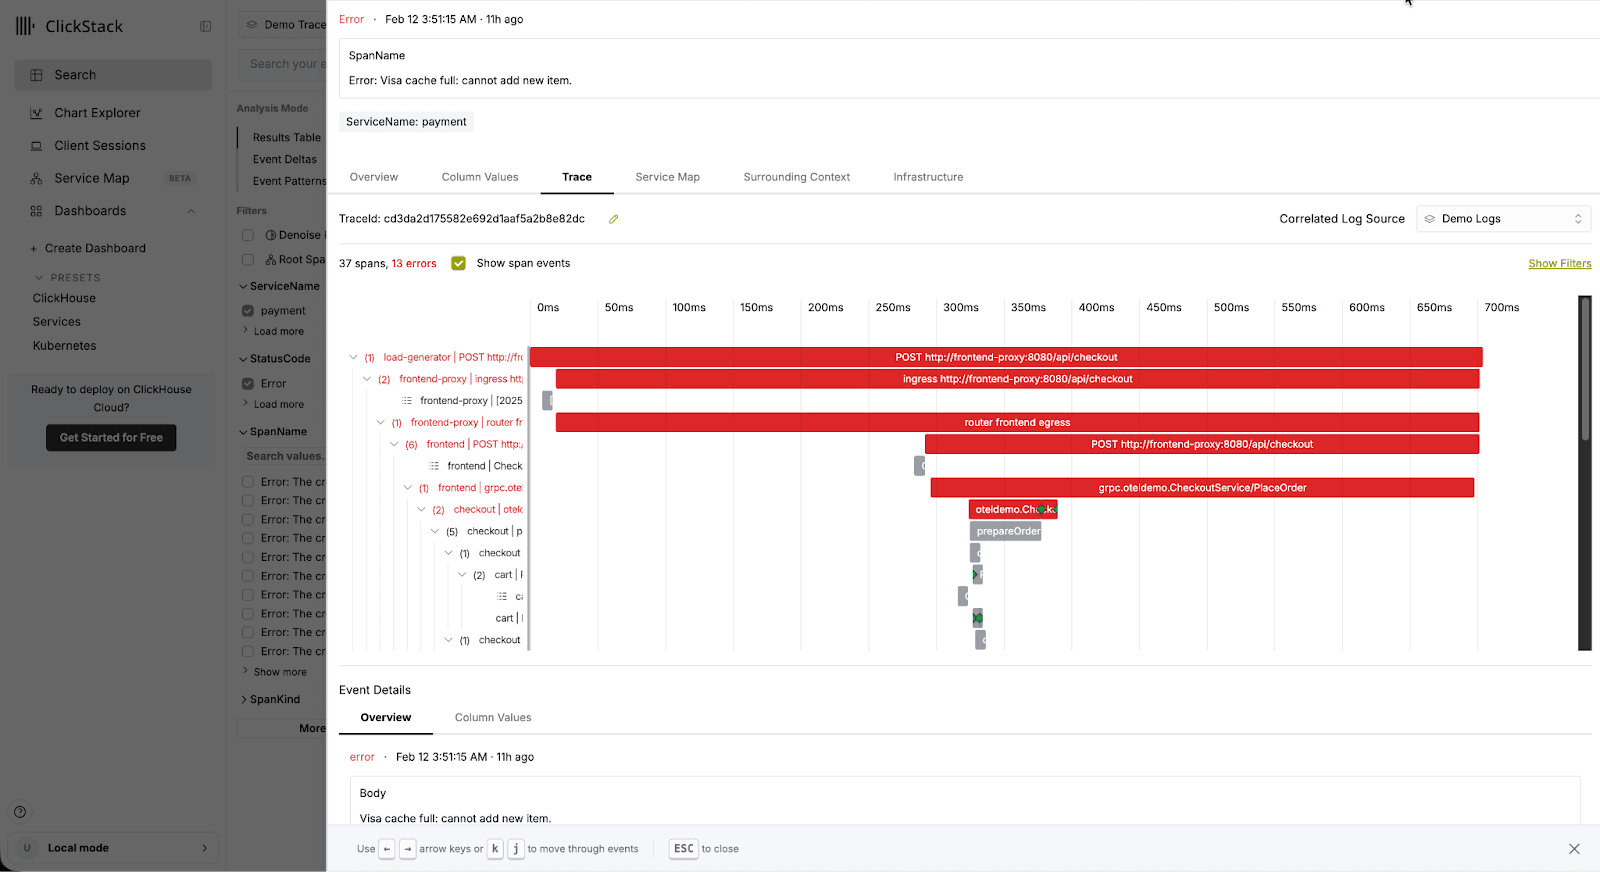
However, most of the time I just can’t anticipate all my issues. A lot of my time is spent looking at dashboards that are heavily based on traces & logs, or diving directly into search, or even consulting LLM agents to help investigate alongside me. Often as a developer, there isn’t a page at all. Just a user or support engineer asking why something feels slow or broken. In those cases, metrics usually don’t say much. No alert fired. No threshold was crossed. Everything looks normal, even when it clearly isn’t.

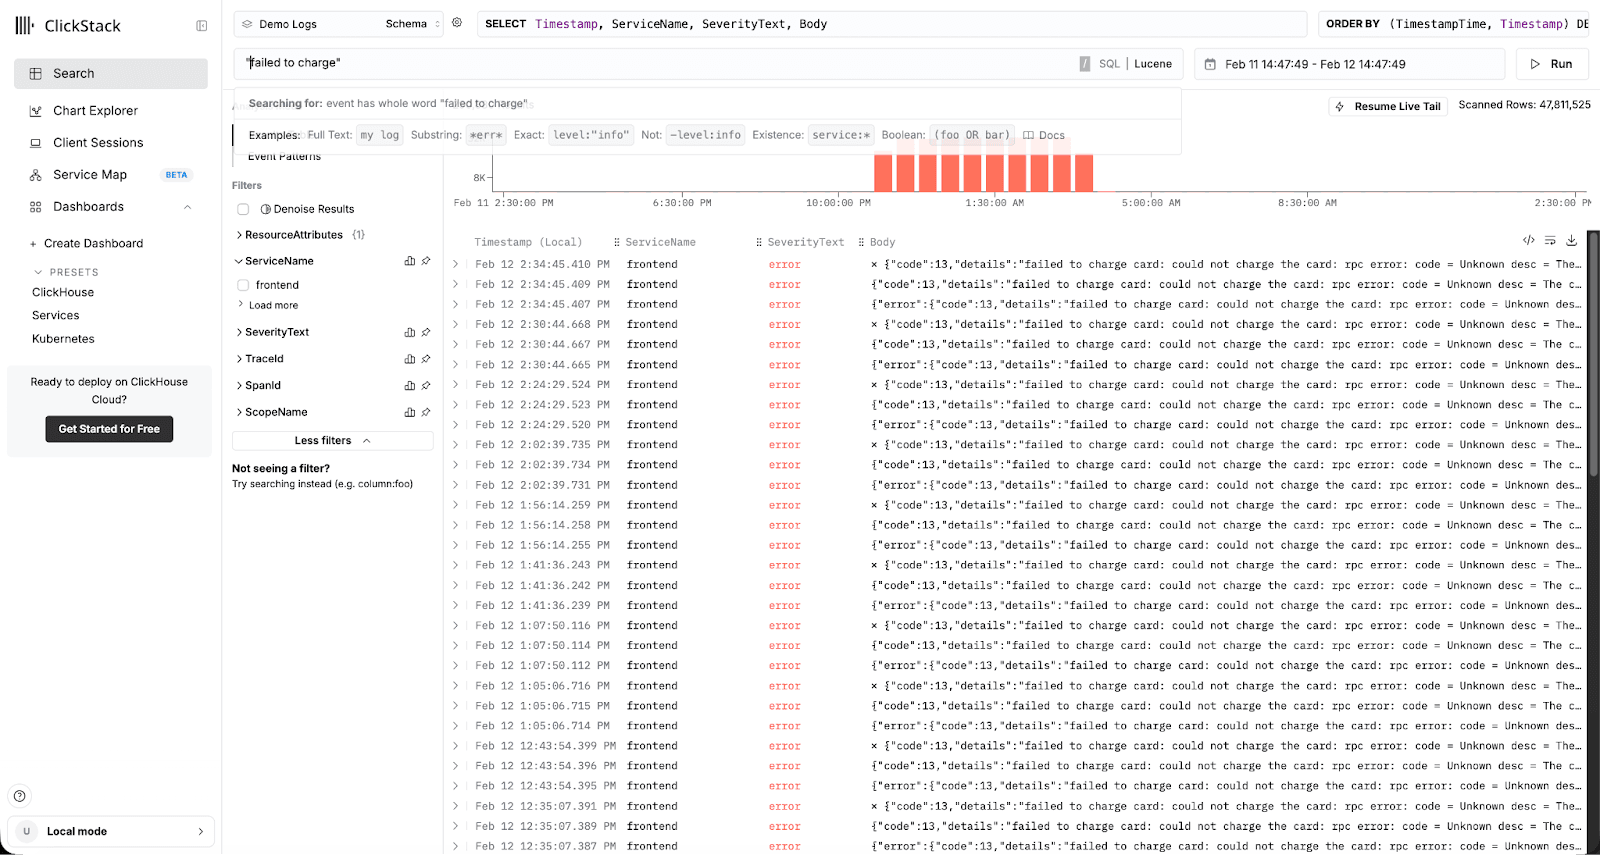
In ClickStack, searching and analyzing events is the primary user experience, because it reflects the most common way engineers actually investigate and resolve issues.
As a result, I think a shift is coming to how we think about metrics in monitoring and observability. Metrics will still matter, but they won’t remain a core part of our monitoring stacks. As rollups over structured data become cheaper and more native - especially in columnar databases like ClickHouse - metrics start to look more like an optimization layer and secondary feature rather than the primary interface or user workflow.
At a technical level, metrics are pre-aggregated statistics. They exist to compress extremely high-volume signals into something cheap to store and fast to query. That’s essential when the raw data rate is unreasonable. Given its popularity, we'll use Prometheus for examples here.
For example, CPU usage is typically captured as a rolling aggregate rather than raw events. Instead of recording every CPU instruction or context switch, a Prometheus-style metric tracks CPU time accumulated over an interval, broken down by coarse dimensions like core or mode. This produces a small, stable set of time series that can be queried efficiently.
node_cpu_seconds_total {
  instance="node-17",
  cpu="2",
  mode="user"
}
This single counter represents aggregated CPU time across millions of operations on a specific host and core, keeping cardinality bounded while still providing enough context to reason about system health.
We're not going to emit an event per CPU cycle or log every disk operation. CPU time, memory usage, filesystem utilization - these will continue to exist as metrics because the alternative doesn’t scale and the level of fidelity unnecessary.
Metrics also work because they’re curated. Historically, this mattered a lot. A human decided that latency, error rates, saturation, queue depth, and throughput were important. A human implemented instrumentation to measure them with reasonable accuracy. That judgment is why metrics work well for alerting. If a metric exists at all, it’s usually because someone already believed it was operationally significant.
But those strengths come with real limitations.
Metrics systems typically require intentionally discarding cardinality. High-cardinality dimensions are restricted or dropped to control cost and complexity. That means individual cases/errors/exceptions can’t be debugged without dropping into the higher cardinality logs/traces anyway.
A common case is per-request latency in a Kubernetes service. If latency is labeled by pod ID, request ID, or user ID, cardinality grows unbounded as pods churn and traffic changes, forcing those dimensions to be dropped in metric systems. In practice, you end up with something like:
http_request_duration_seconds_bucket {
  service="checkout",
  method="POST",
  status="500",
  le="500ms"
}
The pod ID, request ID, or trace ID labels are intentionally excluded because adding them would create millions of time series. When one specific request or pod misbehaves, the metric stays smooth and isn’t useful to our investigation, so we have to jump to logs or traces to find the real cause.
Correlation is another weak point. Metrics typically live in a separate system from traces and logs. Joining low-cardinality time series with high-cardinality event data is either unsupported or awkward enough that teams avoid it. Rarely do metrics alone tell the whole story, and going from a metric to a log or a trace is a bread-and-butter workflow that is largely patched over today.

True observability brings logs, metrics, and traces into a single, correlated view, giving engineers the exact time, service, and resource context needed to diagnose an issue.
Lastly, metrics must be defined in advance during the development flow. Someone has to decide what to measure, how to aggregate it, and where to emit it in the code. This works when the questions are well understood and issues can be fully anticipated. It works poorly when the most important questions only become obvious after something breaks.
These are not tooling flaws so much as consequences of the abstraction.
As the limitations of metrics become more apparent, the rest of the observability stack has evolved. We now have structured events and traces with rich, high-cardinality context. We have columnar databases that can efficiently store this data, with high compression - allowing users to store more data at higher fidelity. Instead of emitting separate logs and metrics, a single event can capture both.
{
  "timestamp": "2026-02-10T14:03:27Z",
  "service": "checkout",
  "pod_id": "checkout-7c9f8d6b4f-k2m9p",
  "trace_id": "4f8c2a9e3d",
  "request_id": "req-91827",
  "latency_ms": 842,
  "status_code": 500,
  "cpu_ms": 37,
  "memory_bytes": 52428800,
  "level": "error",
  "message": "Checkout request failed due to upstream timeout"
}
Example logline with metrics that includes metrics
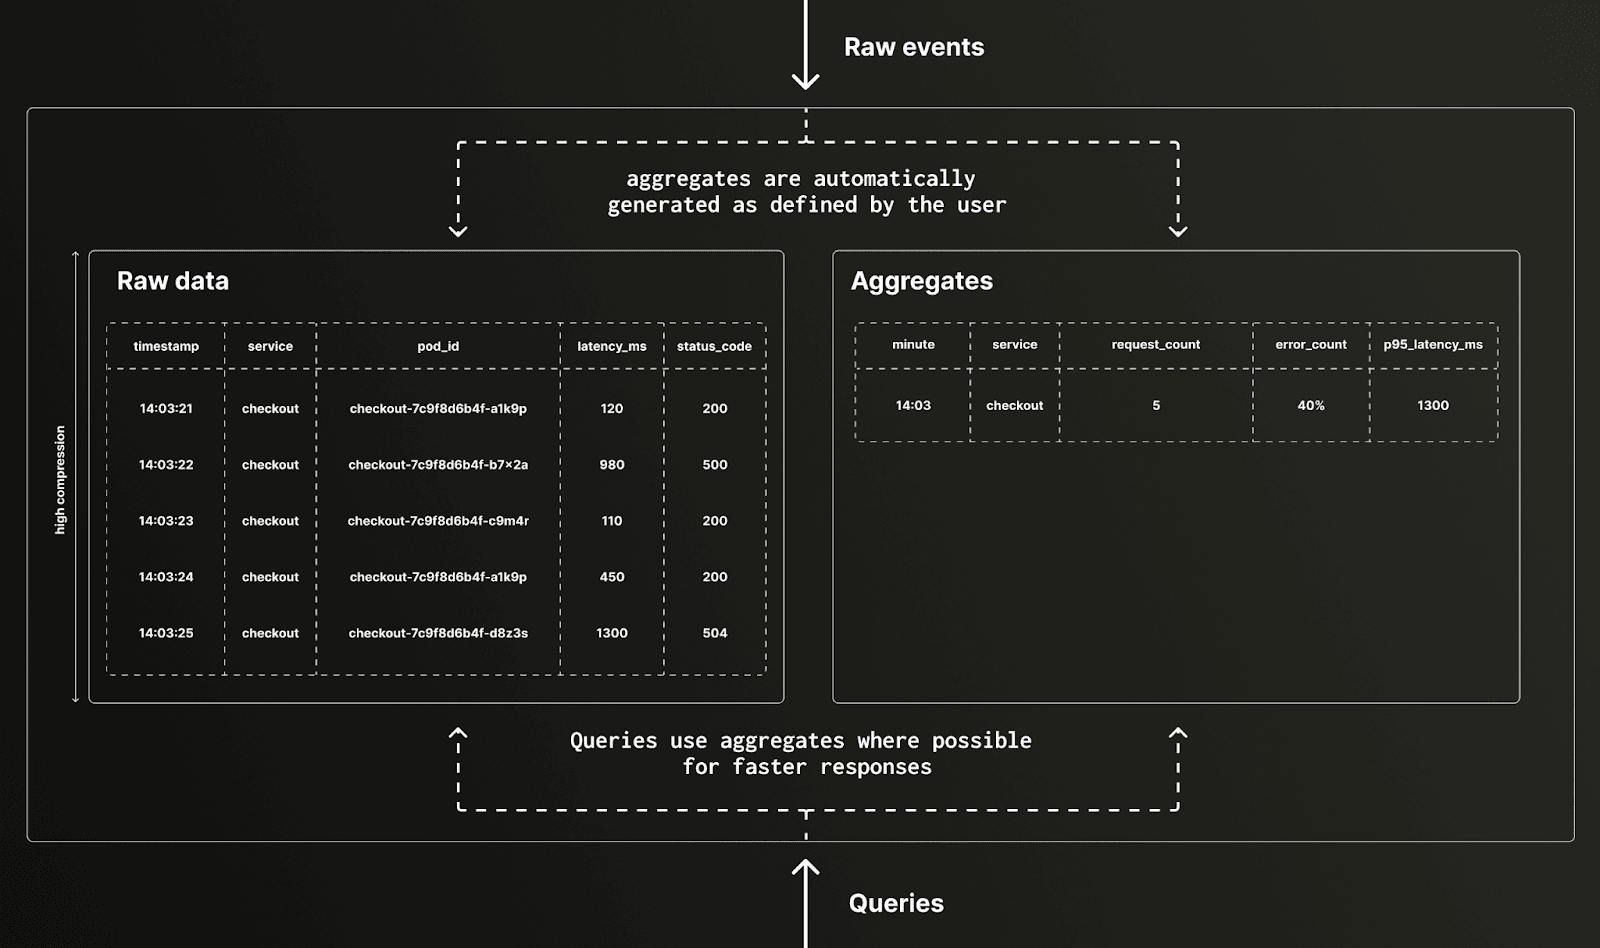
This data can be aggregated and rolled up across many dimensions. In systems like ClickHouse, those rollups are automatic, incremental, and cheap enough to use by default, while the raw data remains available for high-fidelity issue resolution.
Raw structured events:
| timestamp | service | pod_id | latency_ms | status_code |
|---|
| 14:03:21 | checkout | checkout-7c9f8d6b4f-a1k9p | 120 | 200 |
| 14:03:22 | checkout | checkout-7c9f8d6b4f-b7x2q | 980 | 500 |
| 14:03:23 | checkout | checkout-7c9f8d6b4f-c9m4r | 110 | 200 |
| 14:03:24 | checkout | checkout-7c9f8d6b4f-a1k9p | 450 | 200 |
| 14:03:25 | checkout | checkout-7c9f8d6b4f-d8z3s | 1300 | 504 |
Natural rollup derived from the same data:
| minute | service | request_count | error_rate | p95_latency_ms |
|---|
| 14:03 | checkout | 5 | 40% | 1300 |
Once you have this capability, it becomes reasonable to ask whether metrics need to be treated as a separate, first-class artifact at all.
If structured events can be rolled up efficiently, a metric is effectively a cached query with a faster response time. You can retain high-cardinality raw data while also maintaining low-cardinality aggregates that behave like traditional metrics. The difference is that the aggregation doesn’t need to be baked into SDKs or emitted explicitly - it becomes simply a technique for accelerating common queries over real data.

This reframes the role of metrics. They stop being the source of truth and become a performance optimization. Users think about what is worth accelerating vs what is worth capturing. The raw events describe what actually happened; the metric is just one useful summary among many.
This shift also changes the role of curation. Historically, metrics worked because someone had to decide in advance what mattered, defining what to measure and how to aggregate it during development. That model breaks down when the most important questions only become clear after something goes wrong.
With richer, high-cardinality observability data, curation can move later in the process. Humans can start from raw events, explore what actually happened, and decide which dimensions and aggregates are worth operationalizing, instead of guessing upfront. This makes investigation more flexible and reduces the cost of being wrong early.
As LLMs increasingly participate in observability workflows, this shift becomes even more powerful. Agents can explore raw data, surface interesting patterns, and suggest useful aggregations automatically, without requiring those decisions to be baked into instrumentation ahead of time. In that sense, it mirrors the shift from ETL to ELT in the data world, where structure and meaning are applied after ingestion rather than before.
Yes and no. I still believe metrics will have a place. Some signals are inherently aggregates (ex. CPU, memory, disk). Some alerts need simple, stable thresholds. But as rollups in columnar databases continue to get faster and cheaper, it’s reasonable to expect metrics to shift from being the organizing primitive of observability to being one optimization among many.
Observability stacks built around rich data, flexible rollups, and increasingly capable analysis layers are better positioned for that future: one where the most important questions aren’t always known in advance, and where understanding production systems depends less on guessing correctly upfront and more on being able to ask better questions later.
