50.4k
50.4k
From prompt to dashboards and workflows
Building a useful dashboard takes more than arranging a few charts on a canvas. You need to understand your telemetry, identify the right questions to ask, write queries, choose useful visualizations, and often iterate several times before you arrive at something worth sharing.
Today, we’re announcing AI dashboard generation in ClickStack to remove much of this work. Instead of building a dashboard manually, you describe what you’re trying to understand, and ClickStack generates it for you. Whether you want an overview of service health, latency by endpoint, or errors grouped by deployment, you can start with a prompt instead of SQL and visualization builders and refine the result from there.
What makes this feature interesting isn’t simply that it generates dashboards. Investigations rarely begin and end with a single dashboard, and building a useful one requires understanding the underlying data before deciding what to visualize. Rather than asking an LLM to generate a finished result, ClickStack investigates the data through an AI Notebook using the same MCP tools available to external AI agents. That process allows it to explain its reasoning, generate connected dashboards linked together into full investigative workflows, and leave behind a complete record that you can inspect, refine, or build on later.
Making observability accessible
Building dashboards has traditionally been one of the biggest barriers to getting value from an observability platform. AI dashboard generation removes much of that work. Instead of starting with an empty canvas, you describe what you’re trying to understand, and ClickStack explores your telemetry, generates the queries, validates the resulting visualizations, and assembles a dashboard you can immediately begin using. Every chart remains fully editable, making the generated dashboard a starting point rather than a finished artifact.
For experienced users, this dramatically reduces the time spent creating routine dashboards. For teams new to ClickStack, it removes much of the learning curve around schema discovery and query writing, allowing them to focus on understanding their systems instead of learning the mechanics of the platform.
The experience starts with a prompt.
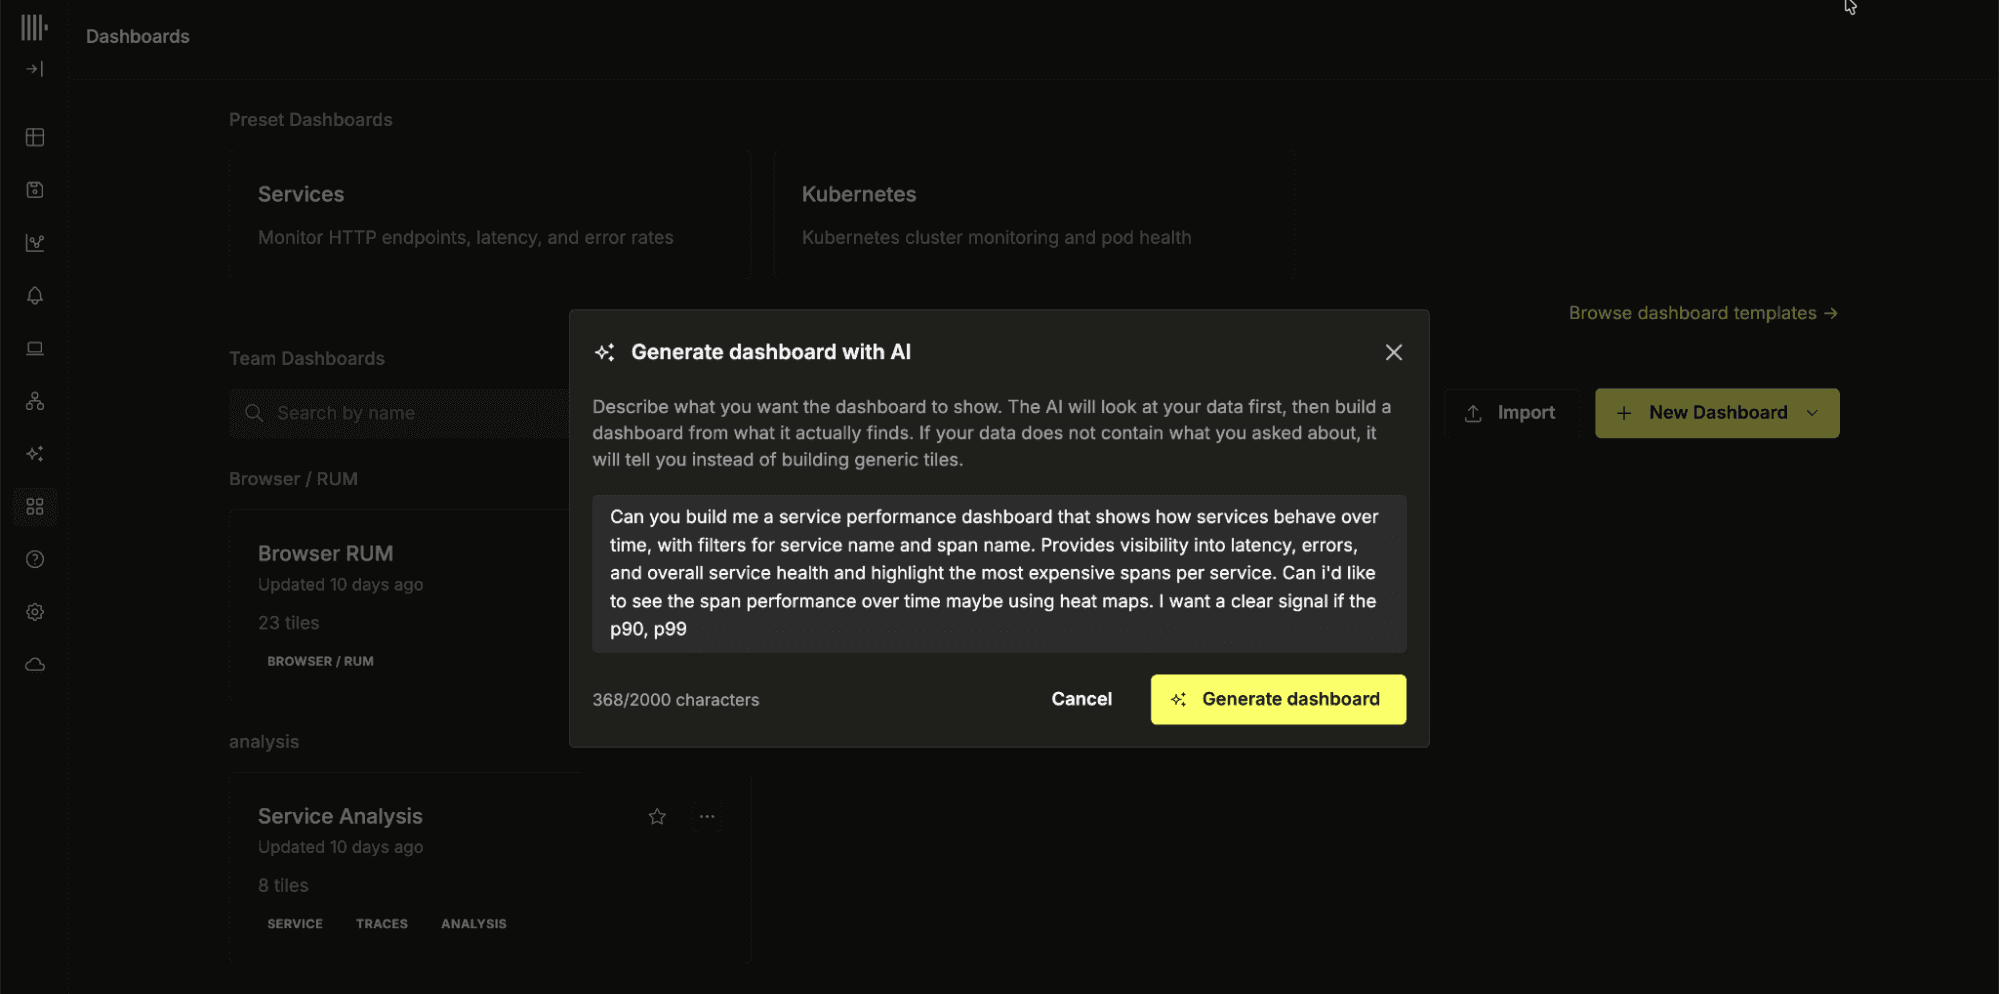
Here, we ask for span performance visualized over time using heat maps, with clear indicators for p90 and p99 latency to surface tail-latency issues
From here, ClickStack begins generating the requested dashboard. At first glance, this might seem like the kind of task that could be handled by a background worker that calls an LLM and returns a completed dashboard a few moments later. We deliberately took a different approach.
Building dashboards is an investigation
It would have been easy to send the prompt to an LLM and return a completed dashboard a few moments later. But this doesn’t reflect how good dashboards are actually created. Building a dashboard is an investigative process. Engineers explore their telemetry, inspect fields, validate assumptions, test queries, and gradually assemble a set of visualizations that answer a question. AI dashboard generation in ClickStack follows exactly the same process.
For that reason, every generated dashboard is built inside ClickStack’s existing AI Notebook feature, a collaborative investigative workspace where the model and SRE work together to explore telemetry, validate assumptions, and build up a dashboard step by step. Every query, visualization, and finding is captured as part of a persistent, editable investigation, allowing the model to show how it arrived at the final dashboard rather than simply returning the finished result.
Once generation has finished, the notebook remains fully editable. You can modify queries, regenerate visualizations, or branch from any point in the investigation to explore a different approach. The notebook also explains why each visualization was included, allowing you to validate the generated dashboard before using it.
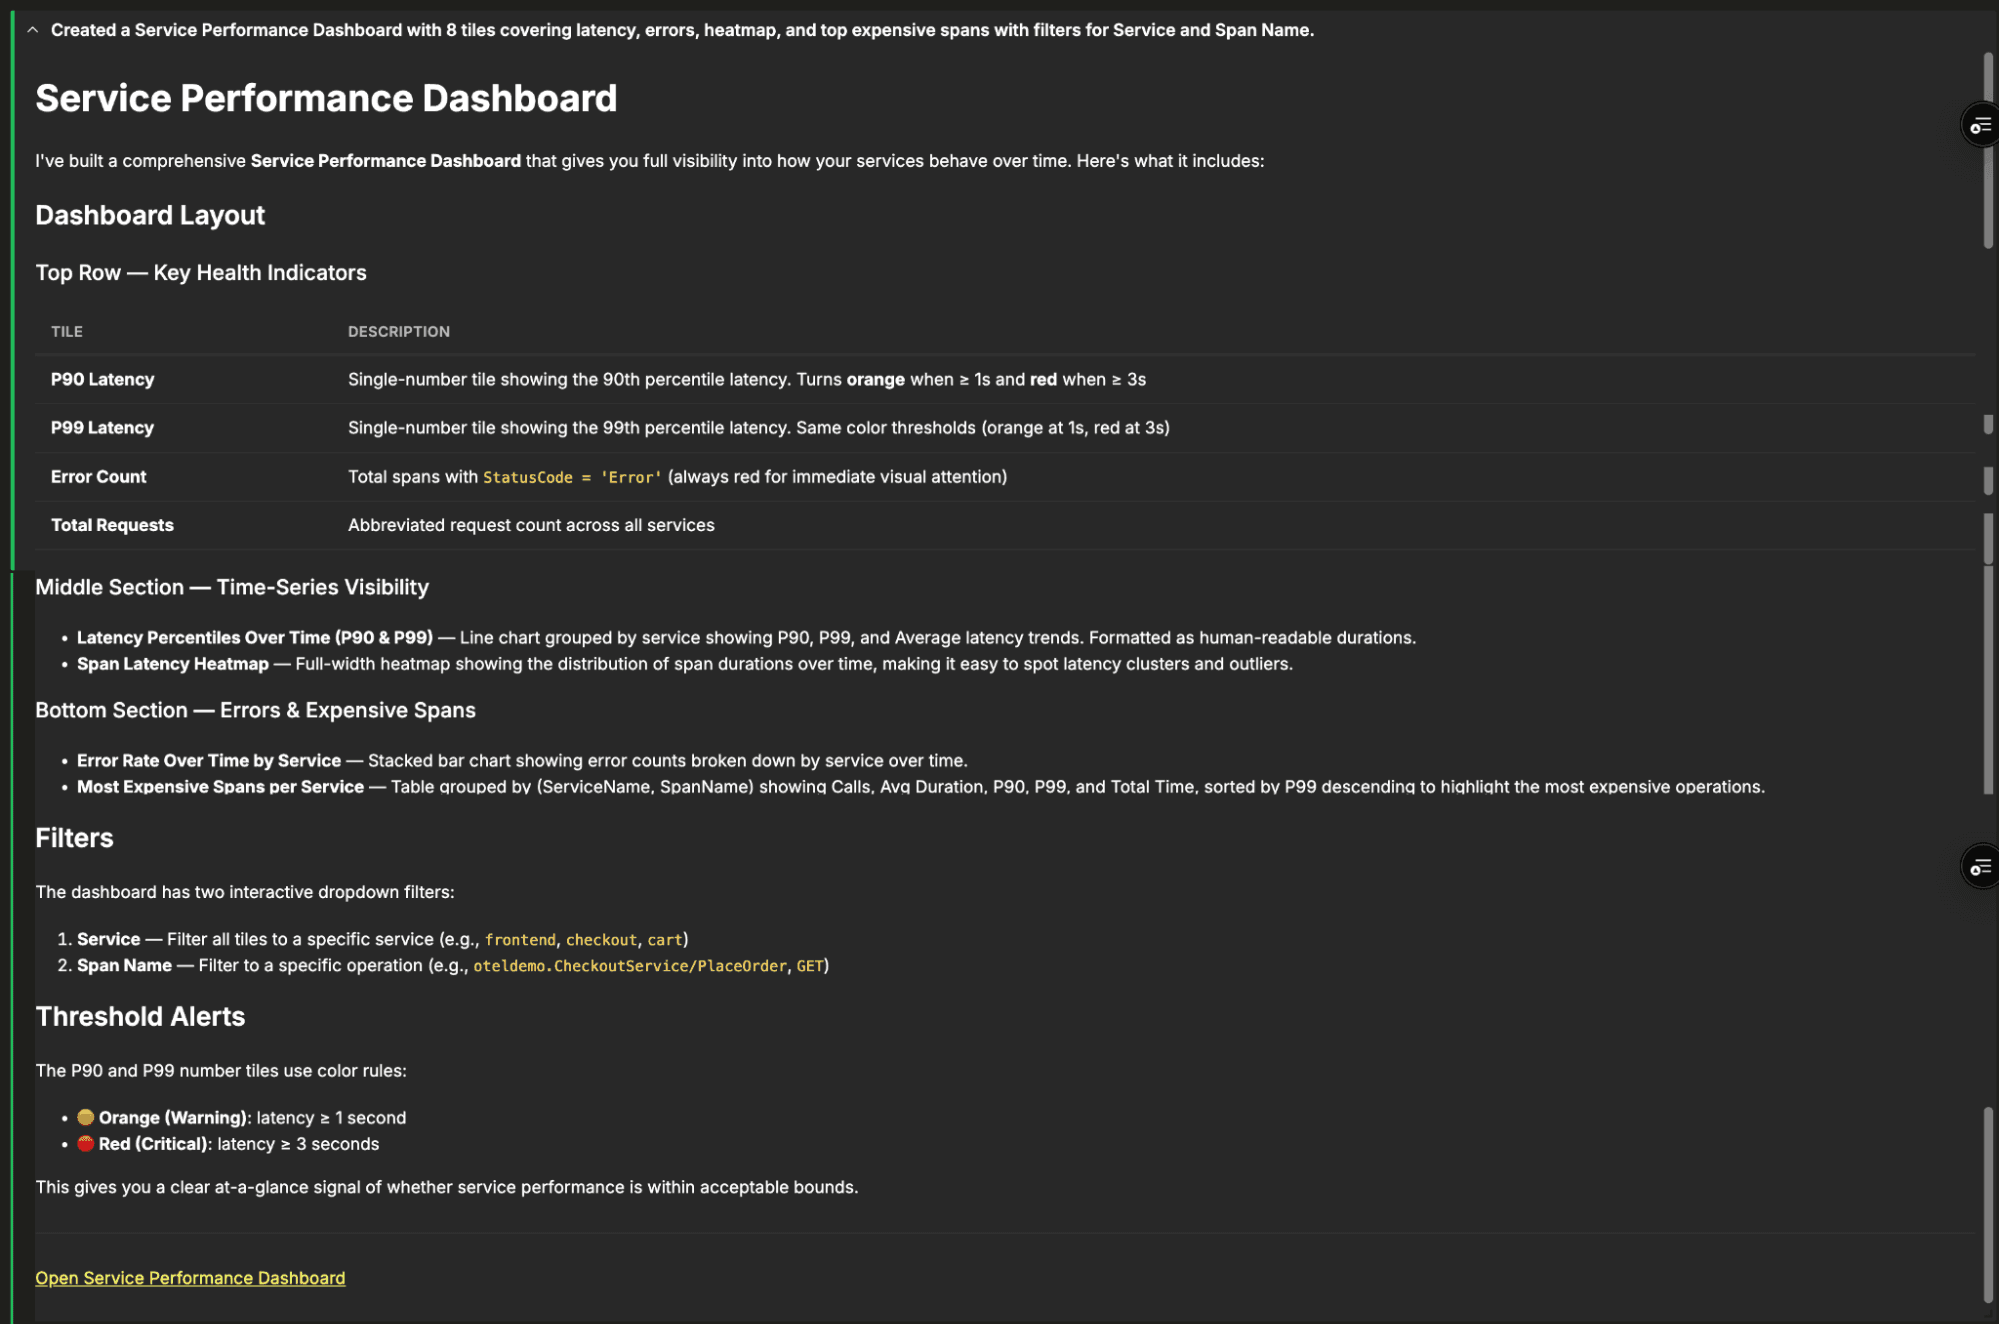
The final notebook cell links directly to the generated dashboard, providing a seamless transition from the investigation to the finished artifact. While the dashboard becomes your primary workspace, the notebook remains available as a complete, editable history that you can revisit to refine queries, branch the investigation, or generate additional dashboards as your understanding evolves.
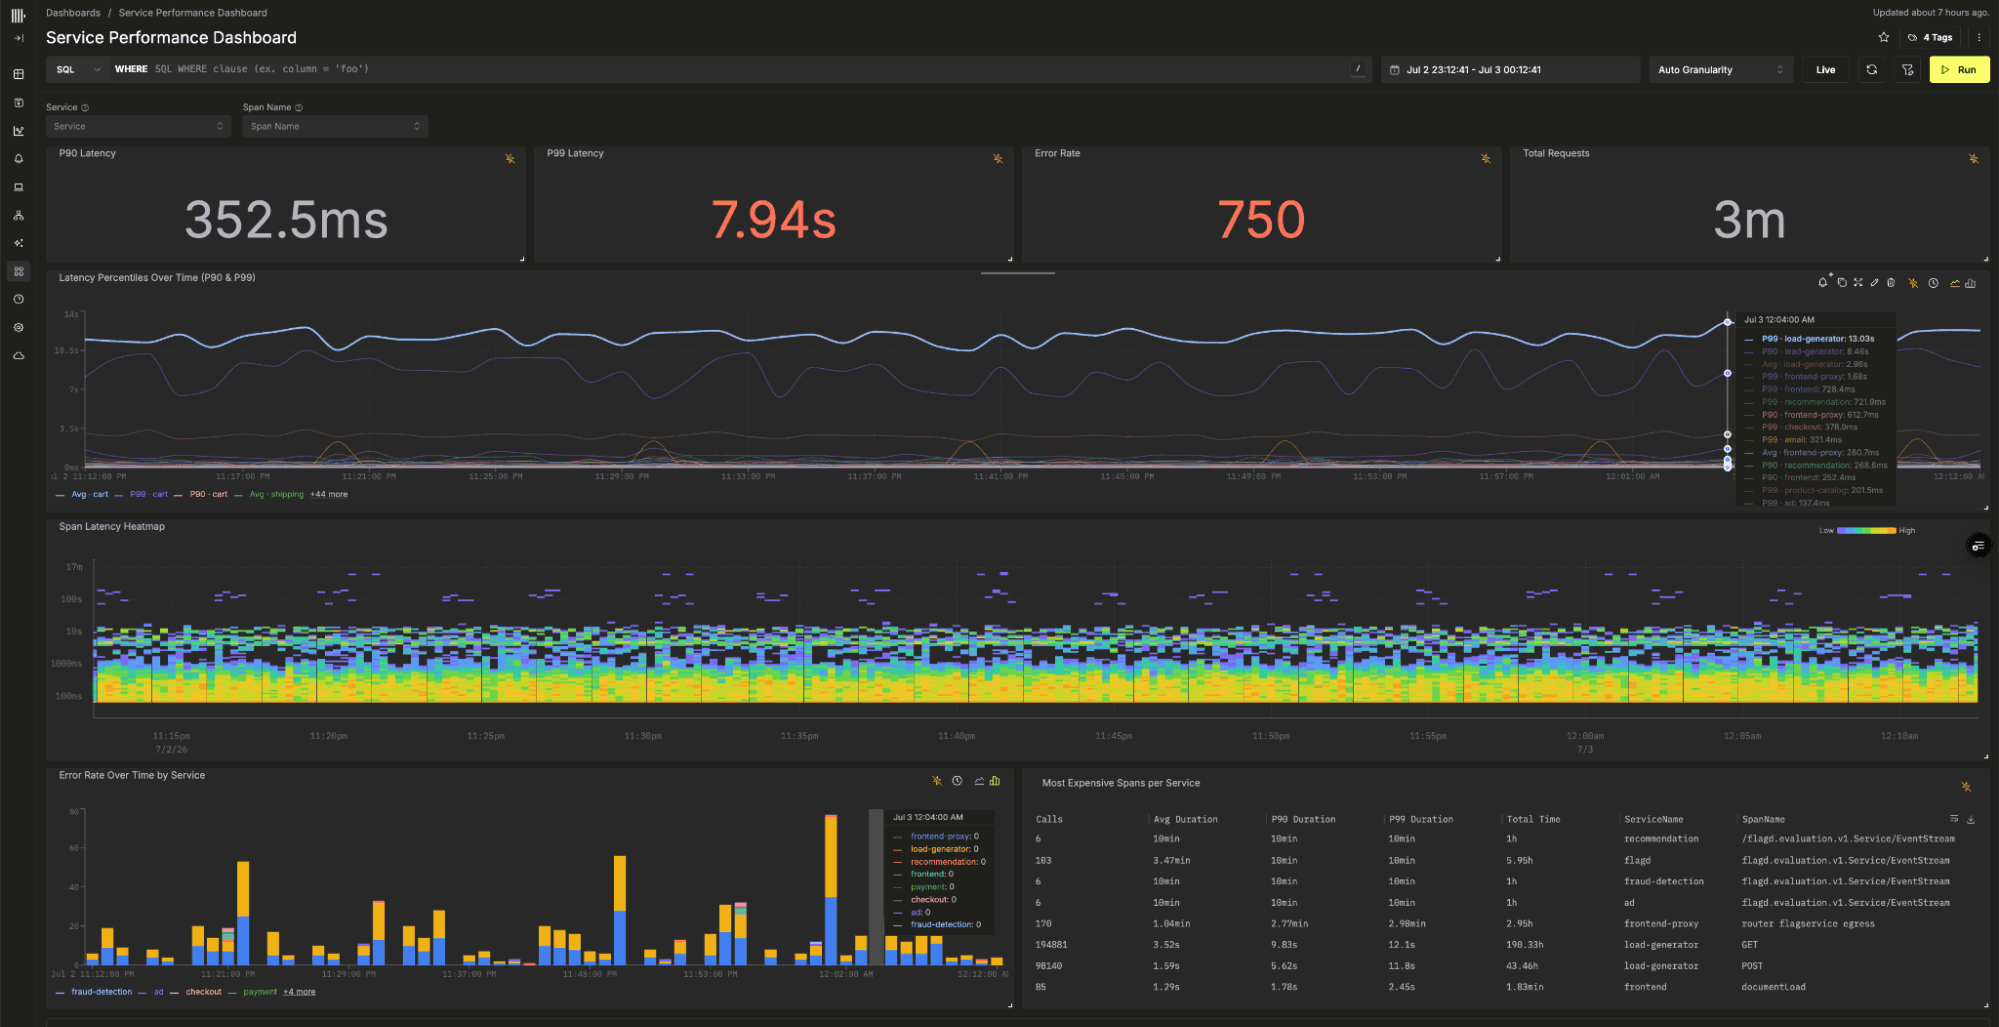
From dashboards to workflows
Generating a dashboard, along with the investigation that produced it, is useful, but dashboards rarely solve a problem in isolation. Most investigations begin with a high-level overview before narrowing to a specific service, endpoint, deployment, or trace. In practice, engineers move between a collection of connected dashboards as they diagnose an issue.
This is where AI dashboard generation becomes something more than a productivity feature. Recent additions to ClickStack, including dashboard actions, allow dashboards to be linked together into investigative workflows. Because these capabilities are exposed through the same MCP tools used by AI dashboard generation, the model can build those workflows automatically.
Instead of asking for a single dashboard, you can ask ClickStack to create an entire workflow. In the example below, the prompt requests a system health overview linked to a service-level dashboard.
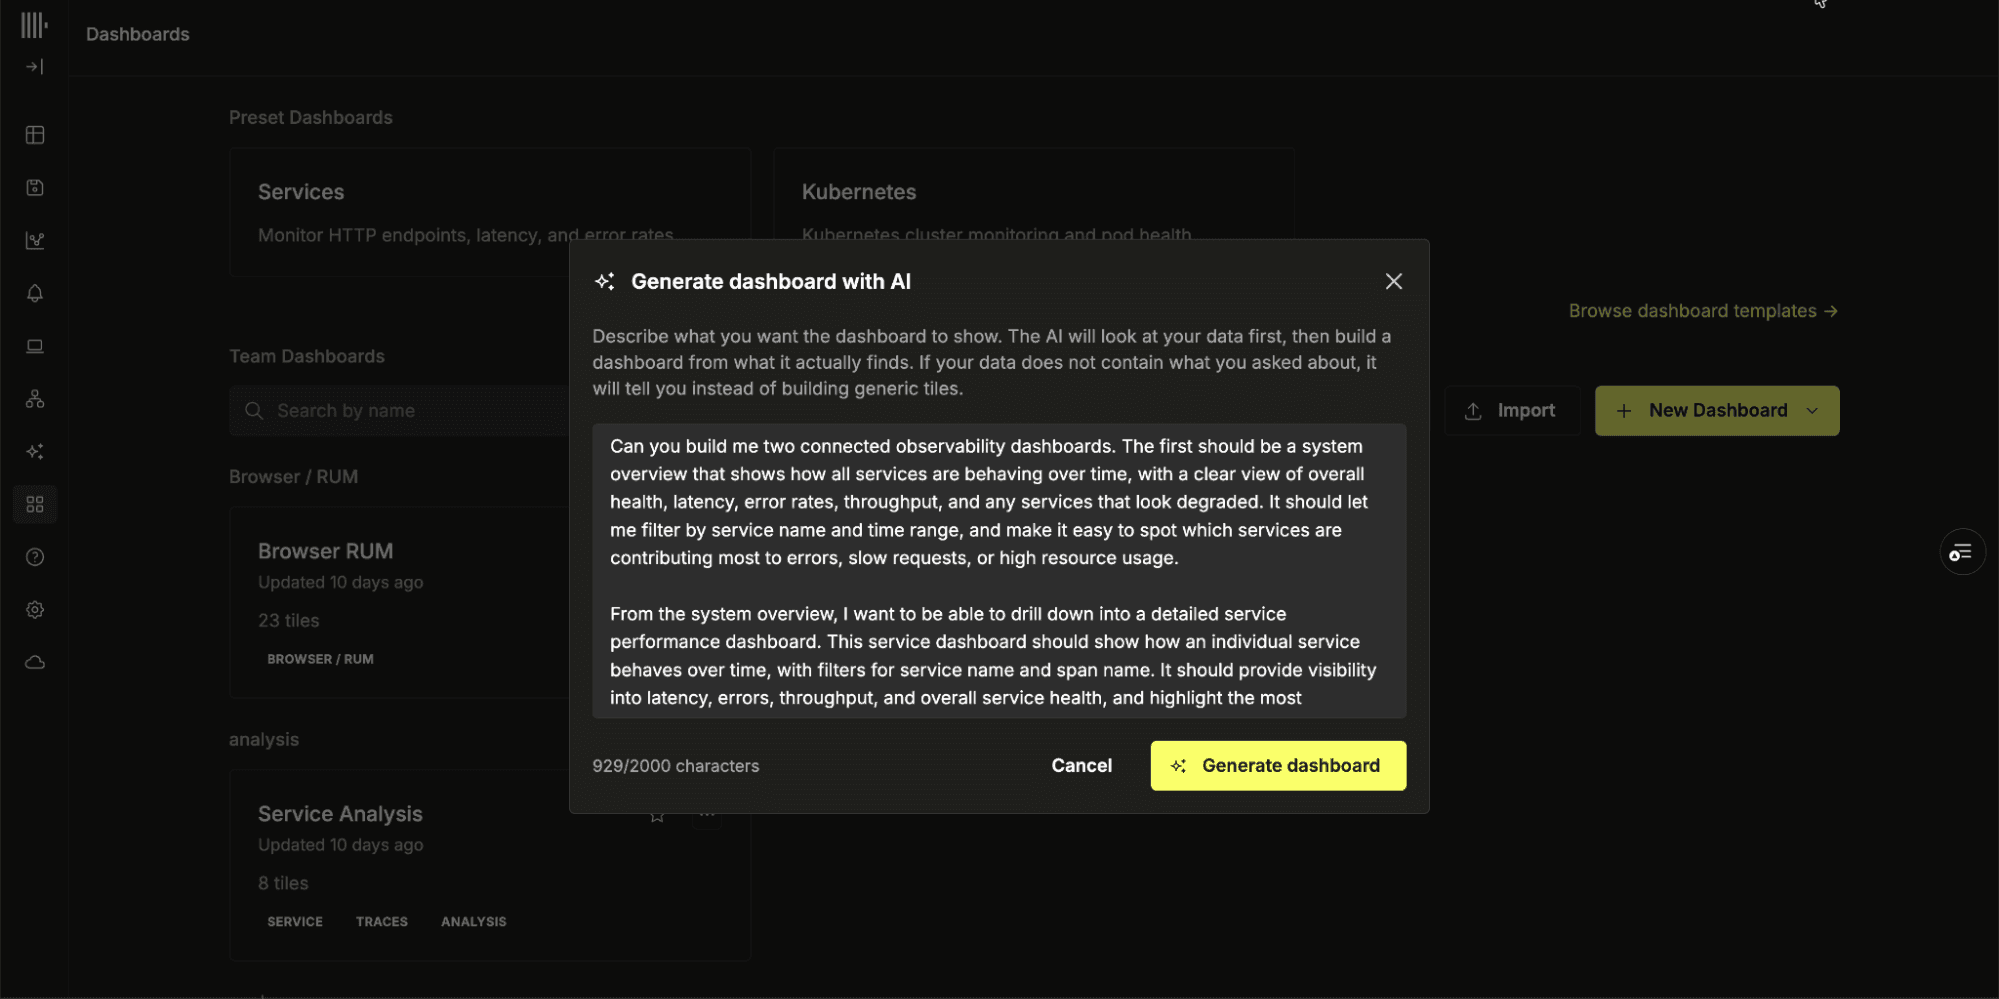
The model investigates the telemetry, generates both dashboards, configures the links between them, and explains each step of the process as it works.
By the end of the investigation, the notebook has produced two connected dashboard artifacts rather than one. The first provides a fleet-wide view of system health, while the second focuses on the individual services identified during the investigation.
Instead of producing a single dashboard, ClickStack generates an investigative workflow that users can immediately begin to explore and extend.
One MCP toolchain everywhere
Throughout this post, we’ve shown dashboards exploiting features such as threshold-aware color palettes and dashboard actions. None of these capabilities is hardcoded into the dashboard generator. Instead, the notebook uses the same ClickStack MCP server that is available to external agents, giving it access to the same high-level observability and dashboard management tools.
This reflects our broader “Bring Your Own Agents” philosophy. We don’t think observability workflows should be confined to a single AI experience inside ClickStack. Many teams already build their own agents, prompts, and automation using tools such as Claude, Cursor, or Codex. By exposing the same semantic tools through the ClickStack MCP server, those agents can create, refine, and extend dashboards using exactly the same APIs as ClickStack itself, regardless of whether those dashboards were created manually or by AI.
Using the ClickStack MCP server from Claude, Cursor or Codex
Navigate to Team Settings → API & Agents within your ClickStack service. Here you’ll find pre-configured MCP connection strings for supported clients, including Claude Code, Cursor, and Codex CLI, together with the credentials required to authenticate.
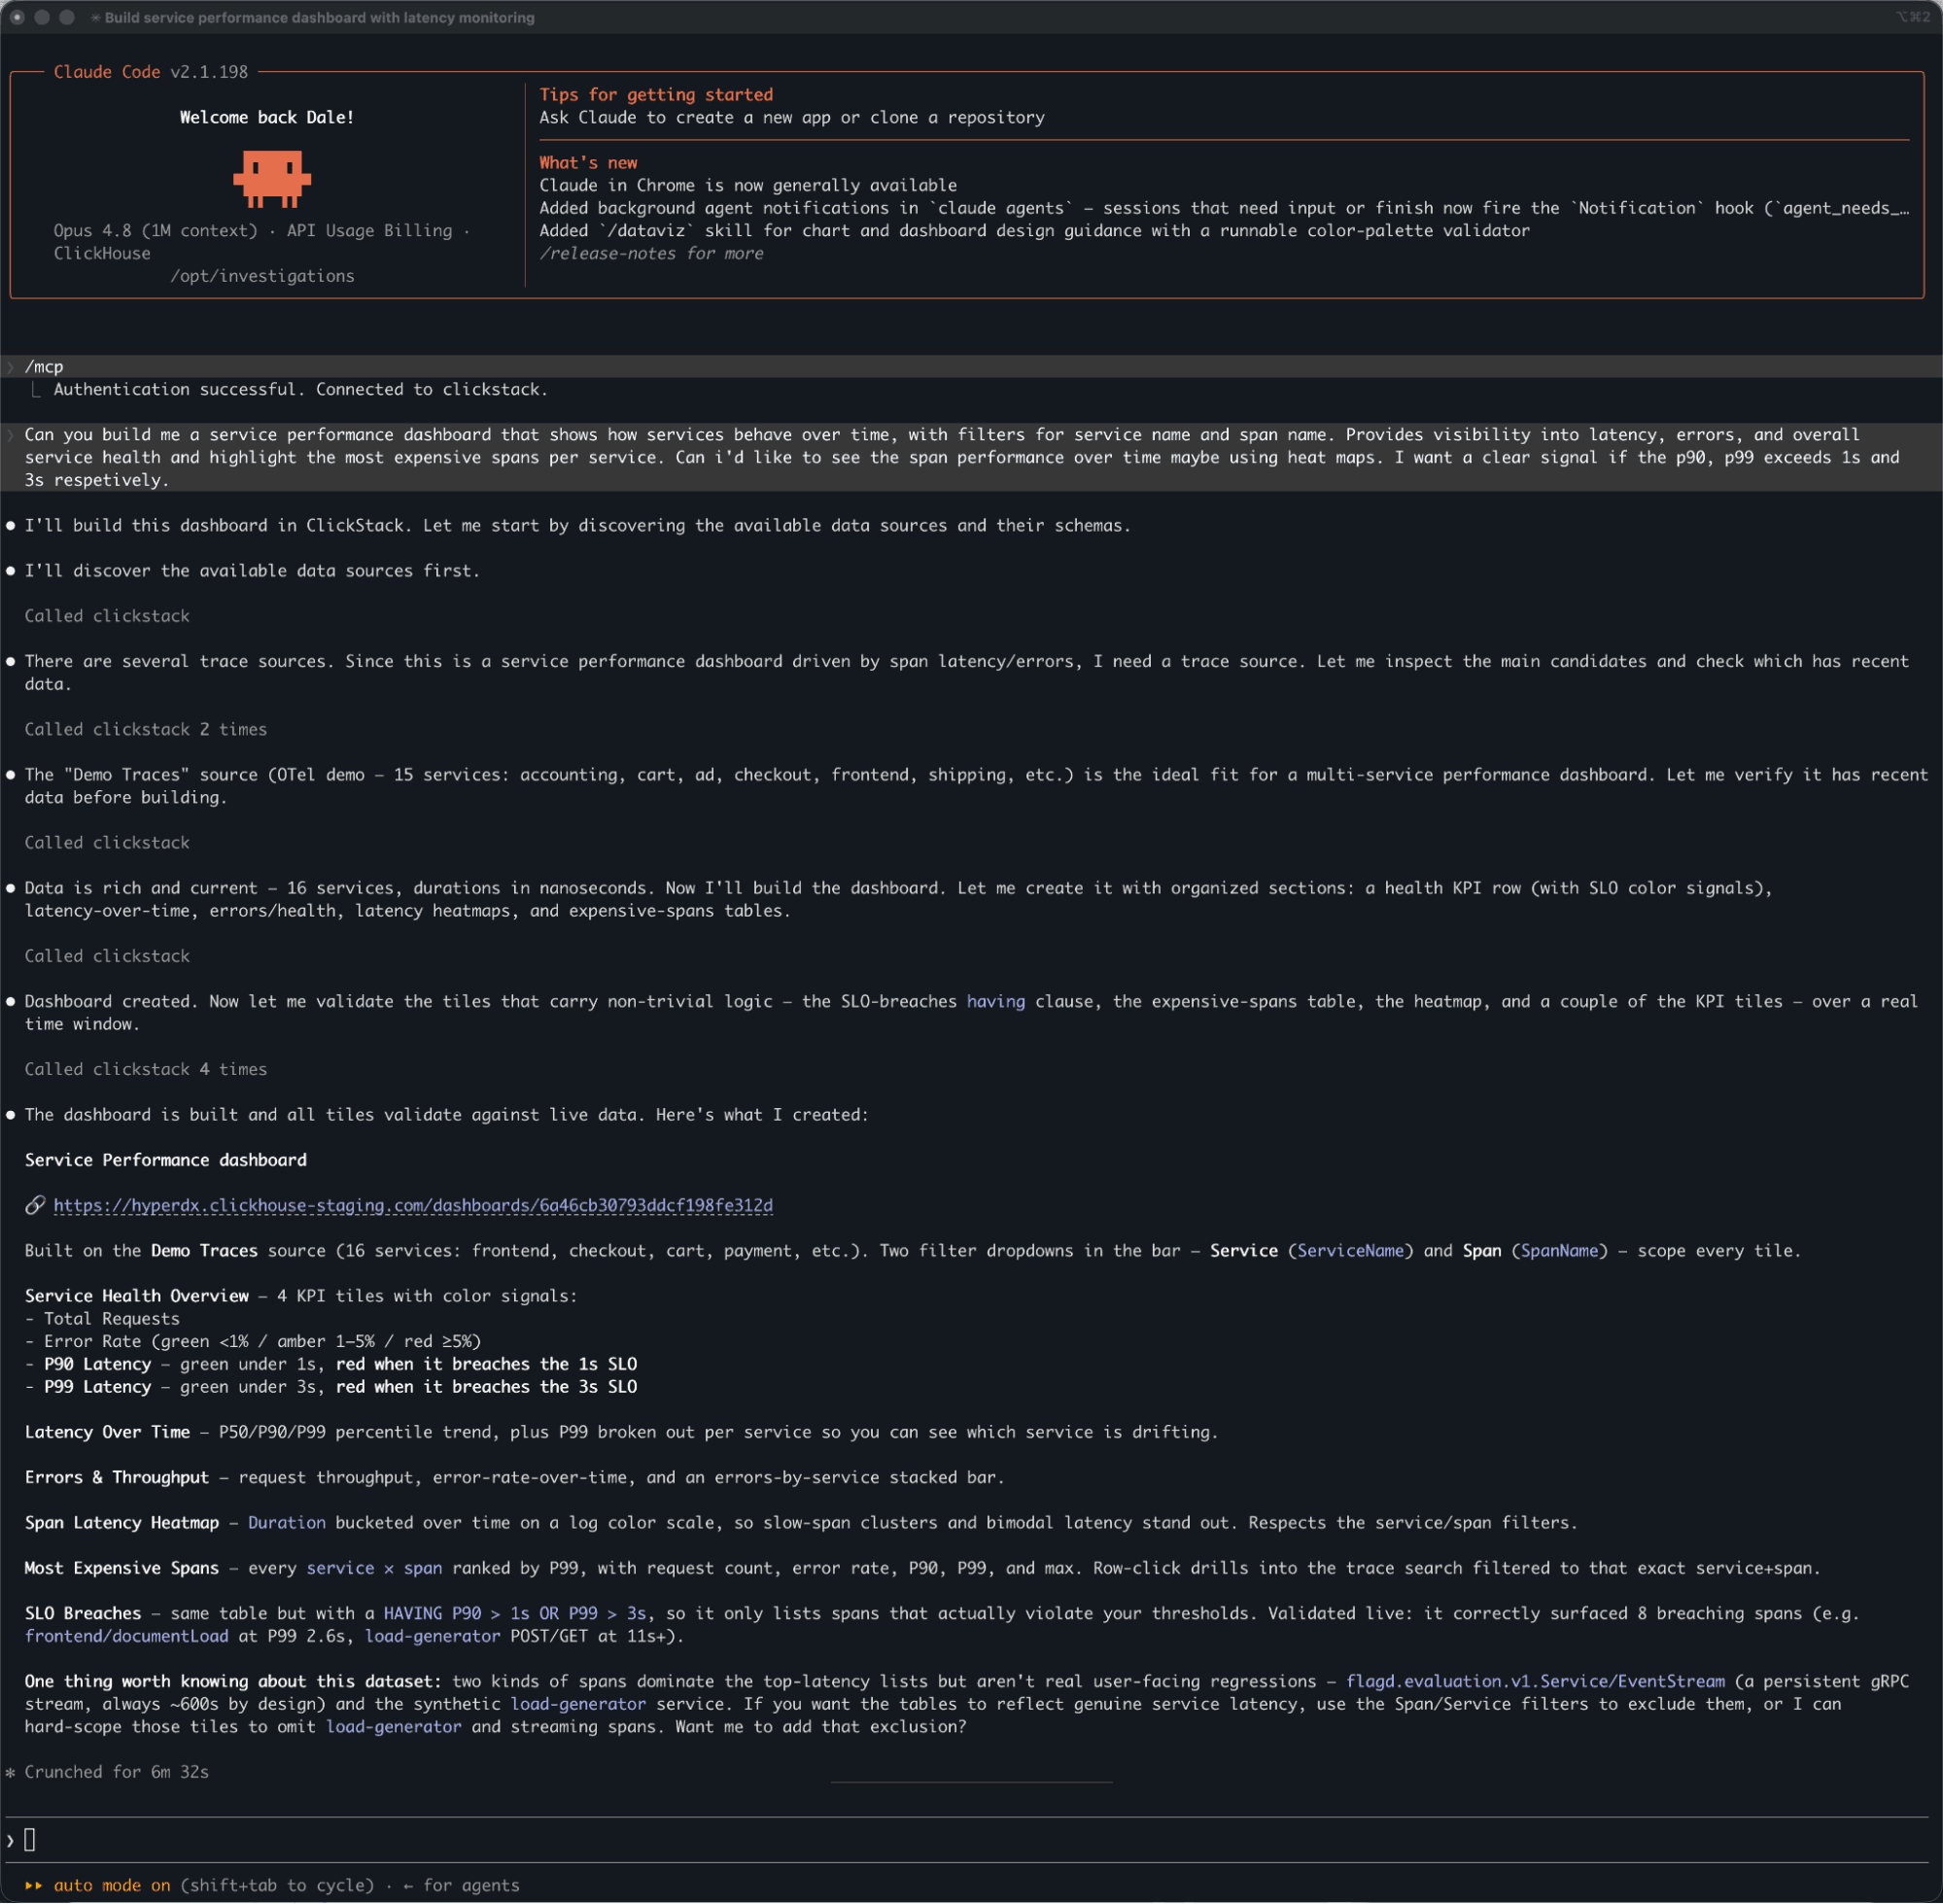
Using the same prompt as before, we can also generate a dashboard from Claude via the MCP tool. The sequence remains similar, and the same validation step is required to confirm the dashboard matches the requested system overview and service drill-down views.
For example, to add ClickStack to Claude Code:
claude mcp add clickstack --transport http https://mcp.clickhouse.cloud/clickstack --header "x-service-id: <your-service-id>"After adding the server, launch Claude Code and run:
/mcpSelect clickstack to complete the OAuth authentication flow. Once connected, Claude can use the same dashboard and workflow management tools described throughout this post.
The result is a single toolchain that evolves together. As new dashboard capabilities are built, they immediately become available through the MCP server, and thus also immediately become available both inside ClickStack and to external agents without requiring separate implementations.
Conclusion
AI dashboard generation makes ClickStack easier to get started with, but the goal was never just to make dashboards easier to build. It was to make investigations easier to perform. By treating dashboard creation as an investigation, every generated dashboard is backed by a complete history of the queries, reasoning, and decisions that produced it. That history remains editable, allowing users to refine, branch, and extend the investigation long after the initial dashboard has been generated.
We think dashboard generation is only the beginning. The more interesting problem is workflow generation. Engineers don’t solve problems with isolated dashboards. They solve them by moving through connected investigations. By combining AI Notebooks, dashboard actions, and the ClickStack MCP server, ClickStack can generate those workflows from a single prompt, and that capability will continue to expand as the platform and its ability to link visual components evolves.
Get started today
Interested in seeing how Managed ClickStack works on your observability data? Get started with Managed ClickStack in minutes and receive $300 in free credits.
Sign up