50.5k
50.5k
With no shortage of Postgres providers in 2026, one may be confused where to deploy the database powering their next app. One could of course look at dimensions like performance (we do pretty well there), pricing, and extension support. A dimension not as prevalent in the zeitgeist is reliability.
Database reliability has many facets. Postgres itself is stubbornly reliable. Hardware reliability is an interesting concern, but hyperscalers either offer or host every Postgres option we’re examining today. So on that front, every option here performs about as reliably as hardware can.
To me, a product is reliable when it holds up under workloads it shouldn't have to. While we stress test to shake out bugs in our Postgres offering, customers sometimes punish their database by accident because Postgres memory tuning isn't a solved problem, and the growing share of Postgres databases now provisioned and driven entirely by agents means the "by accident" route will only get busier.
The quicksand of memory management and query tuning
Postgres unfortunately does not have a setting that says "a query can only use X MB of RAM at most please". What it has is work_mem (default 4MB), a ceiling that applies per “operation”, not per query. Every query node in a plan that needs memory gets its own work_mem budget, and a plan can have several such nodes at once. Hash-based nodes get an additional budget multiplier on top from hash_mem_multiplier. The Postgres docs clearly state that actual memory use "could be many times the value of work_mem."
To demonstrate how tricky query tuning can be, let's consider a simple schema on a database with all default Postgres settings. Just two tables, powering a hypothetical LLM inference service:
CREATE TABLE wm_api_keys (
api_key_id uuid PRIMARY KEY,
tier smallint NOT NULL,
scopes text[] NOT NULL,
expires_at timestamptz,
created_at timestamptz NOT NULL
);
CREATE TABLE wm_api_calls (
call_id bigint PRIMARY KEY,
api_key_id uuid NOT NULL,
called_at timestamptz NOT NULL,
model_id smallint NOT NULL,
tokens integer NOT NULL,
cost_usd numeric(10,6) NOT NULL,
latency_ms integer NOT NULL
);Alongside the OLTP traffic from your API gateway, your customers frequently hit a console per-key drilldown view backed by a SELECT statement:
SELECT c.api_key_id,
sum(c.cost_usd) AS total_cost_usd,
sum(c.tokens) AS total_tokens,
count(*) AS n_calls,
max(c.called_at) AS last_active_at,
avg(c.latency_ms)::int AS avg_latency_ms
FROM wm_api_calls c JOIN wm_api_keys k USING (api_key_id)
WHERE k.tier IN (0, 1, 2)
GROUP BY c.api_key_id
ORDER BY total_cost_usd DESC;A bit after you launch you have 2000 API keys (congrats!) and they've made a total of 30,000 calls so far. The plan from EXPLAIN (ANALYZE, BUFFERS, VERBOSE) is unremarkable; the relevant lines:
Sort
Sort Method: quicksort Memory: 87kB
-> HashAggregate
Batches: 1 Memory Usage: 689kB
-> Hash Join
-> Seq Scan on wm_api_calls c
-> Hash
Buckets: 2048 Batches: 1 Memory Usage: 68kBThree nodes consume memory: the Hash (build side, 68 kB), the HashAggregate (689 kB), and the Sort (87 kB). These sum up to around 0.8 MB, comfortably below the default work_mem threshold.
A note on memory accounting: when we say "total memory" in this section we mean the sum of each memory-using node's peak. Postgres usually holds a node's memory until the end of the query, so we judge this a close-enough approximation.
A few months later, your product has officially gone viral. You now have 55,000 API keys and 9 million API calls. The console page that runs this query has started to feel heavier, so you check the plan:
Sort
Sort Method: quicksort Memory: 2926kB
-> Finalize GroupAggregate
-> Gather Merge
Workers Planned: 2
Workers Launched: 2
-> Sort (loops=3)
Sort Method: external merge Disk: 4256kB
Worker 0: external merge Disk: 4256kB
Worker 1: external merge Disk: 4248kB
-> Partial HashAggregate (loops=3)
Batches: 5 Memory Usage: 8241kB Disk Usage: 3408kB
Worker 0: Batches: 5 Memory Usage: 8241kB Disk Usage: 3400kB
Worker 1: Batches: 5 Memory Usage: 8241kB Disk Usage: 3392kB
-> Hash Join
-> Parallel Seq Scan on wm_api_calls c
-> Hash
Buckets: 32768 Batches: 1 Memory Usage: 1671kBTwo things changed just from having more data to process. wm_api_calls is over a gigabyte on disk now, way past the min_parallel_table_scan_size (8 MB default), and the planner pulled in two background workers to speed up query execution. Three processes now run the partial subtree below the Gather Merge: the two workers plus the leader, which by default also acts as a worker. Each process builds its own copy of every node below the Gather Merge, including the join's Hash (1671 kB × 3 processes = 5 MB total). The takeaway here is that each worker has its own memory-using nodes and they have their own memory budget. So adding parallel workers has added an opaque ~3x multiple to our memory usage.
Second, spilling. The Partial HashAggregate shows Memory Usage: 8241kB Disk Usage: 3408kB in each worker. The per-worker Sort says external merge Disk: 4256kB. Two memory-using nodes per process, both writing to temporary files because they've hit the node cap enforced by work_mem. The default work_mem in Postgres is 4 MB. But hash-flavored nodes get work_mem * hash_mem_multiplier (default 2.0) before they spill, so the Partial HashAggregate's cap is 8 MB. The HashAggregate would naturally use ~14 MB per worker if uncapped, which doesn't fit in 8 MB, so partitions to disk in 5 batches, instead. The Sort wants ~5 MB, which doesn't fit in 4 MB, so goes to external merge.
Adding it up across the three processes:
- RAM:
3 × (8.2 MB Partial HashAgg + 1.7 MB Hash) + 2.9 MB outer Sort ≈ 33 MB - Disk:
3 × (3.4 MB HashAgg partitions + 4.3 MB Sort) ≈ 23 MB
We're using more than 8x work_mem for this relatively simple query and also incurring 23 MB of disk I/O on every console page load. The first-order fix for the Disk Usage and external merge markers in EXPLAIN is to raise work_mem past each node's working set.
An increase to 8 MB eliminates the spilling at the cost of using 8.5× that amount (~68MB) across the parallel processes running the query, due to the combination of tunable factors. The Planner picked workers + 1 from the wm_api_calls table size and the number of memory-using nodes from the query and the data, but hash_mem_multiplier is a per-node modifier, not a query-wide cap. There's only work_mem, applied per node, per process, with a multiplier on hash-flavoured nodes.
If every memory-hungry query respected this model, the article could end here. It doesn't.
Not everything spills
Some executor memory allocations sit outside this tidy work_mem model. It is not just a question of setting the knob too high or forgetting that parallel workers multiply it, but that some structures have no useful disk-backed fallback at all, so they can keep growing until the query finishes or the backend runs out of memory.
Spilling arbitrary executor state is complex, messy, and absolutely obliterates performance if done badly. Postgres has invested a lot of work into spilling where the tradeoff makes sense, but it deliberately keeps some structures in memory. What this means in practice is that it is possible to run queries that don't respect memory tuning parameters under pathological conditions. The query that forms our test workload exhibits this pattern, and it's worth digging into further.
Consider representing directed graphs in Postgres. The simplest pattern would be an edges table like so:
CREATE TABLE edges (
src bigint NOT NULL,
dst bigint NOT NULL,
PRIMARY KEY (src, dst)
);To find all nodes reachable from node 0, you'd write a recursive CTE. Because the graph may have cycles, the recursion needs UNION (not UNION ALL) to terminate, otherwise it would revisit nodes forever. The use of UNION triggers the creation of a hashtable in the executor for deduplicating rows. The hashtable holds an entry for every reachable node, for the entire query's lifetime, in a memory context that doesn't honour work_mem to spill to disk.
WITH RECURSIVE walk(n) AS (
SELECT 0::bigint
UNION
SELECT e.dst
FROM walk
JOIN edges e ON e.src = walk.n
)
SELECT n
FROM walk;The hashtable is built by a function BuildTupleHashTable that itself has no logic to spill to disk. The same function backs the HashAggregate we used in the GROUP BY example earlier in this post. So why does that hash table spill cleanly and this one doesn't? It boils down to the hashtable’s purpose.
In HashAggregate, the hashtable is a one-shot accumulator: it ends when input ends. That defined end lets Postgres monitor the table's size and, once it crosses work_mem * hash_mem_multiplier, start routing new-group tuples to disk instead of letting the in-memory table grow further. When input drains, Postgres reads back each on-disk partition and aggregates it in isolation.
In WITH RECURSIVE … UNION, the hashtable needs a deduplication set for the entire query. Every candidate row from every iteration has to be checked against every key seen so far. Sending part of the table to disk would mean reading it back on every membership check, which is catastrophic for throughput. So the table stays in memory for the query's lifetime, until the reachable set is fully materialised.
Benchmarking
We tested 4 Postgres providers under a workload that heavily stresses memory usage. The criterion is that a database should be able to handle as much load as possible and shed the rest cleanly without crashing.
We ran the cyclic-graph recursive UNION query from above over a graph of ~12.6 million nodes, consuming ~1 GiB of RAM from the deduplication hashtable. It generates the edges on the fly using a CROSS JOIN, eliminating variance due to storage and cache performance. From each node, the query creates two outgoing edges: one to the next node, and one 251 positions ahead. The "next node" edge ensures every node is reachable from zero. The second edge gives most nodes multiple incoming paths, so the UNION must reject duplicates on every iteration, and it shortens the recursion from millions of steps to tens of thousands.
WITH RECURSIVE walk(n) AS (
SELECT 0
UNION
SELECT (walk.n + step.s) % 12600000
FROM walk
CROSS JOIN (VALUES (1), (251)) AS step(s)
)
SELECT n FROM walk;A note on memory accounting: Postgres also materialized the CTE output into a tuplestore that honours work_mem and spills the excess to temp files (around ~200 MB for this graph), which creates some I/O pressure across multiple backends but at a rate less than the memory pressure exerted at the same time.
The providers under test are:
- ClickHouse Managed Postgres [r8gd.large, AWS us-west-2, 118GB local SSD, Postgres 18.6]
- Google Cloud SQL [db-c4a-highmem-2, us-west1, 118GB Hyperdisk Balanced, Postgres 18.6]
- PlanetScale Postgres [r8gd.large, AWS us-west-2, 118GB local SSD, Postgres 18.6]
- Amazon RDS [db.r8g.large, us-west-2, 118GB gp3, Postgres 18.6]
ClickHouse Managed Postgres and PlanetScale both use locally attached SSDs and were therefore set up with synchronous HA (2 standbys) to match the durability guarantees of the others.
For each provider, we opened n concurrent connections running the same query, with n ranging from 7 to 23. We repeated this 10 times at each value of n, with a 60-second cooldown between runs, and sampled per-connection memory usage throughout. Each connection sets a 120-second statement_timeout: a single query normally finishes in under 5 seconds, so anything past two minutes counts as a failure. We also recorded a failure for any connection that returned an error or was terminated. A run in which every connected client lost its session at once was classified as a full outage. The test driver was a single Amazon EC2 instance in the same region as all clusters.
Results
There are three failure modes here: query failure, session failure, and cluster failure. The good thing that Postgres can do is when the allocator sees the failure and the caller checks: a log entry with SQLSTATE 53200 (out_of_memory), the failing transaction rolls back, the connection stays open, the pool keeps that slot, and the next query on that connection works. The other backends and any other clients on the cluster don't even notice. ClickHouse Managed Postgres is the only provider tested that does this. We disable memory overcommit in the kernel and cap committed memory. When a backend asks for more than the overall limit, the allocation fails. Postgres catches this and responds with a SQL ERROR rather than crashing.
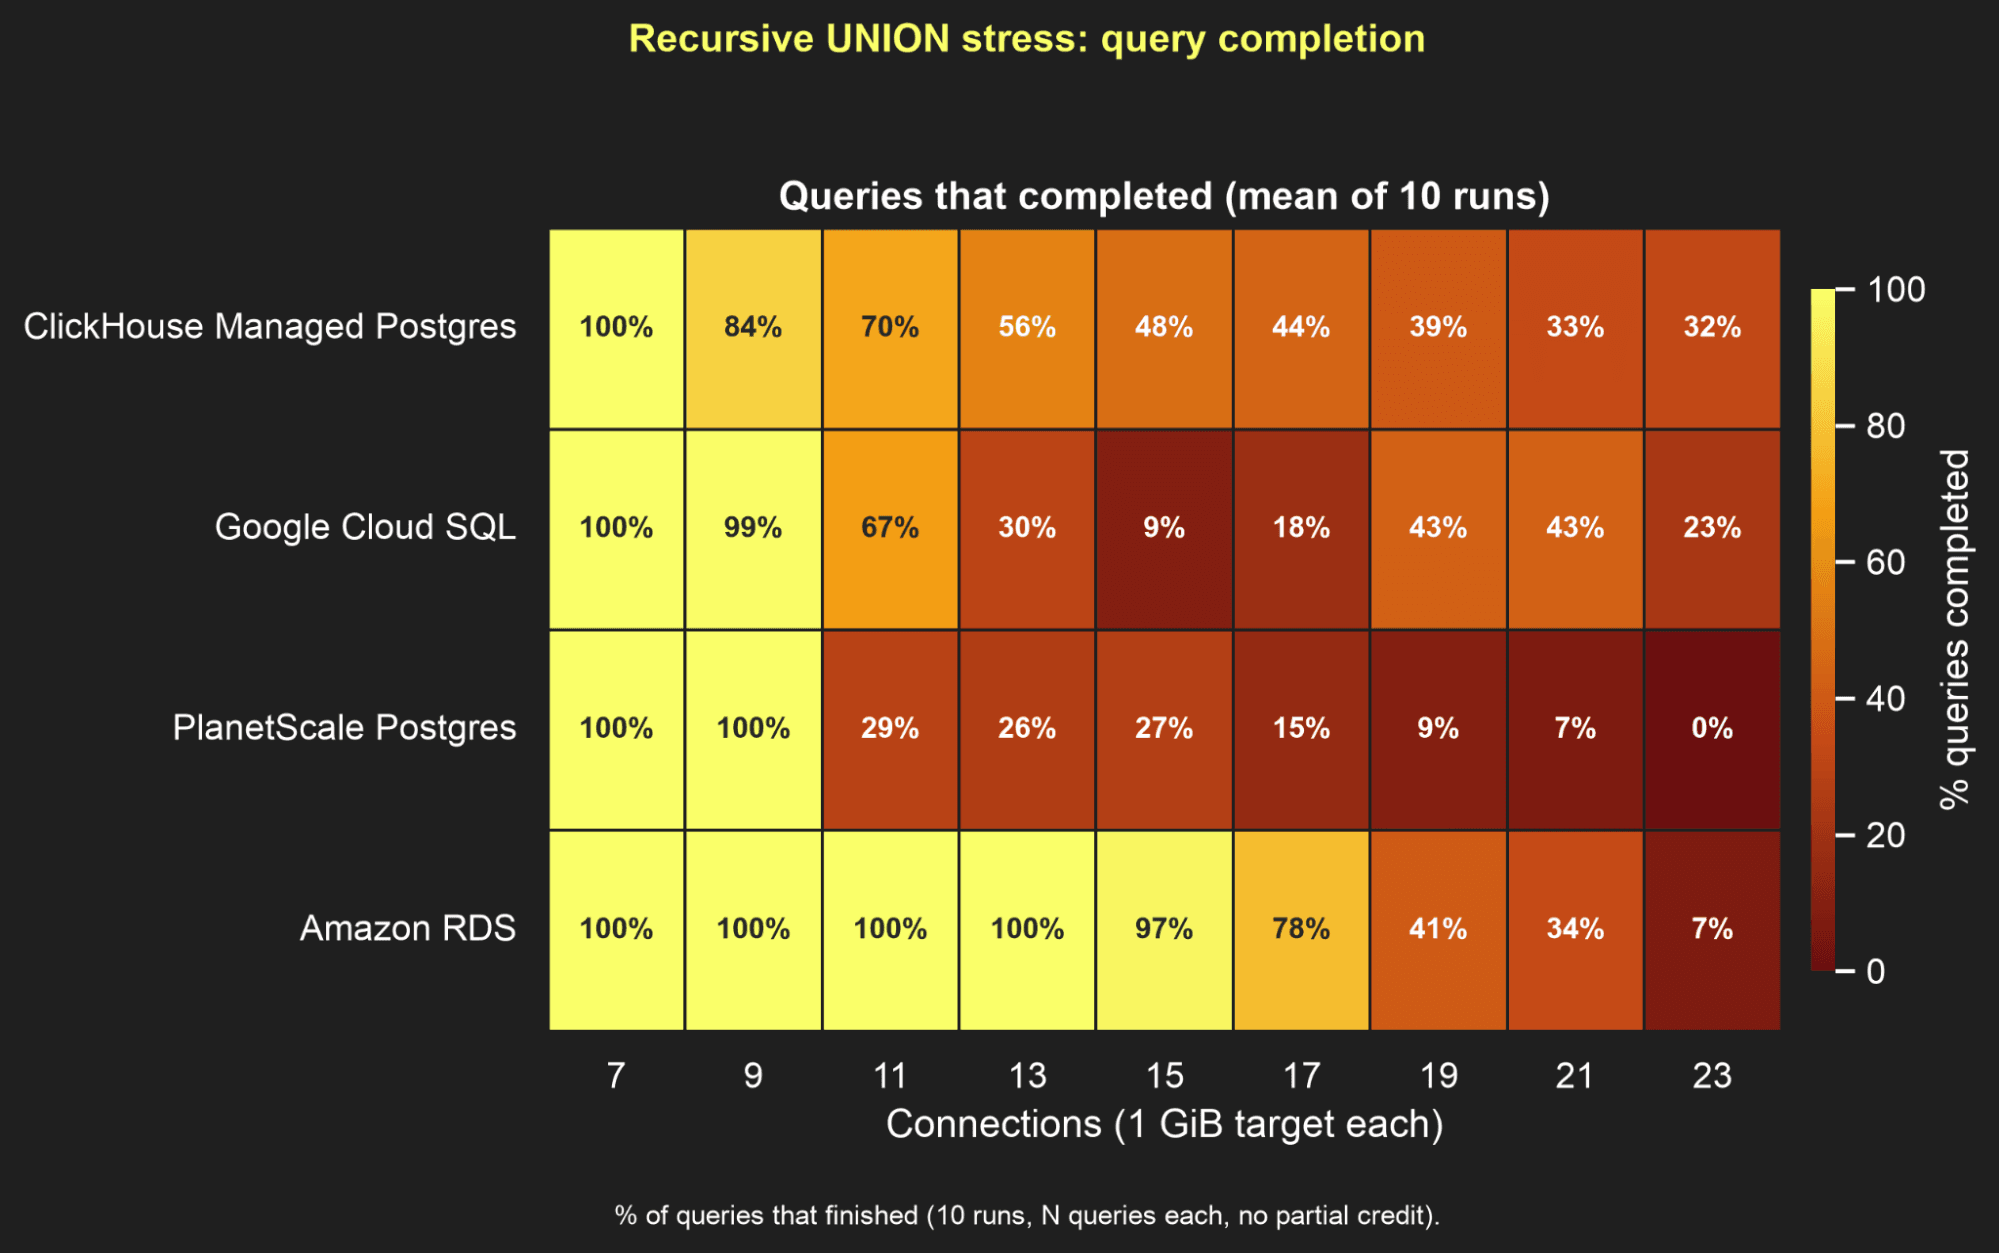
When nothing catches the memory pressure in time, the Linux OOM killer fires and picks a backend to SIGKILL. Postgres treats this abnormal exit as potential shared memory corruption and restarts the whole cluster into crash recovery, which results in several minutes of unavailability on a busy system. RDS exhibits this pattern and starts entering crash recovery at 19 connections, when the workload needs way more memory than the cluster has, though a handful of connections occasionally finish their workload before the crash. Before that point, RDS doesn't stop any queries itself, but some queries exceed the 120-second statement_timeout at 15 and 17 connections and error out. This is a sign of thrashing under heavy memory pressure, but we couldn't confirm this theory.
Cloud SQL and PlanetScale take a different approach and run supervisors that watch memory pressure and kill queries before the OOM killer kicks in. The client sees FATAL: terminating connection due to administrator command, which is less polite than an ERROR because the connection itself dies without explanation, but the postmaster remains up and the cluster still serves requests. This isn’t a perfect solution. At 11+ connections, most PlanetScale runs end in a crash. Cloud SQL copes better under heavy load but is more unstable at moderate load. Cloud SQL also occasionally took minutes to recover, causing some future runs to not start and error out prematurely.
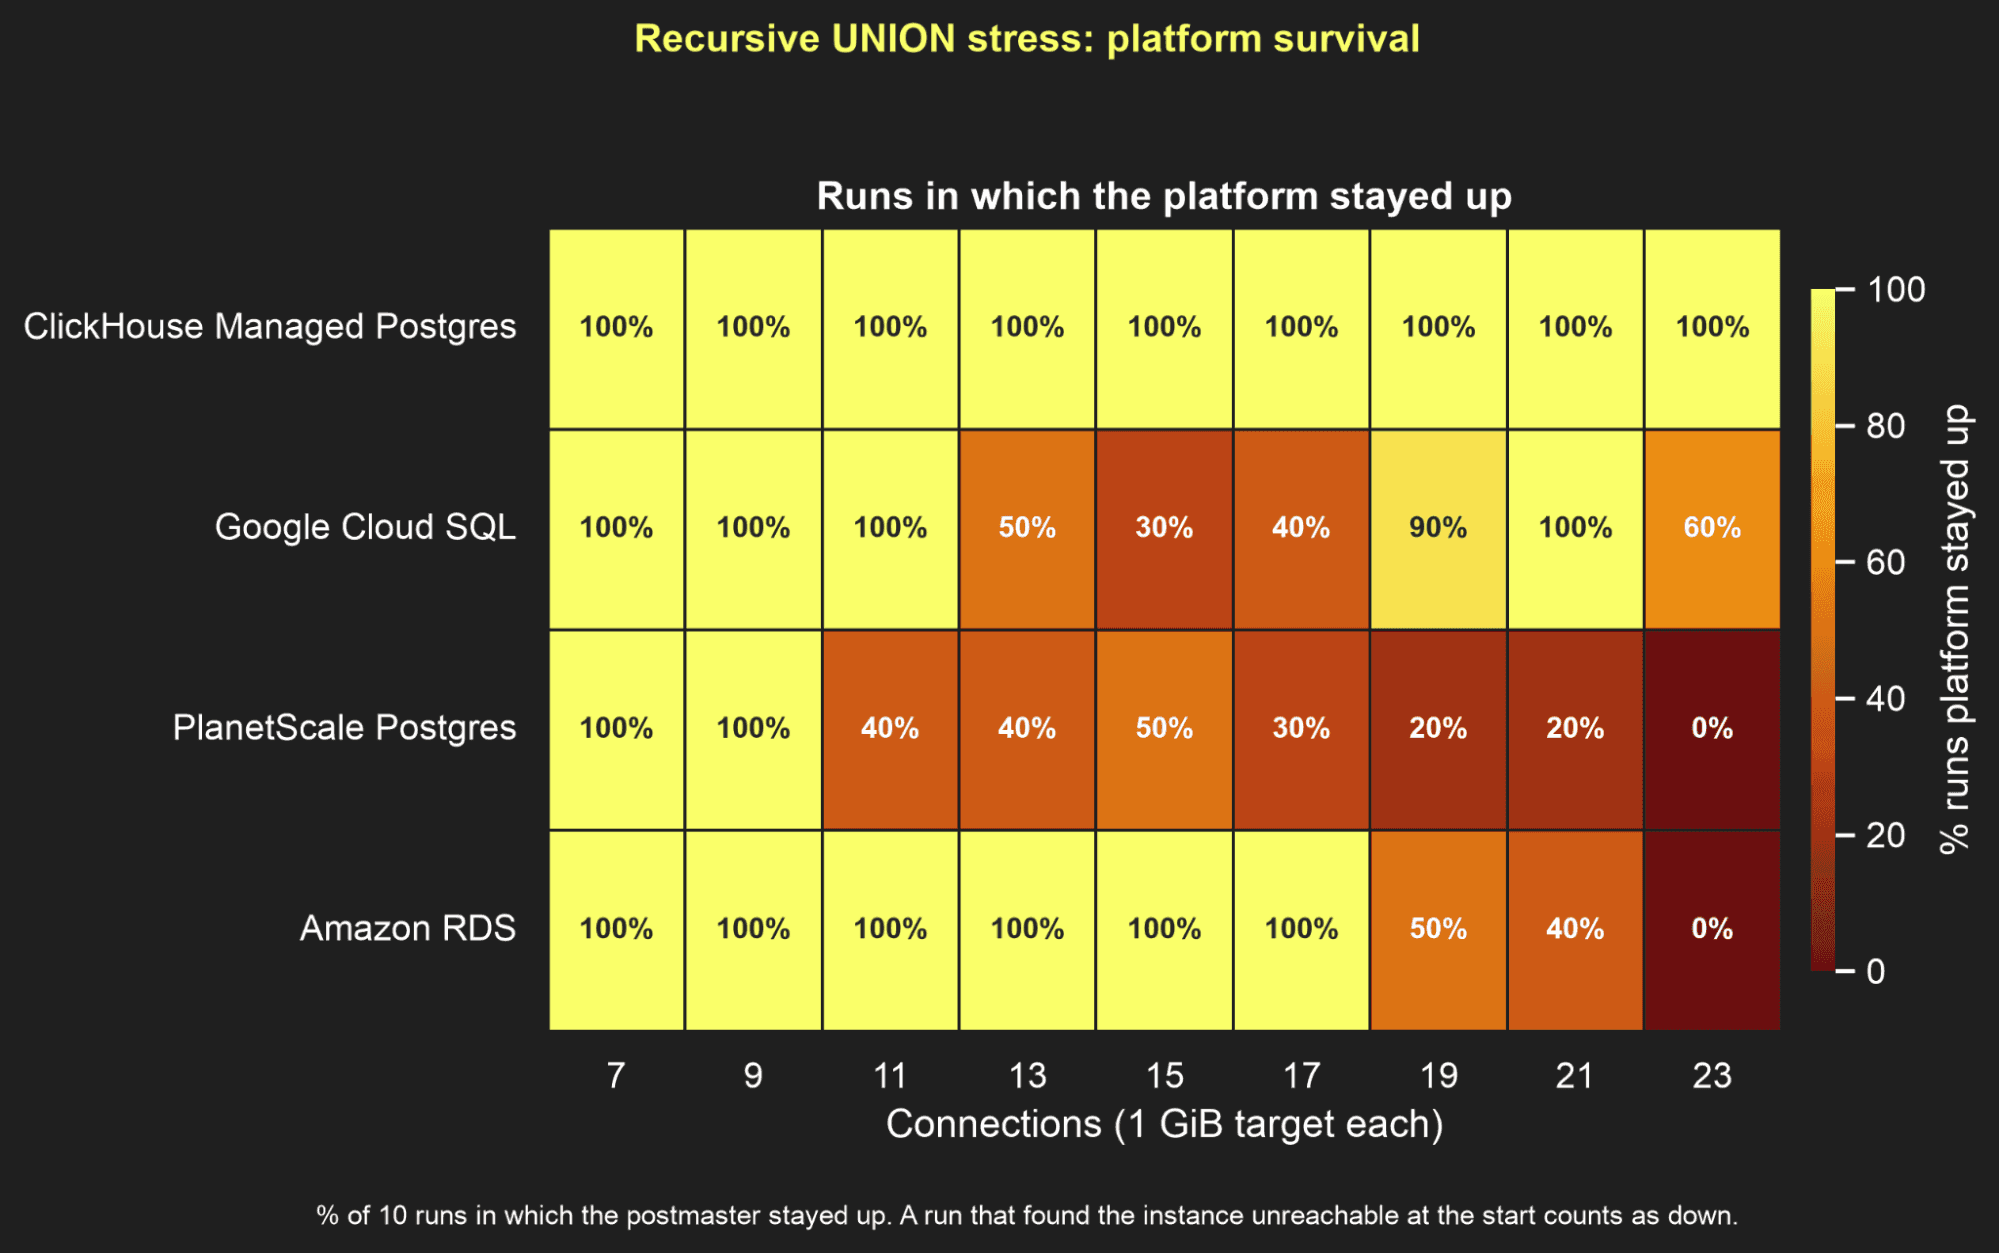
These two heatmaps tell different stories about each corresponding table cell. The first shows the fraction of individual queries that finished their query; the second the fraction of runs in which the cluster itself stayed up. At 23 connections, ClickHouse Managed Postgres had 32% query completion but 100% cluster survival: the memory cap stopped ~70% of queries with an ERROR, but the cluster remained healthy throughout. RDS at 23 connections had 7% query completion and 0% cluster survival: the postmaster crashed in every run, and a handful of lucky connections finished their query right before the host gave up.
In this benchmark, ClickHouse Managed Postgres kept the cluster running at every tested connection count by stopping runaway queries before the host was exhausted. Its configuration comes with a tradeoff: Postgres backends do not get to consume as much of host RAM as they do on providers that allow the workload to run closer to the edge. The next heatmap shows that tradeoff directly. Memory allocation on ClickHouse Managed Postgres plateaus at 57% of host RAM, or about 9 GiB on these 16 GiB instances. Cloud SQL and PlanetScale enforce similar memory caps while RDS allows backend memory to climb much higher before failure.
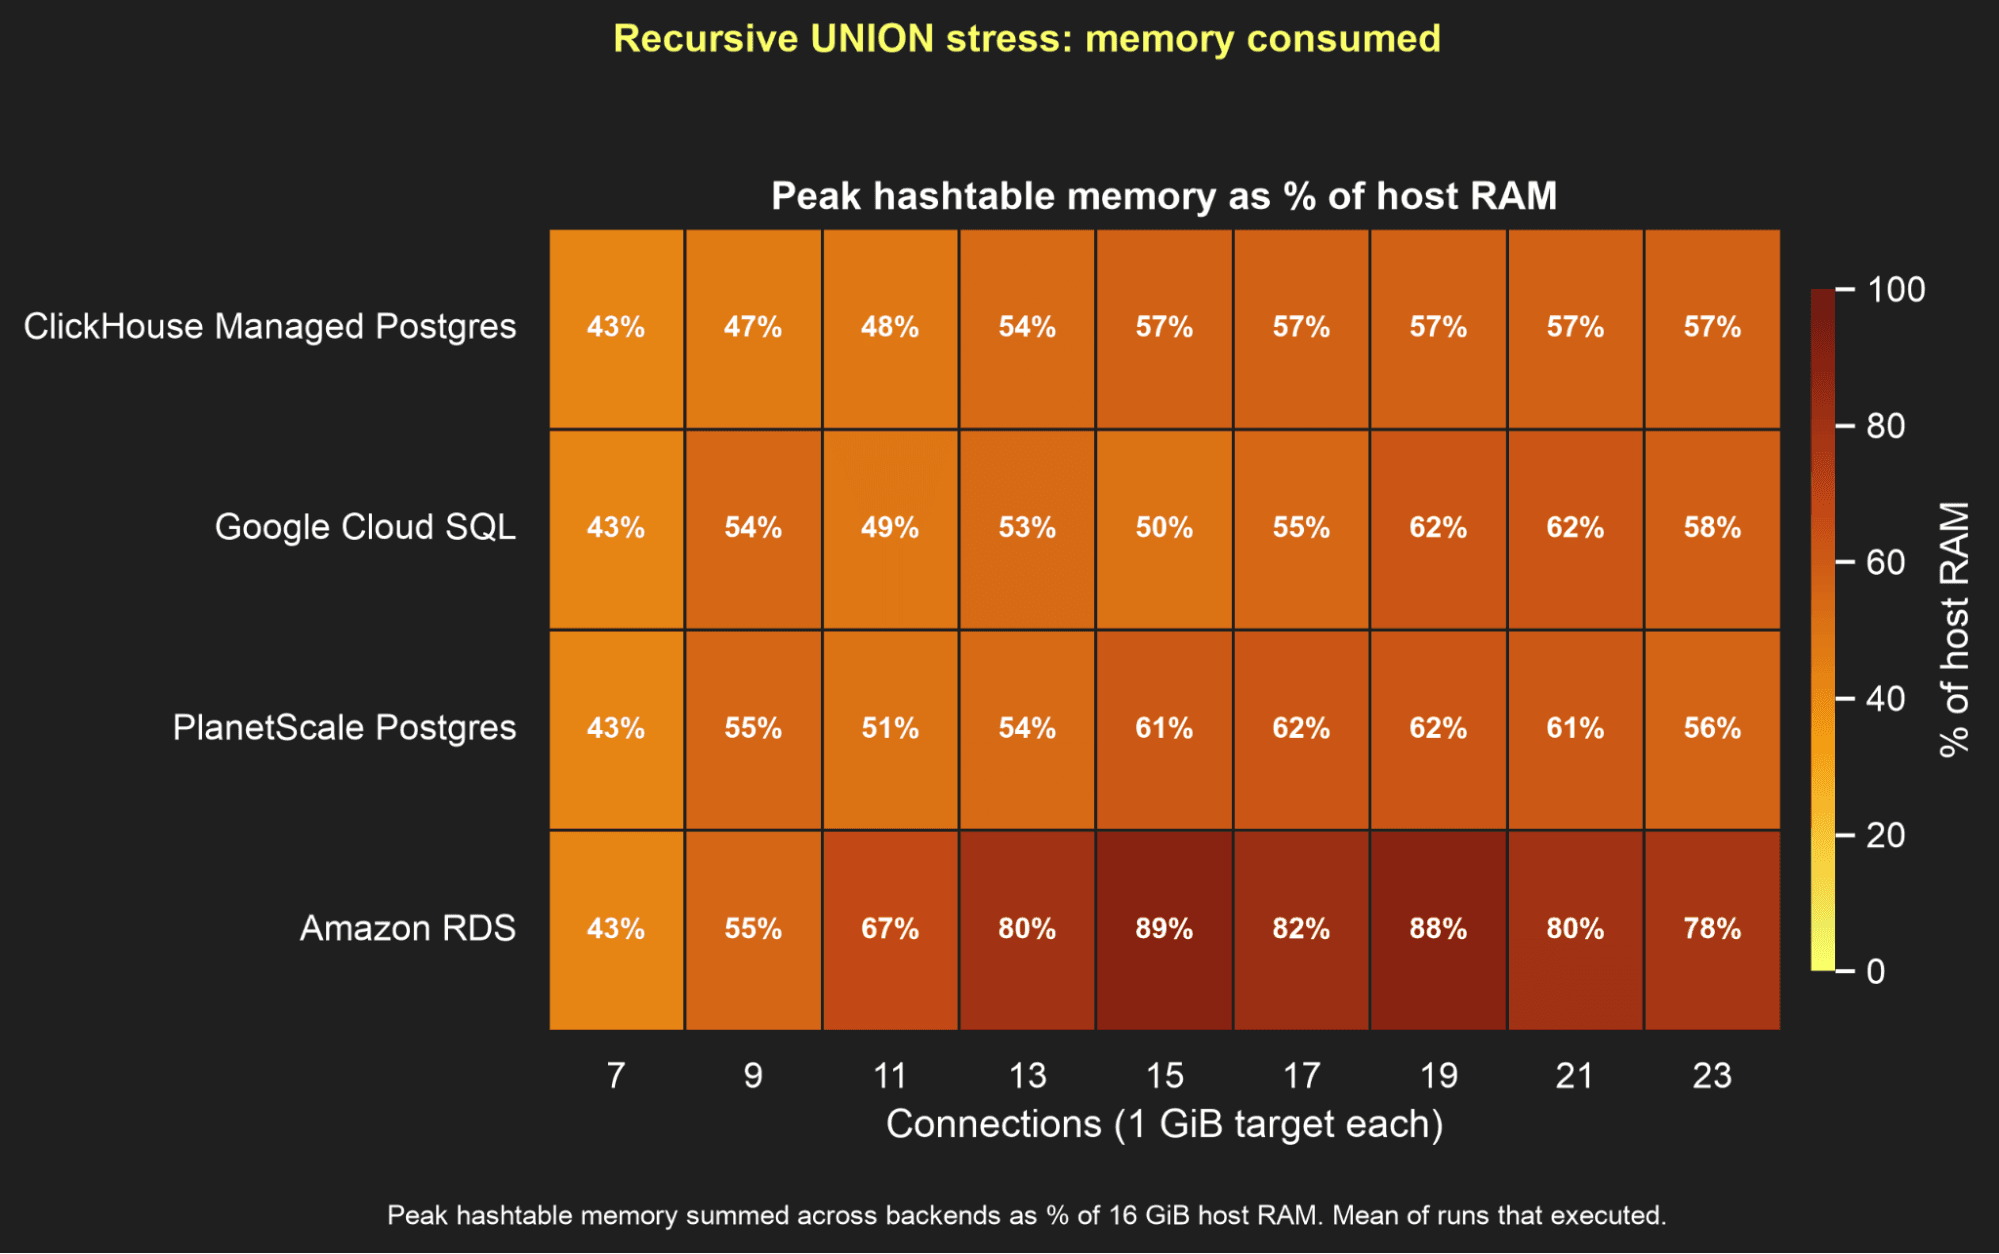
This may seem like a waste of memory, but it is well understood that Postgres performance heavily hinges on caching, both via Postgres shared_buffers and the OS page cache. ClickHouse Managed Postgres carves out dedicated memory for both caches, with 4GB (25%) fully allocated to Postgres shared_buffers by default and a smaller reserve for the Linux kernel overhead, which includes the page cache.
ClickHouse Managed Postgres does limit memory-heavy workloads more than RDS, which takes a more laissez-faire approach. This is why RDS completes more queries than ClickHouse Managed Postgres at moderate load: our cap starts rejecting queries at 9 connections, where the workload reaches it, while RDS keeps accepting them until the host gives out. But RDS's approach costs more than crashes: with no protection against runaway memory consumption, backends may compete with caches and slow everything down.
Conclusion
Our lower memory ceiling is a deliberate tradeoff in favor of uptime, and which approach is better depends on what you want the service to optimize for. Letting backends consume nearly all available RAM can be useful when you fully control the workload and accept that a bad plan or pathological query may take the instance down. Enforcing a lower ceiling leaves some memory unused in the best case, but lets the system fail individual queries instead of the whole database. We would rather return a clean query failure under runaway executor memory than let the postmaster disappear and force every client through crash recovery.
We’re investing in ways to further stabilize the memory profiles of Postgres and our ancillary components running on each VM, with the hopes of giving more memory to user queries in the future.
Get started with ClickHouse Managed Postgres today
Interested in seeing how ClickHouse Managed Postgres works on your data? Get started with ClickHouse Cloud in minutes and receive $300 in free credits.
Sign up