50.4k
50.4k
TL;DR
Managed ClickStack now supports statistical anomaly detection on query-builder charts, scales alerting to support even larger workloads, and provides better tools to visualize and manage alerts. These improvements help teams move more of their alerting workloads from tools such as Grafana into ClickStack.
Introduction
In May, we introduced SQL charting and alerting in response to customers who needed more complex alert conditions. Users could express these in arbitrary ClickHouse SQL, including checks for spikes in errors relative to a rolling baseline. That flexibility also meant writing and maintaining the SQL to calculate baselines and decide when alerts should fire.
Many of these requirements came down to detecting unusual values compared with recent history. Users wanted to apply those checks to existing query-builder visualizations, so we've added built-in anomaly detection to Managed ClickStack using z-scores. Users can adjust the sensitivity and preview how often an alert would have notified over the previous day. We've paid particular attention to avoiding false positives from small fluctuations in otherwise stable metrics.
Teams adopting Managed ClickStack, including those migrating from Grafana, also brought tens of thousands of existing alerts. We’ve improved the scheduler and introduced sharding to distribute evaluation across multiple workers to handle alerting workloads at scale.
To make those larger collections practical to manage, we've also improved search and filtering in the alerts UI, added charts showing alert activity, and expanded evaluation histories to help users investigate why an alert fired or failed.
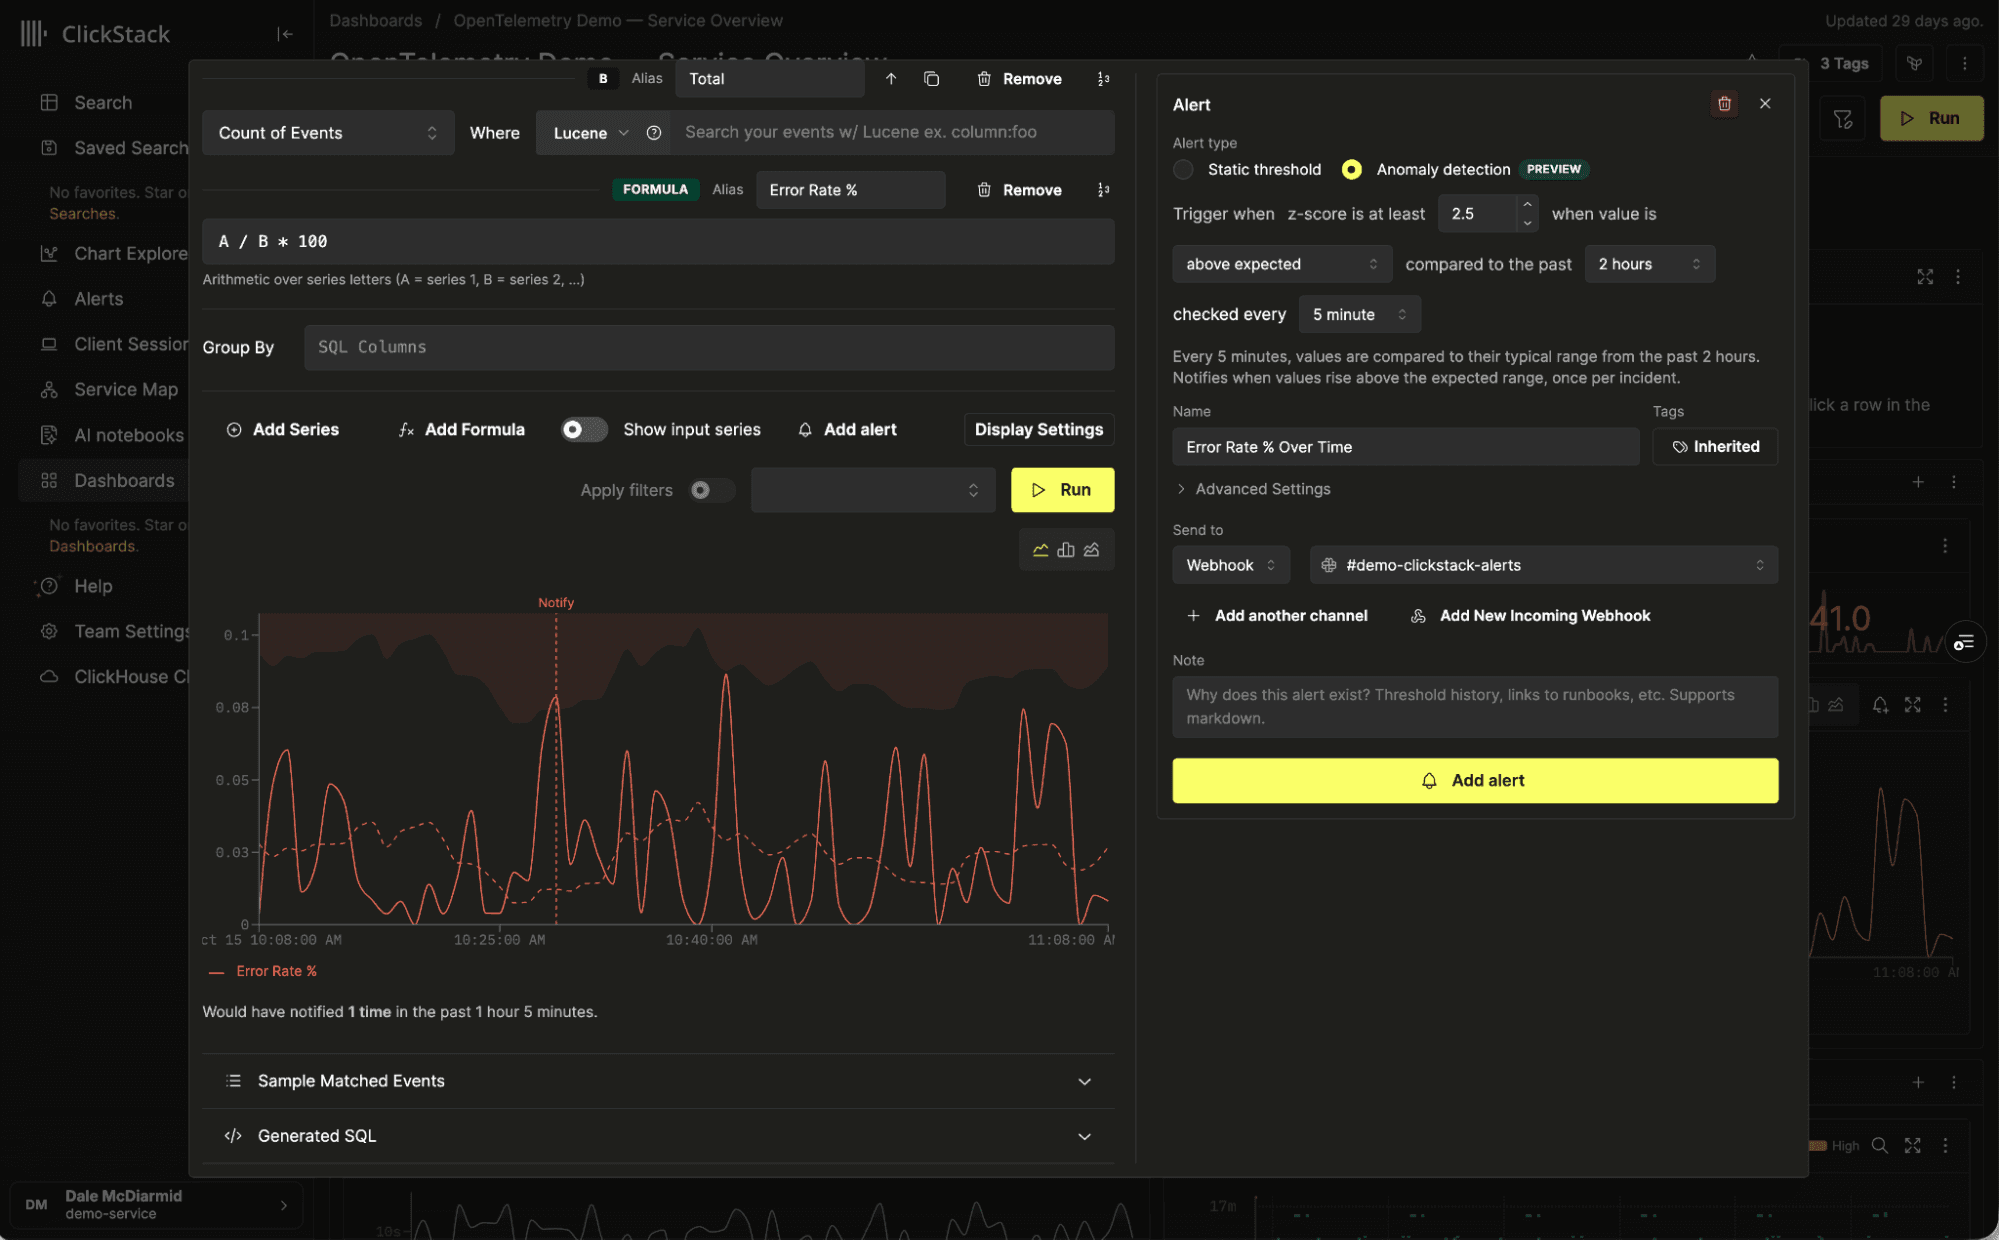
In this post, we'll explore these changes and how they support teams moving more of their alerting workloads into Managed ClickStack.
Anomaly detection on the charts you already use
ClickStack has supported static threshold alerts for some time. These work well when there's a clear limit you want to enforce. They become harder to configure when you're looking for a change in behavior, particularly across services whose normal operating ranges differ.
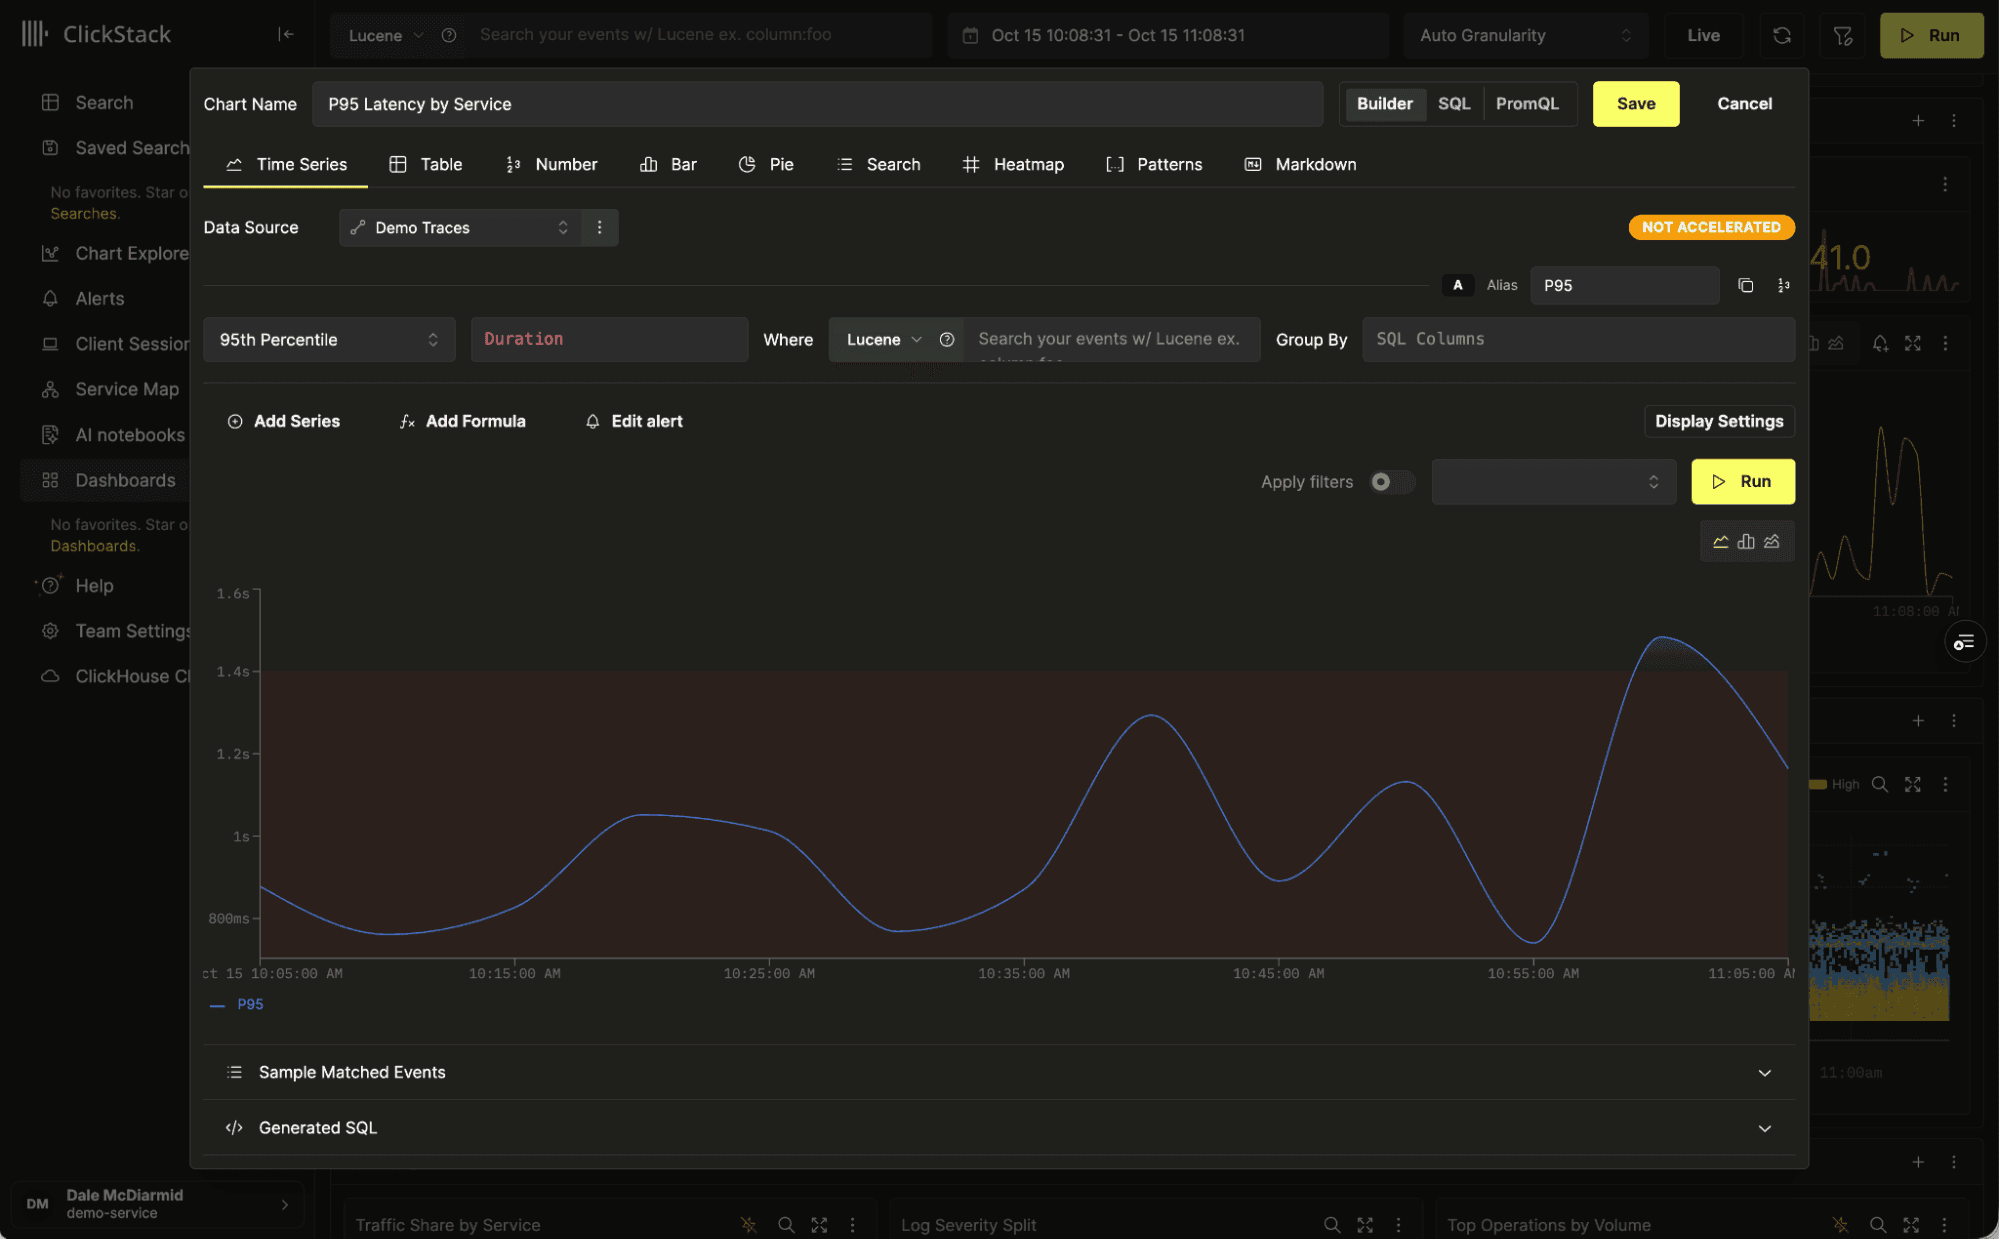
For example, take a service whose error rate usually sits around 0.1%. An increase to 0.9% is a substantial change, but a static alert set at 1% would remain quiet. Lowering that threshold might work for this service, although another service with a higher background error rate would need a different setting.
Comparing each service with its own history gives us a way to detect these changes without maintaining a separate threshold for each one. Our initial implementation of anomaly detection uses z-scores, a common statistical approach for comparing a value with its recent history. This allows each service to be evaluated against its own baseline, although deciding how to calculate that baseline has some subtleties.
The z-score measures how far a value is from its baseline mean, expressed in standard deviations. Its sensitivity therefore depends on how much the metric normally varies: a change that is unusual for a stable service might be routine for a noisy one. This creates a challenge for alerting, because a statistically unusual change isn't always large enough to warrant attention.
We encountered this during development. Our first attempt estimated both the baseline mean and the standard deviation from a short period immediately before the evaluation window. When we tested it on a memory metric that barely moved, the standard deviation was close to zero. Even tiny fluctuations then produced high z-scores and repeatedly triggered the detector, despite little meaningful change in memory usage.
We address this by calculating the expected value and the standard deviation over different periods. The expected value comes from a moving average of seven historical one-minute buckets, taken one evaluation interval earlier. We calculate the standard deviation over a longer baseline - two hours by default. The short average establishes the level we're comparing against, while the longer history tells us how much variation is normal. We then divide the difference between the observed and expected values by that standard deviation to calculate the z-score.
We also require a change of at least 5% relative to the expected value. This prevents tiny movements in stable metrics from generating alerts simply because they produce a large z-score. For our error-rate example, the increase from 0.1% to 0.9% easily meets that requirement, even though it is less than one percentage point.
We also found that incomplete data could look like an anomaly. Collectors often batch their sends, so evaluating a minute immediately after it ends can make a steady stream appear to have dropped. Anomaly evaluation, as a result, allows 30 seconds for data to arrive before checking the window.
Configuring anomaly detection
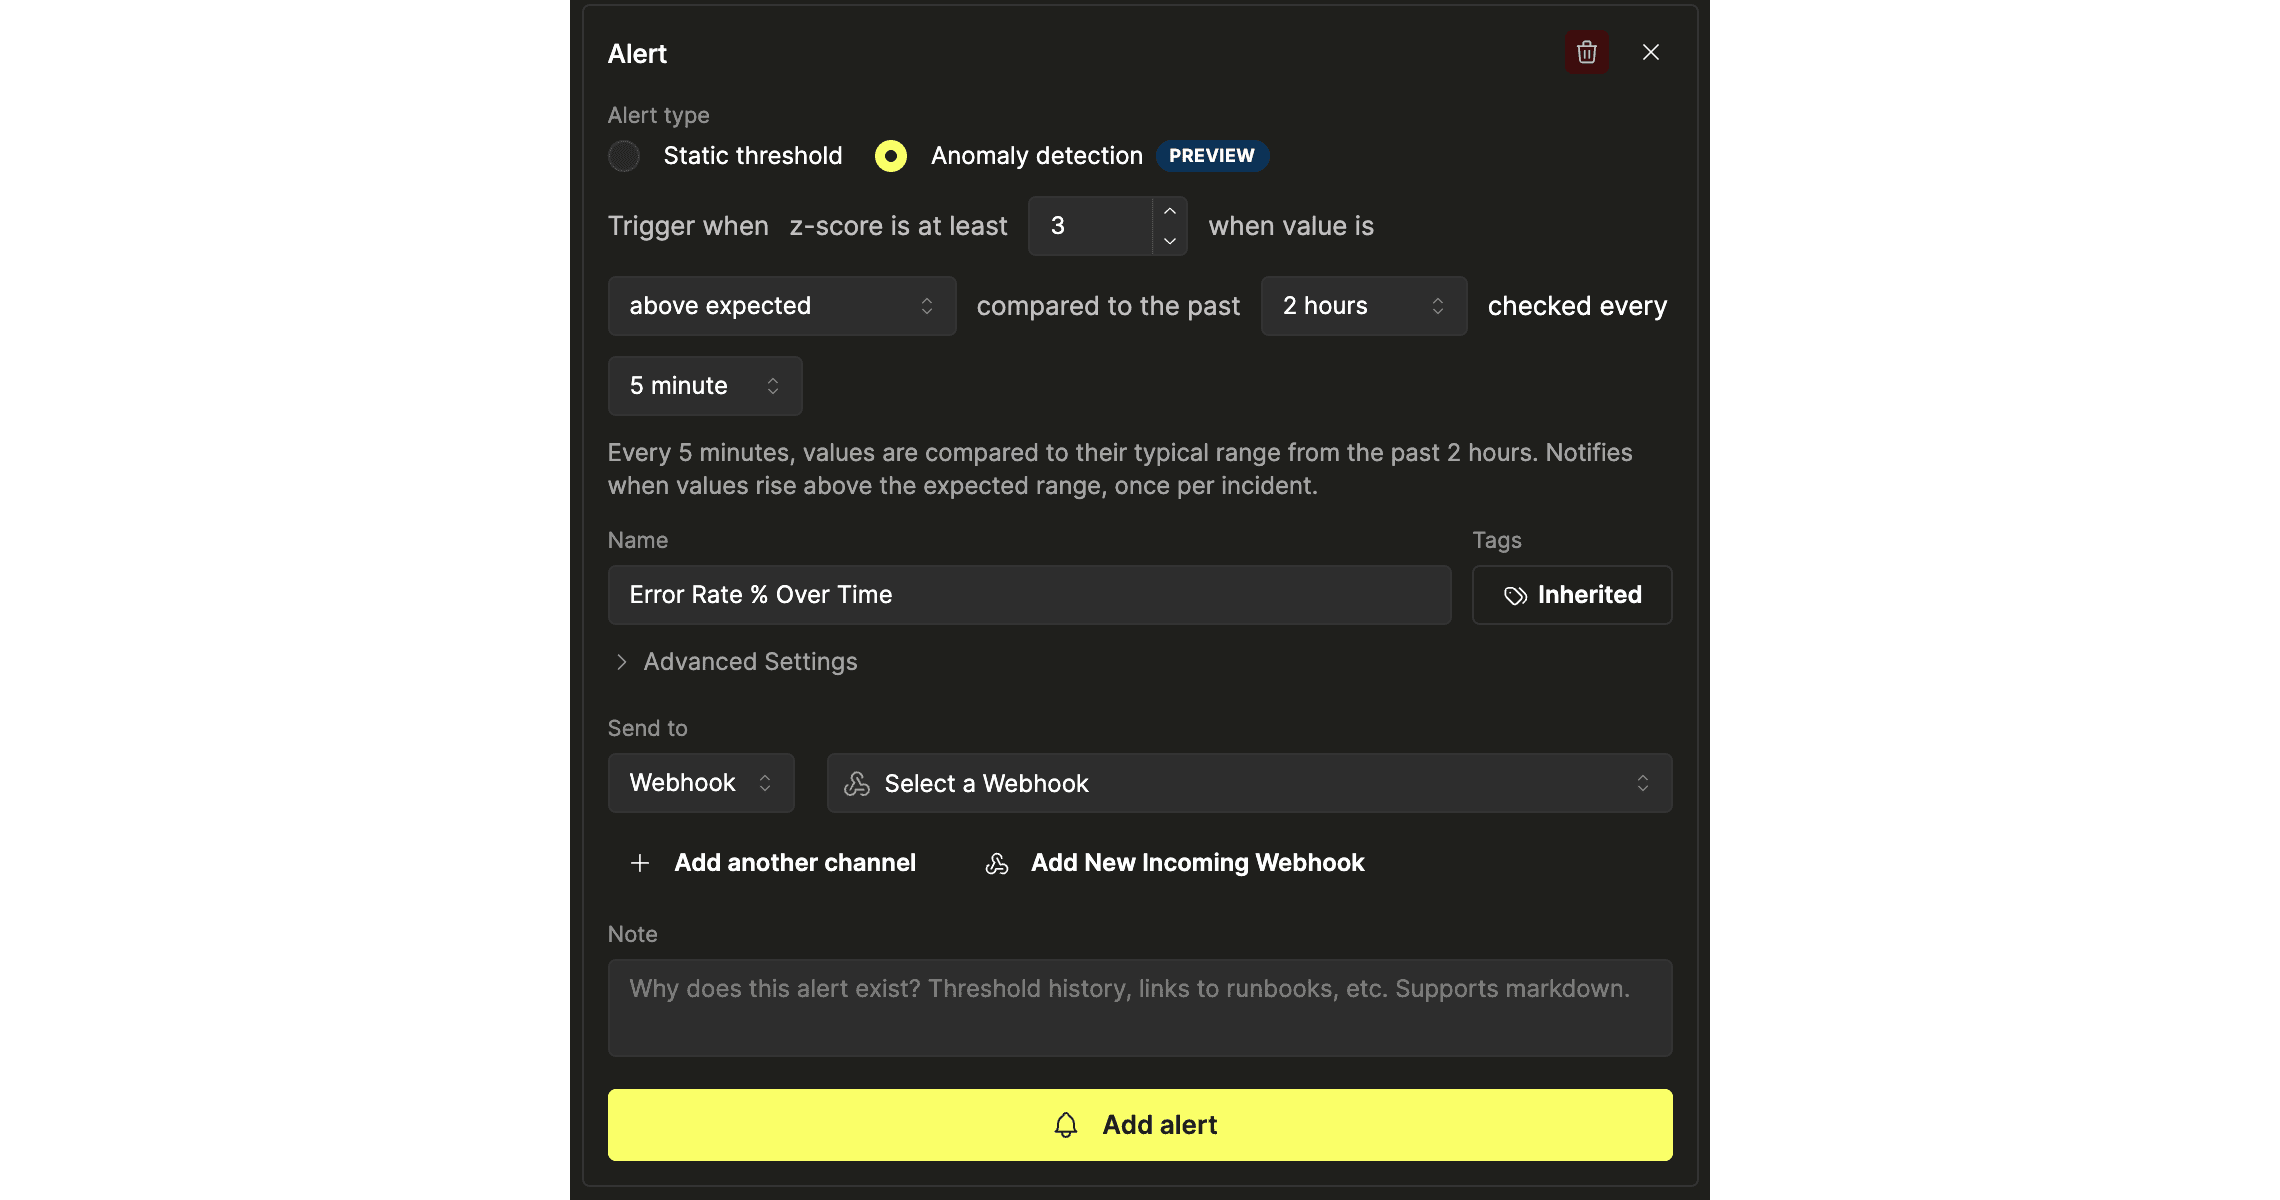
You can configure an anomaly alert directly from an existing query-builder chart by changing the alert type to Anomaly detection. Alongside the sensitivity, you choose how much history to use as the baseline and which direction of change should trigger an alert. The defaults are a z-score threshold of 3 and a two-hour baseline.
For the error-rate example, you’d select Above the expected range, since we're interested in an unusual increase in errors. A throughput alert could use Below the expected range to detect an unexpected drop in requests. If changes in either direction warrant investigation, choose Outside the expected range. This would suit a request-volume alert where both a sudden surge and a sudden drop could indicate a problem.
In each case, the expected range is calculated using the metric's recent history and the configured sensitivity. If the chart groups values by service, each service is evaluated independently against its own history, so services with different traffic levels can share the same alert configuration.
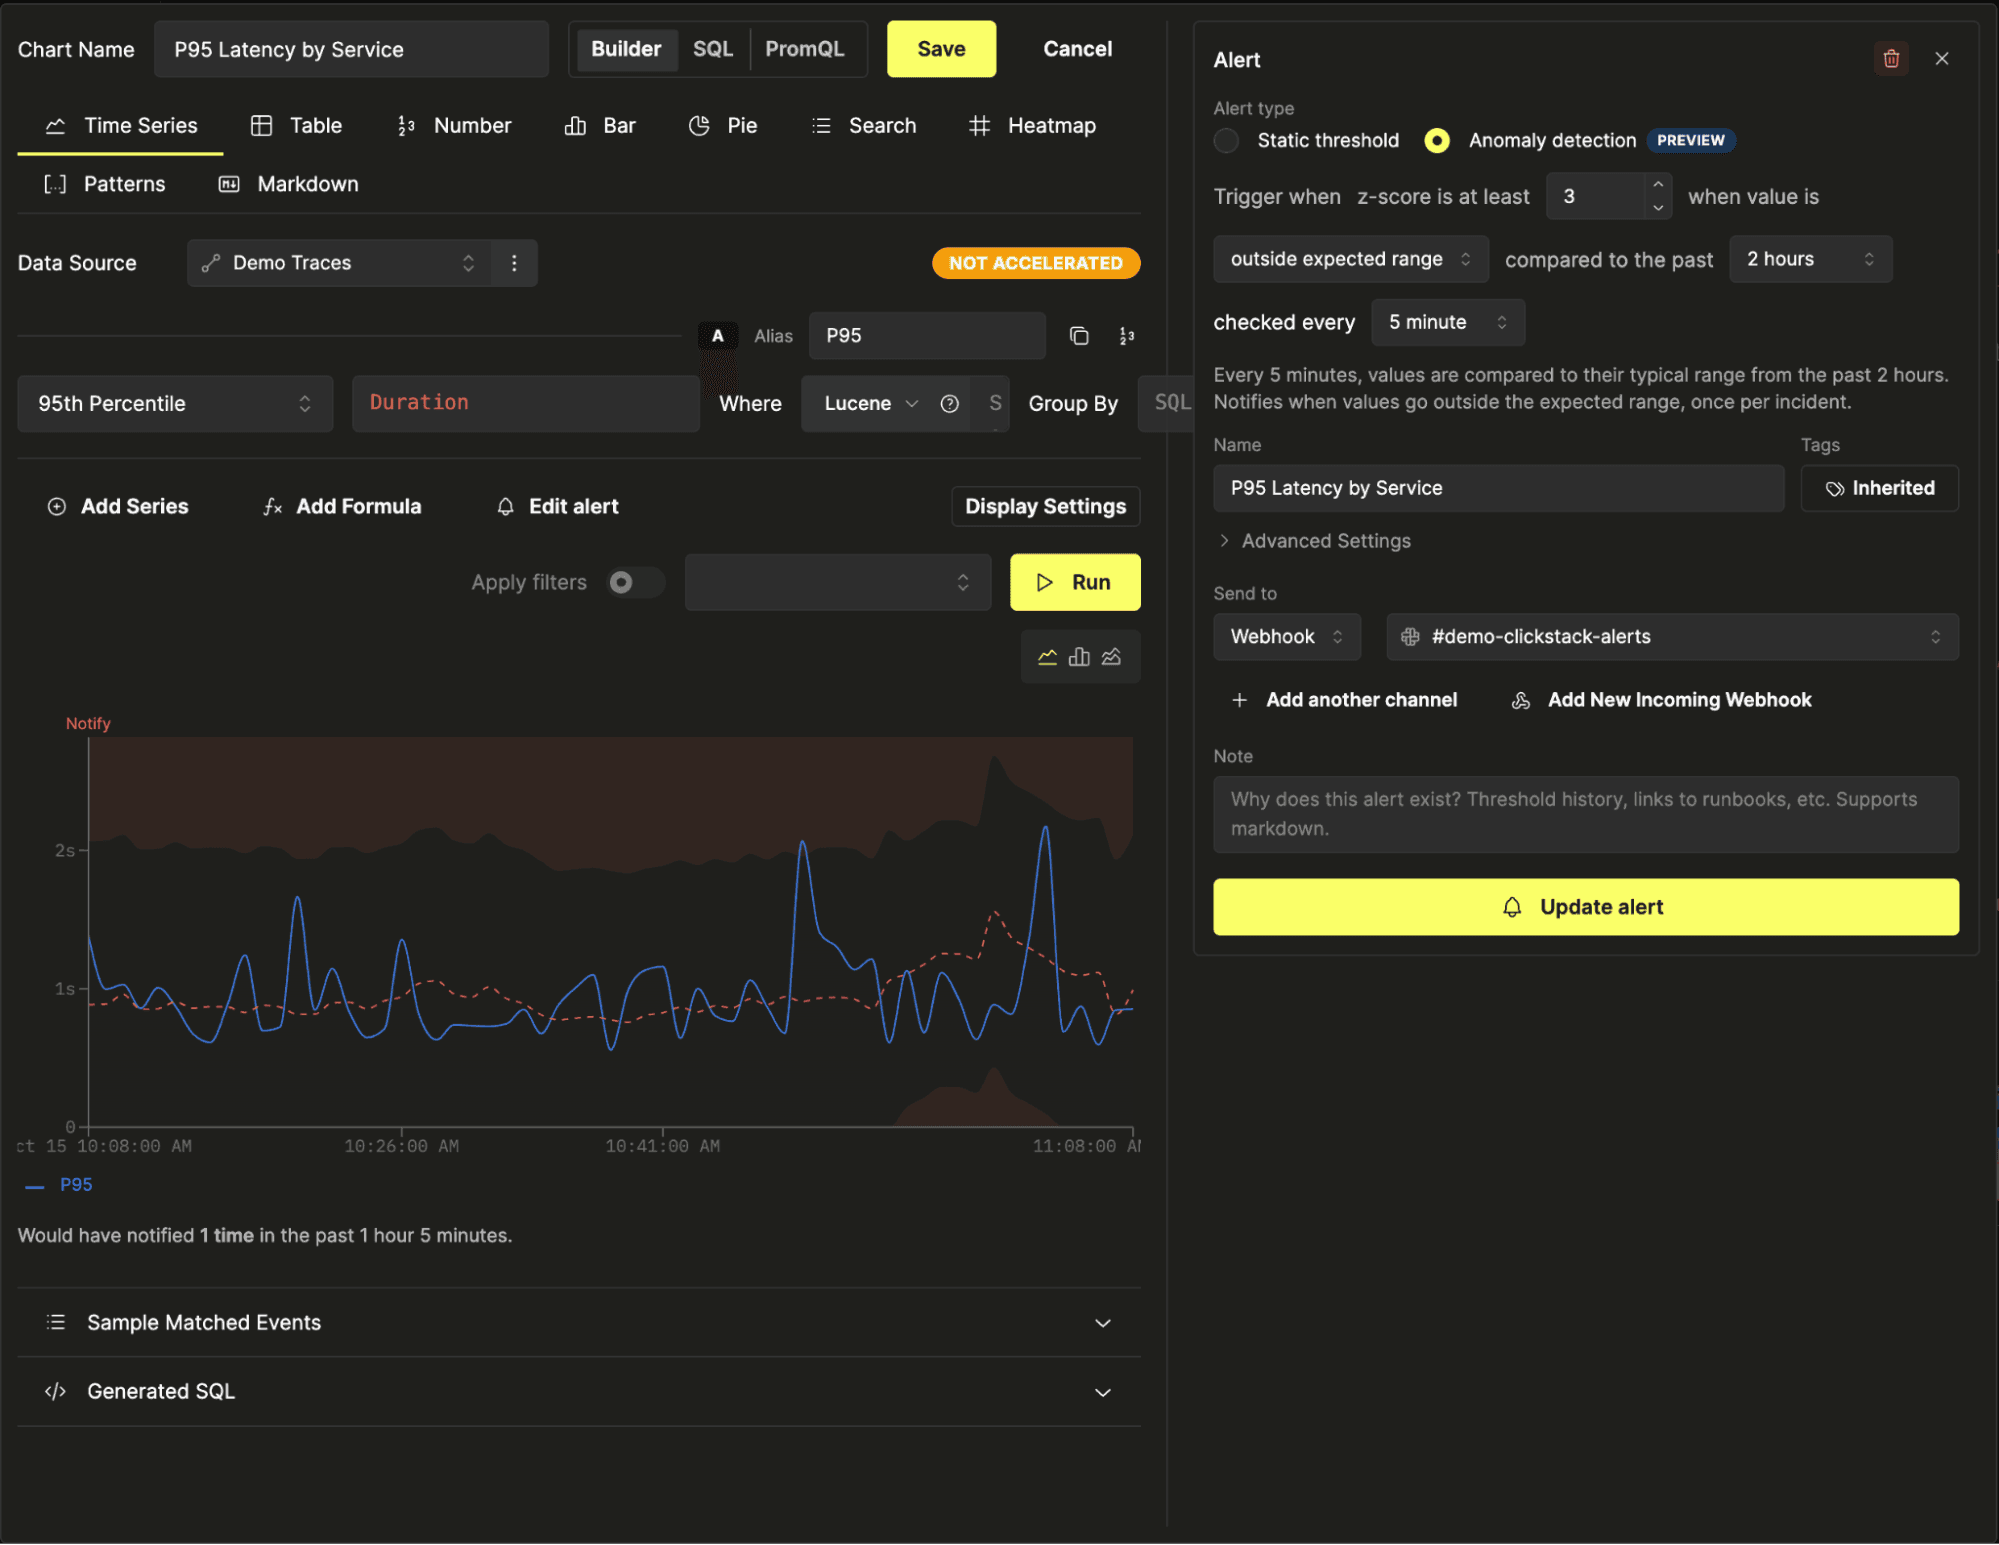
Choosing the right sensitivity still depends on the data. We wanted users to see what their configuration would do before saving it, so the editor includes a preview covering the previous 24 hours. The chart shows the expected range and marks where notifications would have been sent. As you adjust the sensitivity, the preview updates, allowing you to check whether the alert catches the spikes you care about and how often it would have fired during otherwise normal behavior.
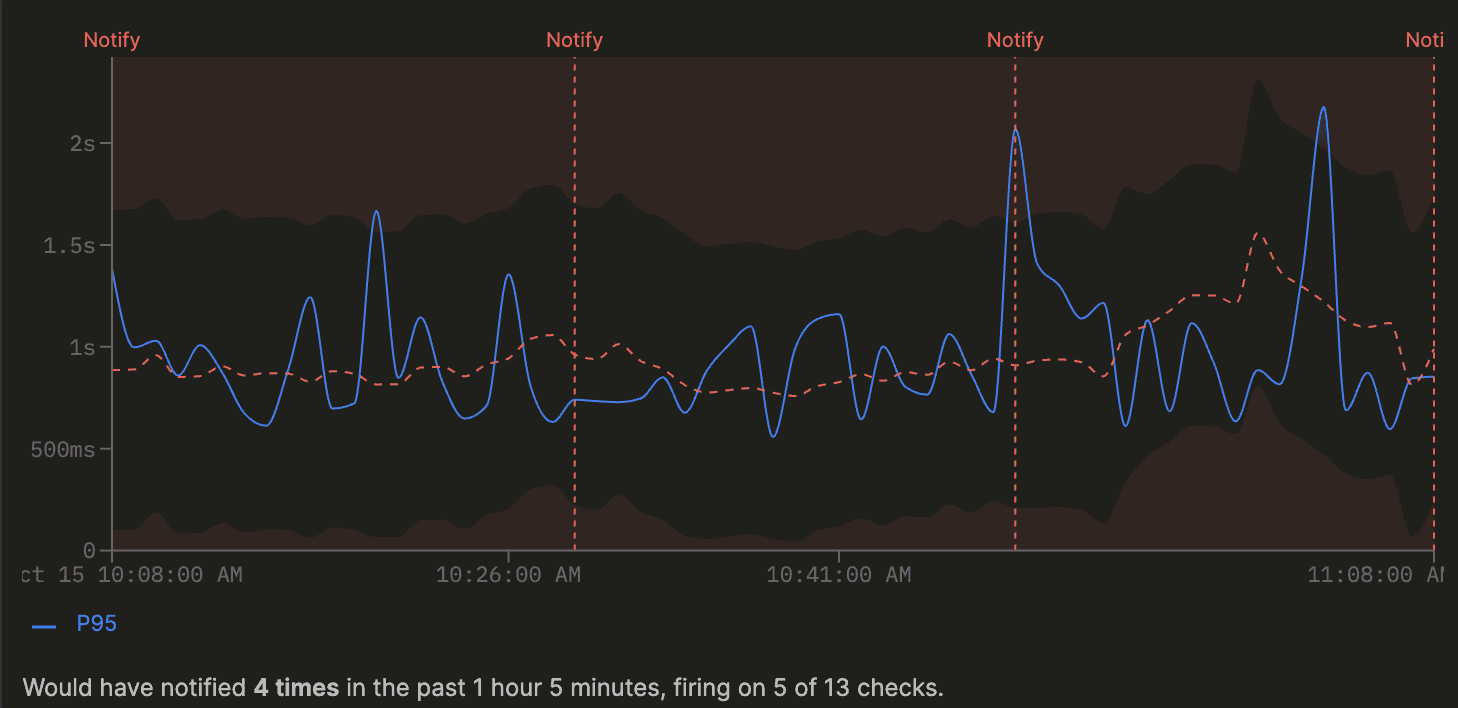
This first implementation is intended to catch sudden deviations from recent behavior. A gradual deterioration can go undetected as the baseline follows it. A sustained problem can also become part of the expected range, allowing the alert to resolve while the problem persists. Recurring daily and weekly patterns also need a different treatment. We intend to address these limitations in subsequent releases, including adding support for seasonality. Finally, we'd still recommend using static threshold alerts for persistent limits, such as an error rate that must stay below 1%.
Scaling alerting in ClickStack
We've seen strong adoption of Managed ClickStack over the past few months, particularly among teams seeking the lowest possible unit costs for observability at scale. These large deployments often bring tens of thousands of existing alerts. Supporting those customers means ensuring the alerting framework can keep up as both the number of alerts and the frequency of evaluation increases.
When customers had large numbers of alerts, the scheduler could take longer to evaluate them all than the time available before the next scheduled run. A backfill mechanism later would check any skipped evaluation windows, but this meant problems could be detected late. These workloads helped us identify where the scheduler needed to improve.
The alert queries themselves would execute quickly in ClickHouse. Much of the time was spent loading alert configurations and waiting for connections. Before evaluation could even begin, the scheduler had to look up saved searches, dashboard tiles, and their associated data sources. These lookups ran sequentially, often fetching the same information repeatedly for alerts that shared a dashboard or source.
To address this, we’ve changed the scheduler to load the full configuration only for alerts that are due, performing these lookups concurrently, and reusing shared metadata within each run.
Writing the results had a similar problem. Each alert produced separate database writes, adding unnecessary writes. We now write these results in batches, reducing the number of database operations. We’ve also increased the ClickHouse connection pool and bounded the evaluation queue, so the scheduler controls how much work it submits at once.
Notifications introduced another source of delay. Previously, evaluation waited for webhook delivery, so a slow notification endpoint could hold up the scheduler. To address this, we’ve moved delivery into a background queue. Notifications for a given alert retain their order, while evaluation can continue without waiting for Slack or another destination to respond.
These changes increased the amount of work a single alert worker could handle. To support this, we needed to distribute the work across multiple workers. This led us to introduce sharding of alert evaluation.
Each alert is assigned to a shard using a hash of its ID. Every worker uses the same assignment rule and evaluates the alerts belonging to its shard. With a stable shard count, each alert has one owner. Adding workers redistributes the alerts across more shards, allowing evaluation capacity to grow with the workload. The number of shards is automatically based on evaluation demand.
Frequency matters here: an alert checked every 30 seconds requires twice as many evaluations as one checked every minute. When the shard count changes, ownership moves between workers, and backfill covers evaluation windows missed during the transition.
With these improvements in place, we're confident that Managed ClickStack can support even the most demanding alerting workloads.
Managing alerts at scale
With the infrastructure in place to evaluate alerts at scale, we also needed to make those collections practical to manage. Users need to find the alerts relevant to their services and understand what has been firing. Over the past few months, we've shipped a series of incremental improvements to the alerts UI to support these workflows.
The first requirement was keeping the alerts page responsive as collections grew. The page now fetches alerts in batches of 100 and only renders the rows currently visible on screen. This allows users to browse large collections without loading and displaying every alert at once.
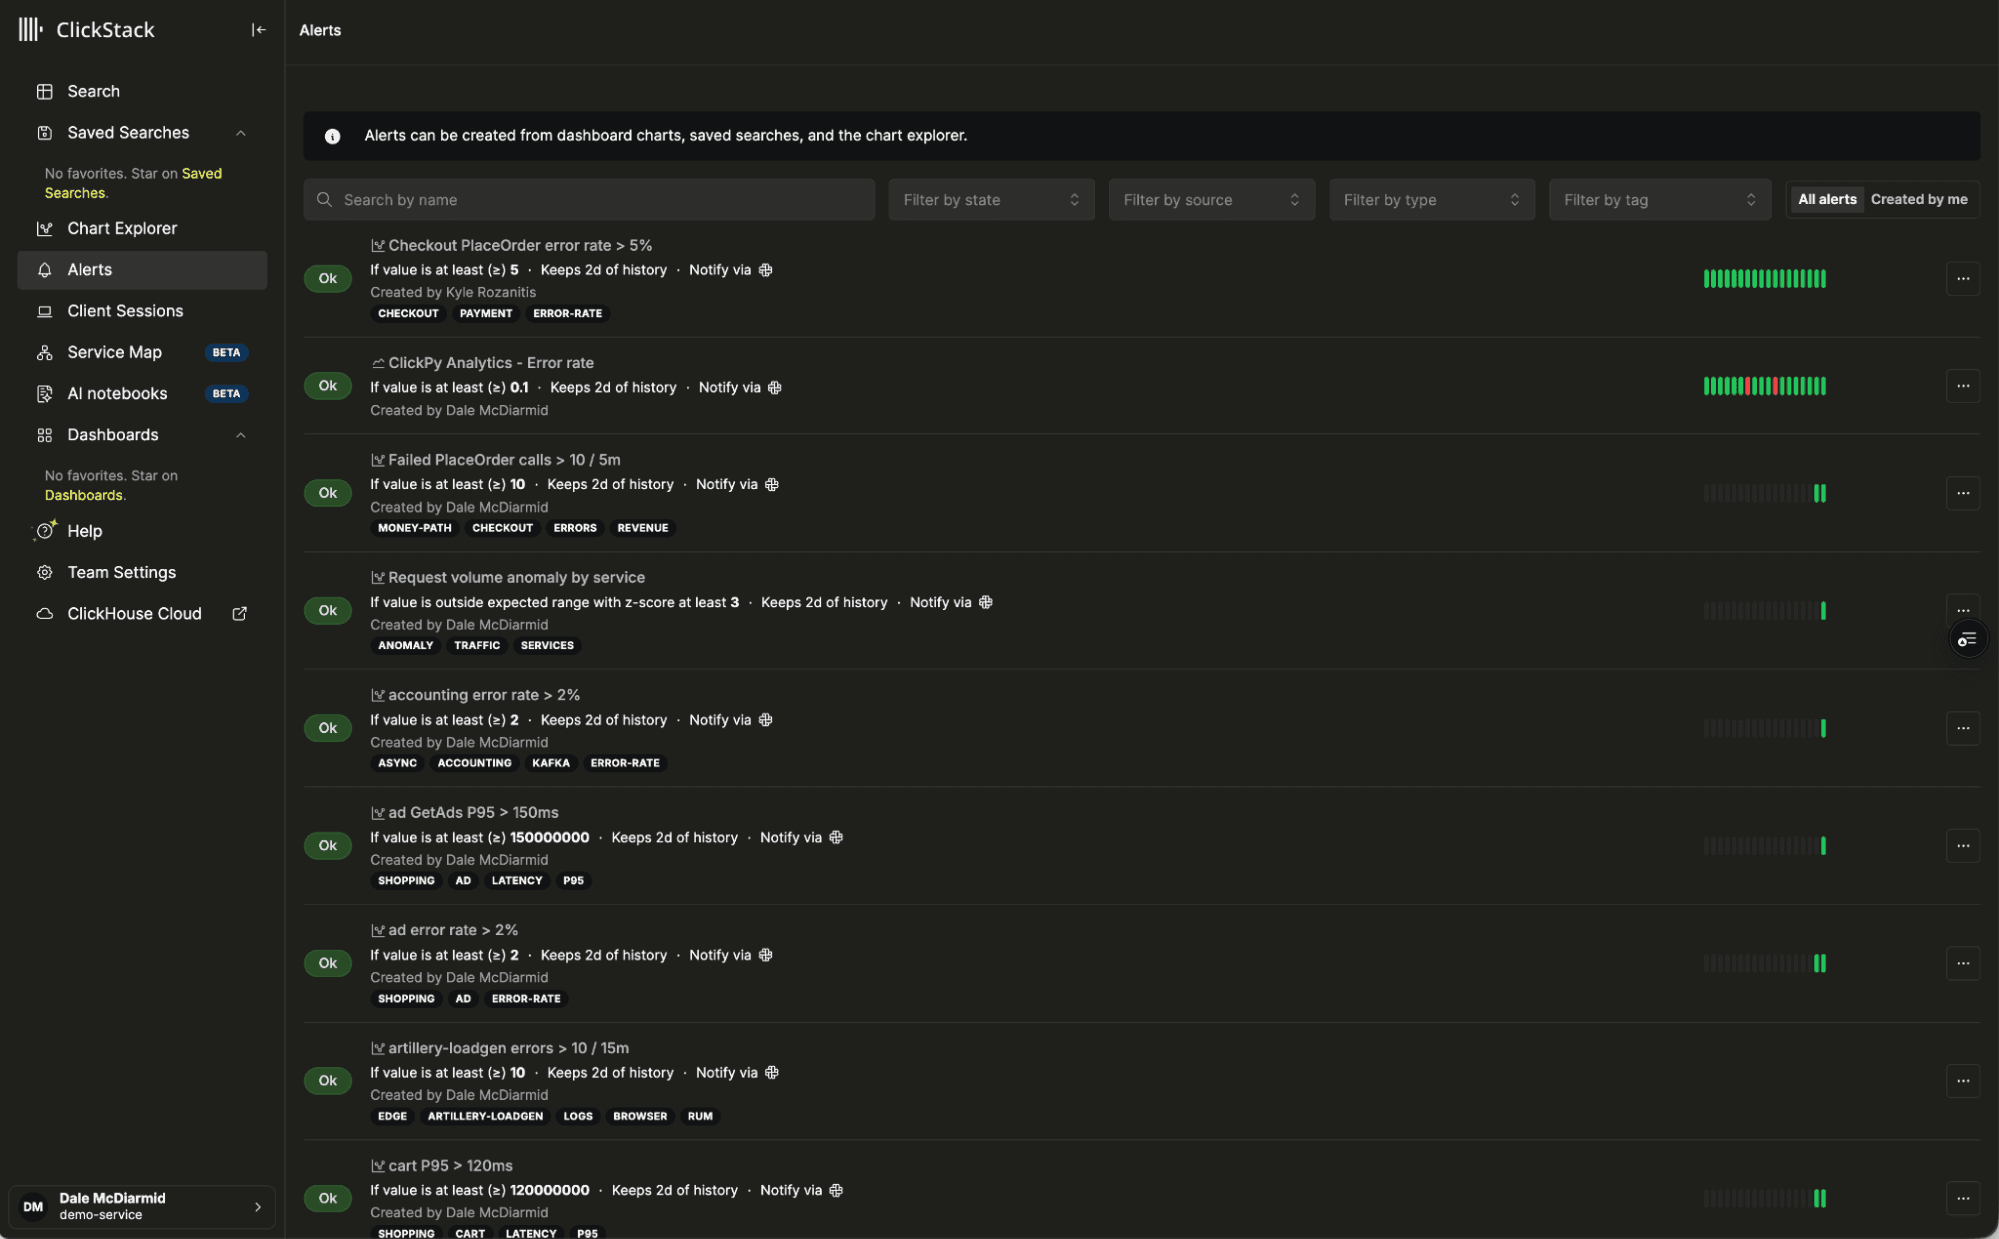
Finding a particular alert also becomes more difficult when there are tens of thousands to choose from. Alerts now have their own names and tags, which you can use to organize and search them independently of the saved search or dashboard chart they belong to. You can filter by state, source type, or whether an alert uses a static threshold or anomaly detection. There's also a filter for alerts you've created.
For example, a team could tag its alerts by service and environment, then filter the list to show only firing alerts for a particular production service. Filters are stored in the URL, so that the view can be bookmarked or shared with another team member.
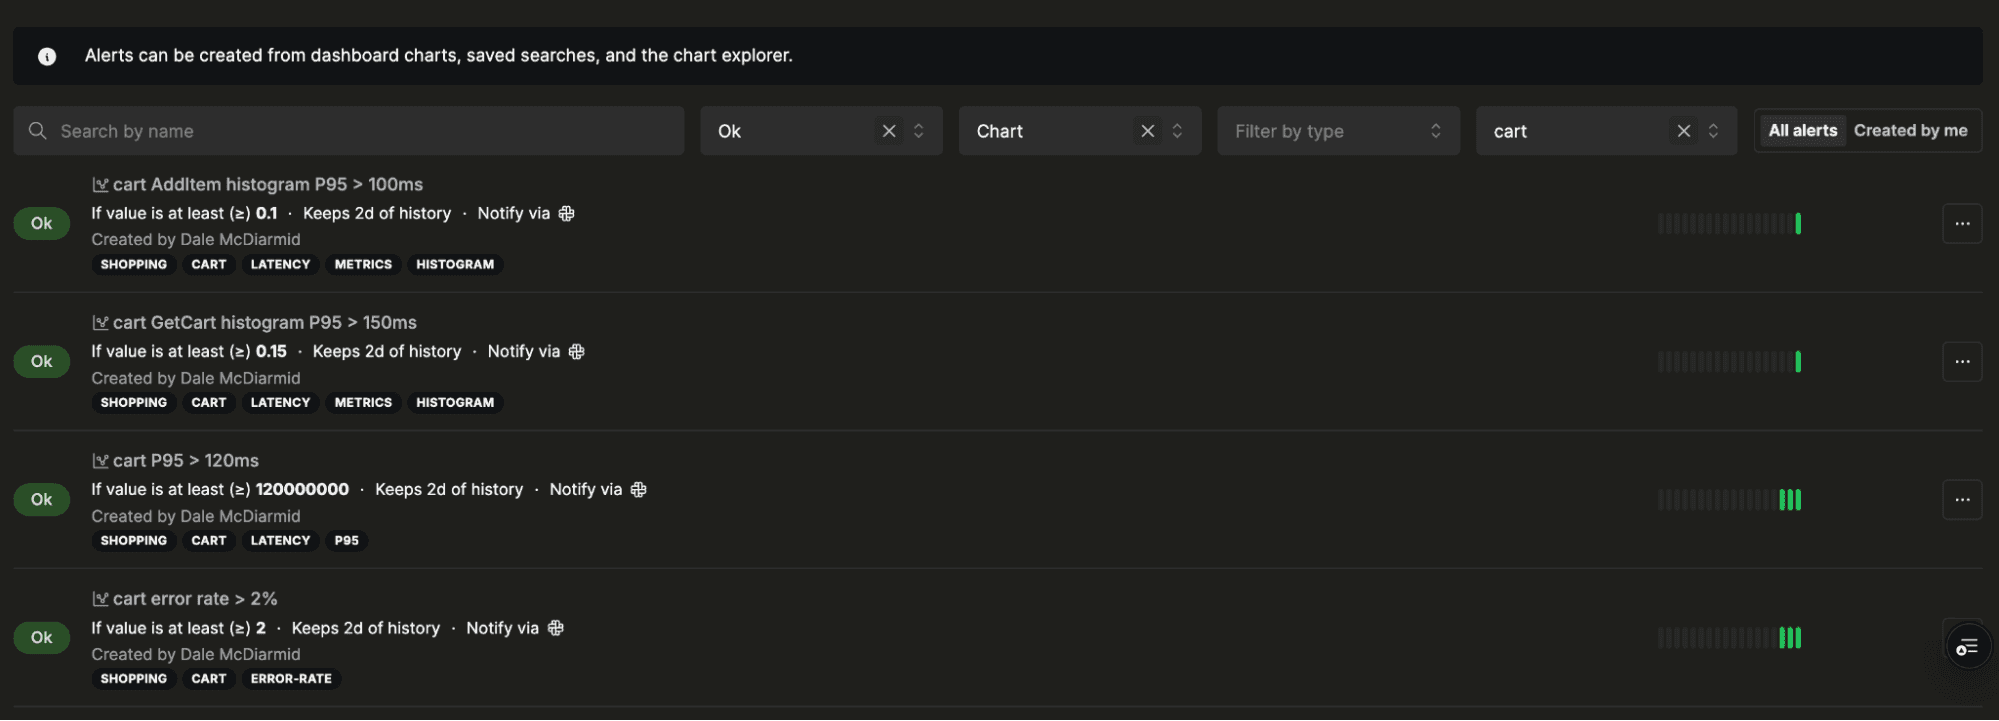
Once you've found an alert, its actions menu provides access to editing, opening the underlying source, exporting to Terraform, and deletion. Each row also shows all configured notification channels, making it easier to check where notifications are being sent. If you're already investigating an incident, you can acknowledge and silence the alert for a period ranging from 30 minutes to 24 hours.
We've also expanded the information available for individual alerts. Each alert has a detail page with its chart annotated to show when it fired and recovered. A strip of recent evaluation results provides a history alongside the chart, helping users see whether an alert has been firing continuously or moving repeatedly between states.
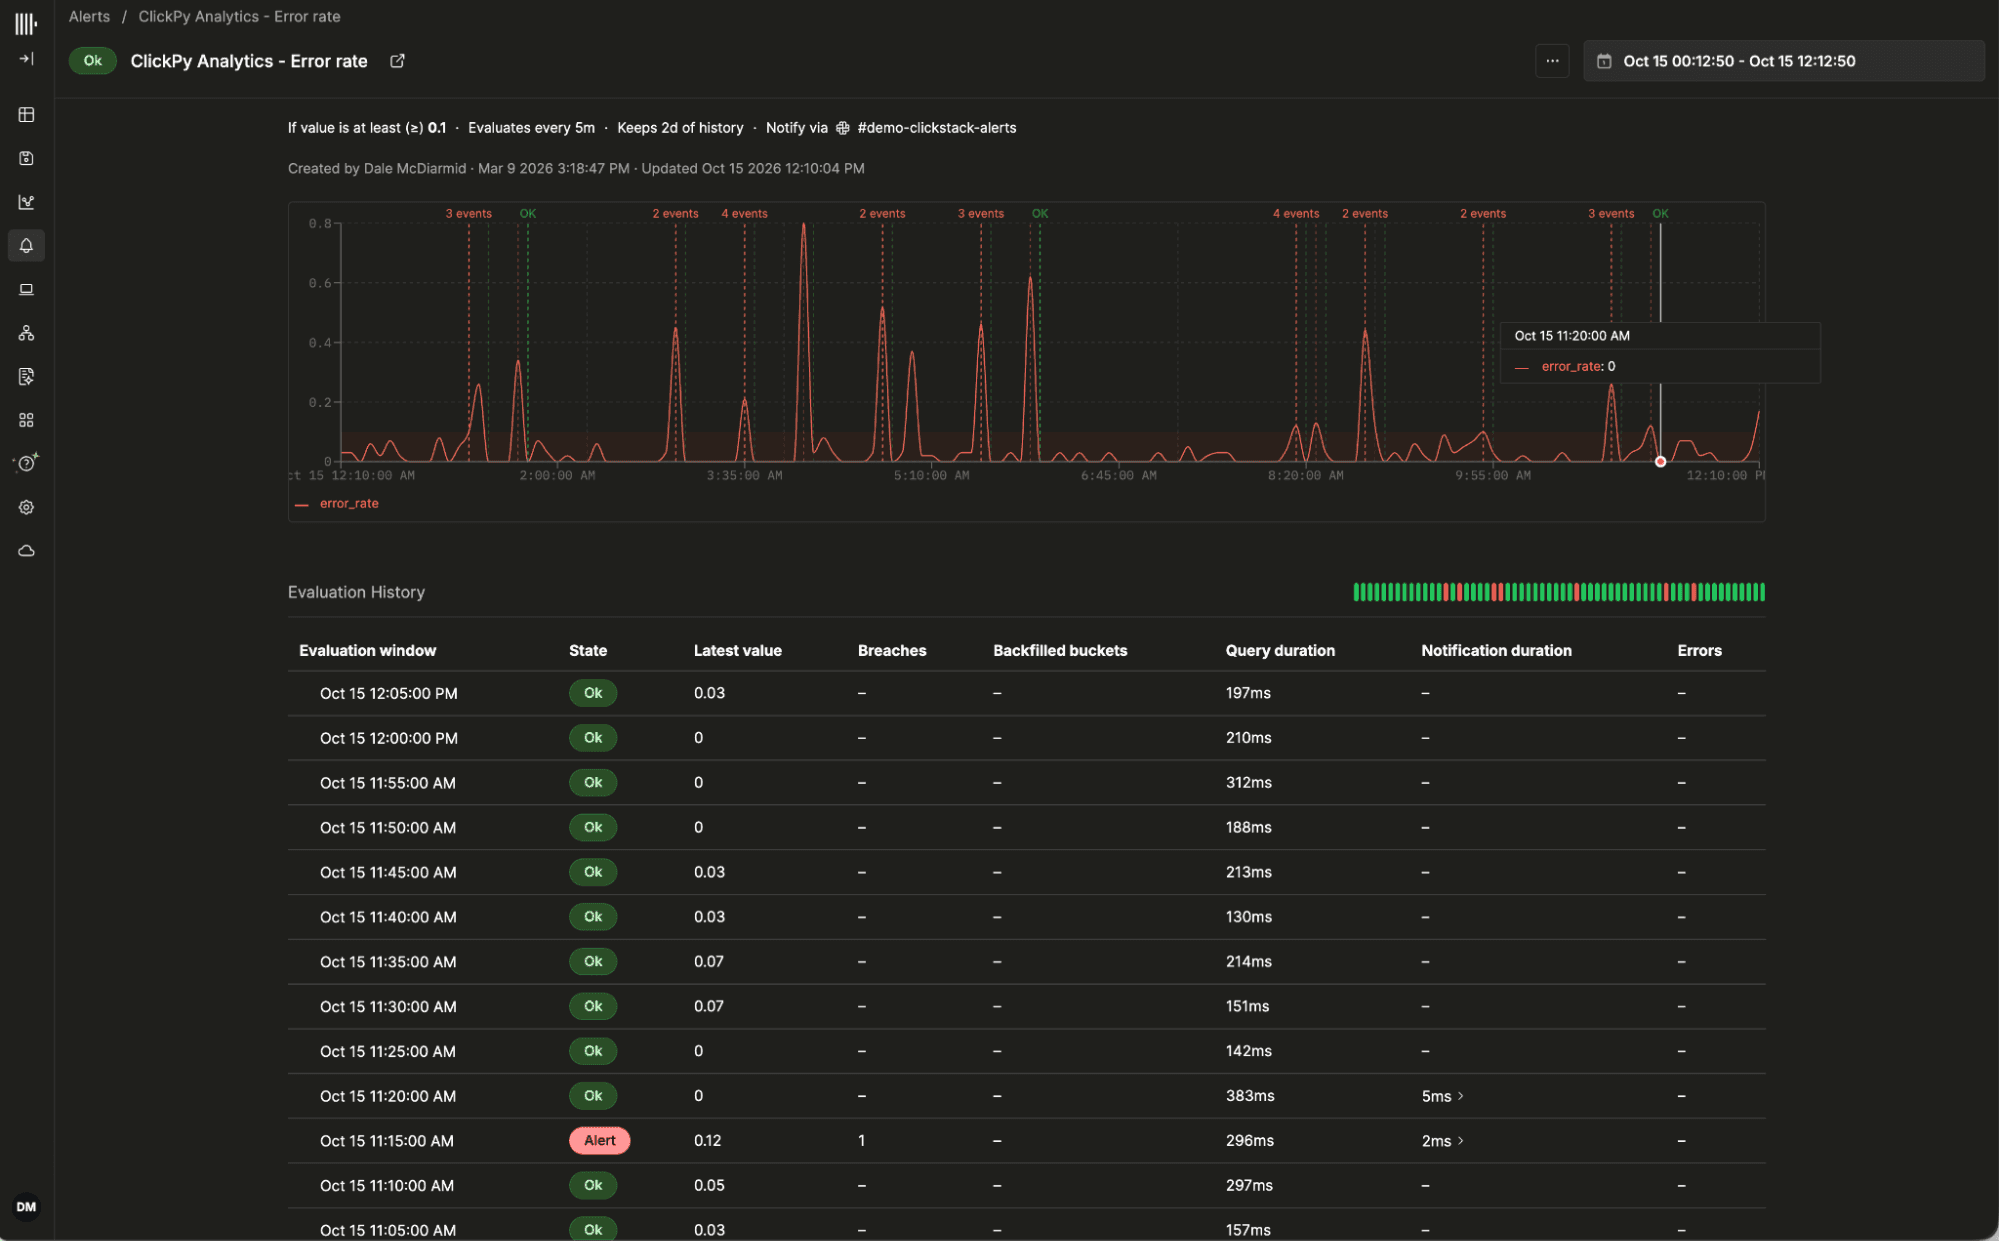
The evaluation table provides more detail when you need to investigate. It records the observed value and the number of series that were alerting, along with query and notification durations. It also shows errors and whether missed evaluation windows were backfilled. If an expected notification didn't arrive, you can check whether the query failed or timed out, or whether evaluation succeeded but notification delivery failed.
What comes next
With the alerting framework now able to support tens of thousands of alerts, we're confident we can take on more of the complex alerting requirements that teams commonly handle through tools such as Grafana.
Seasonality is the next step for anomaly detection. A service's normal behavior on a Monday morning can be very different from its behavior over the weekend. We plan to account for these recurring patterns by comparing values against baselines for the corresponding time of day or day of week. We'll also cache historical calculations to limit the additional query cost of these comparisons.
The original work also identified opportunities to improve detection for noisy data and low-volume services. We plan to explore estimates that are less sensitive to outliers, including median-based estimates and quantile bands. Error-rate alerts need particular care when traffic is low, since a handful of failed requests can produce a large percentage change. Models that account for request volume should help distinguish those fluctuations from changes worth investigating.
We also want to make these capabilities easier to configure, with simpler sensitivity presets and the option to create initial anomaly alerts automatically when telemetry is connected. We also plan to explore machine learning techniques where they can improve detection, while continuing to add capabilities in response to concrete customer requirements.
Following our announcement of PromQL and TimeSeries support, alerting on Prometheus metrics is another priority. The private preview covers storing and querying metrics, including charting them in ClickStack. Supporting alerting on PromQL queries is an important next step toward allowing users to move their primary metric alerting workloads into Managed ClickStack.
Stay tuned for further announcements over the coming months.
Get started today
Interested in seeing how ClickStack works on your data? Get started with Managed ClickStack in ClickHouse Cloud in minutes and receive $300 in free credits.
Sign up