50.3k
50.3k
Today, we're pleased to announce that bitdrift has officially joined House Mates as a mobile observability partner for ClickHouse, bringing mobile-native telemetry, tracing, and debugging to ClickStack.
ClickStack gives engineering teams an out-of-the-box observability solution built on ClickHouse that collects, stores, and queries observability data across backend services, web frontends (including session replay), and infrastructure. bitdrift extends that foundation to the mobile device, where many of the hardest production issues actually start.
Used together, ClickStack and bitdrift give engineering teams a continuous view, from what a user did on their phone to the backend services that handled the request.
What is ClickStack?
ClickStack is ClickHouse's open source observability stack. It has three core components:
- ClickHouse - the column-oriented database that stores and queries observability data.
- ClickStack UI (HyperDX) - the UI for searching, visualizing, correlating, and alerting on that data.
- OpenTelemetry collector, for standardized collection of logs, metrics, and traces, and receiving events over OpenTelemetry Protocol (OTLP).
ClickStack stores observability signals as rich, queryable events in ClickHouse. The columnar design and parallel query engine suit high-cardinality workloads like large volumes of distributed traces and application logs. Teams can correlate signals, inspect individual traces, build dashboards and alerts, and run fast searches across large datasets, all from one platform.
The observability stack is available as an open source deployment or as a managed offering on ClickHouse Cloud. Either way, telemetry comes in through the OpenTelemetry Collector using OTLP over HTTP or gRPC.
What is bitdrift?
bitdrift is a dynamic observability platform built specifically for mobile applications. It also has three core components:
- The Capture SDK, a lightweight library for iOS, Android, and React Native, built in Rust with thin platform-specific wrappers, that writes telemetry to a fixed-size ring buffer on the device rather than streaming it off immediately.
- The control plane, which maintains a persistent bidirectional connection to every client and pushes new configuration in real time, deciding what gets collected and what gets uploaded.
- The bitdrift platform, where workflows, session timelines, charts, issues, and alerts turn that mobile telemetry data into answers, accessible through the web UI, CLI, AI agents, and a public API.
bitdrift keeps mobile telemetry at the edge until it’s requested, uniquely allowing teams to query full session data on demand. Everything is captured on device and stored unsampled, so engineers can rewind the full session that led to a performance issue or crash, study user journeys and behavior, or dig into any other mobile observability question, instead of working from sampled datasets. bitdrift is designed for agentic control, allowing all instrumentation, investigation, and remediation for mobile to be driven by AI. As a result, bitdrift customers report lower mobile MTTR and fast discovery/diagnosis of performance and stability issues that other tools cannot find.
The bitdrift Capture platform is available as bitdrift-hosted SaaS or as a bring-your-own-cloud (or bucket) deployment in your AWS account.
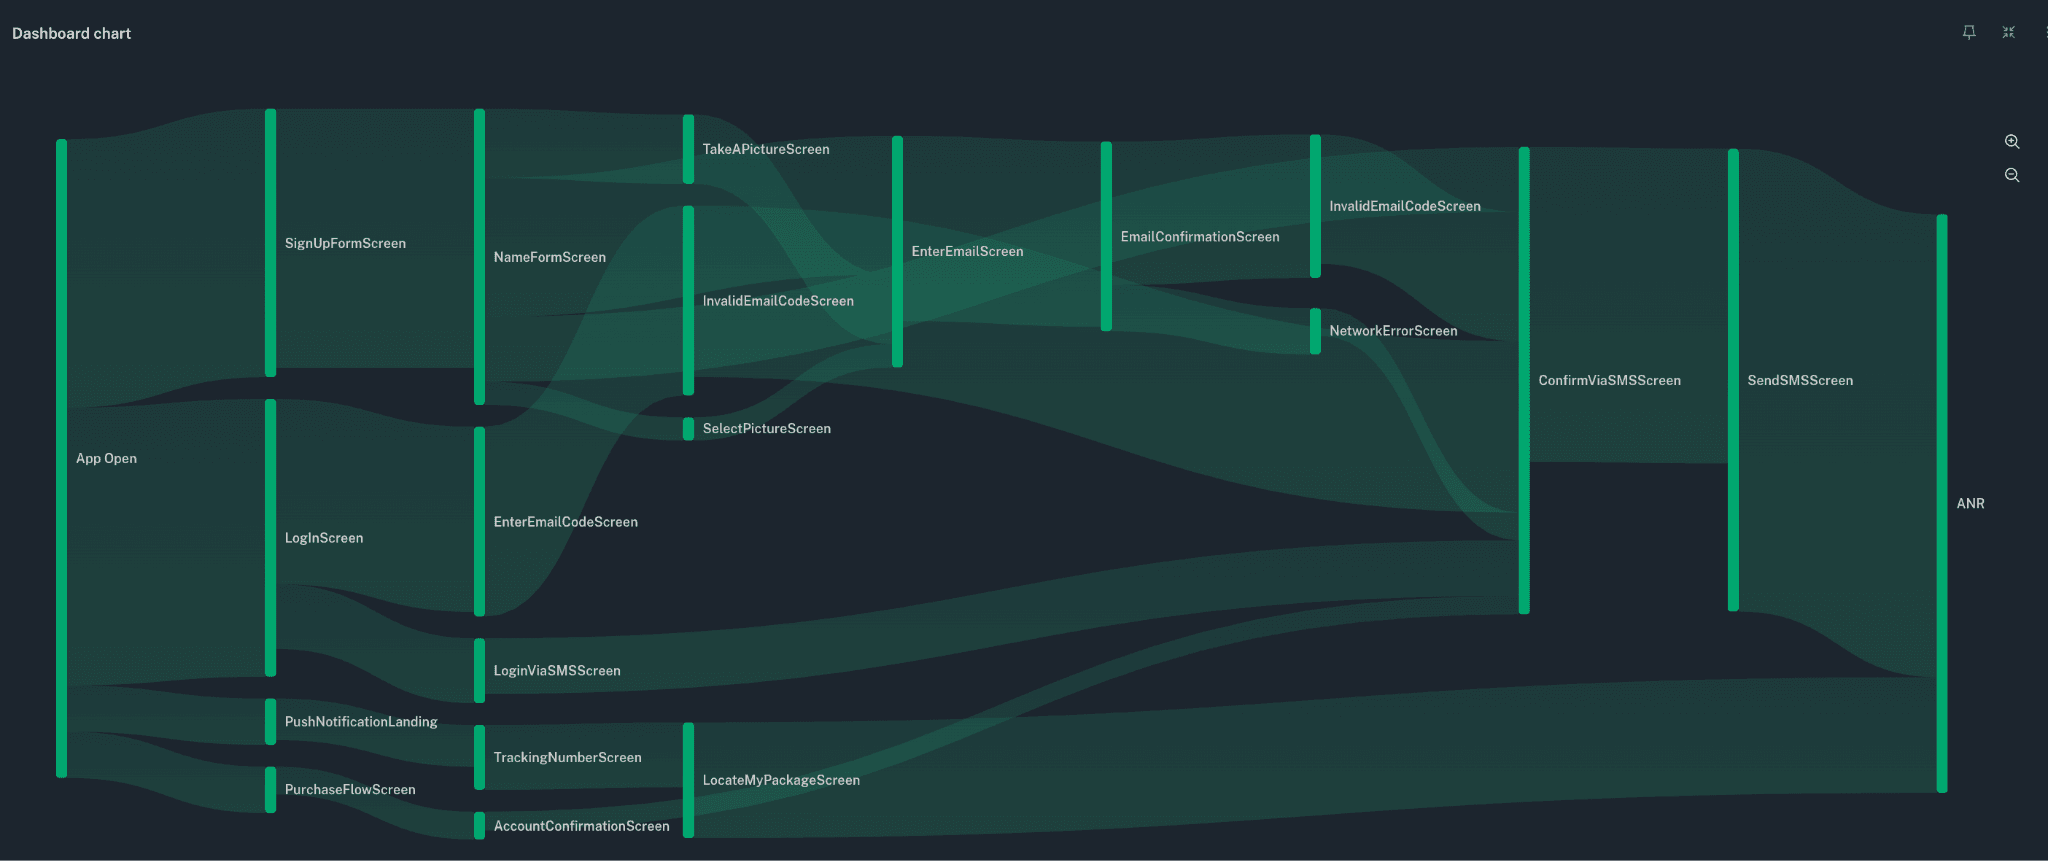
A bitdrift User Journey dashboard showing paths to an ANR
How bitdrift and ClickStack work together
The bitdrift and ClickStack integration can connect two views of the same production event through a shared trace ID:
- bitdrift shows what happened on the device: user actions, app state, network requests, logs, errors, crashes, performance signals, and the surrounding session context.
- ClickStack shows what happened once the request reached the backend: distributed traces, service dependencies, logs, metrics, database operations, and infrastructure behavior.
- OpenTelemetry trace context ties the two together.
An investigation might start with a failed checkout, a slow screen load, an auth error, or a crash in bitdrift. From the network request, an engineer follows the trace ID into the ClickStack UI, powered by HyperDX, and watches the request move across backend services.
No more lining up timestamps across two disconnected tools; go straight from the affected user experience to the backend path that produced it.
bitdrift Capture itself also makes heavy use of ClickHouse for event storage, allowing it to scale to billions of devices and making this integration a natural fit.
See mobile-to-backend tracing in action
In our demo, a mobile shopping app talks to the official OpenTelemetry Demo backend.
It starts with the mobile experience in bitdrift. From the session timeline, an engineer picks out the relevant network request and its trace ID. That context follows the request into the OpenTelemetry-instrumented backend, where the full distributed trace is available in the ClickStack UI.
The result is one continuous debugging path across the mobile client, APIs, backend services, and downstream dependencies, with no manual reconstruction from scattered timestamps.
Example mobile configuration for tracing
Setup varies by platform and by whether you self-manage ClickStack or run it on ClickHouse Cloud, but the overall process is straightforward.
On Android, enable bitdrift's OkHttp networking and tracing integrations:
import io.bitdrift.capture.network.okhttp.CaptureOkHttpEventListenerFactory
import io.bitdrift.capture.network.okhttp.CaptureOkHttpTracingInterceptor
import okhttp3.OkHttpClient
val client = OkHttpClient.Builder()
.addInterceptor(CaptureOkHttpTracingInterceptor())
.eventListenerFactory(CaptureOkHttpEventListenerFactory())
.build()On iOS, tracing runs through bitdrift's existing URLSession integration.
bitdrift timeline events and spans show a View Trace link that carries the captured trace ID into ClickStack.
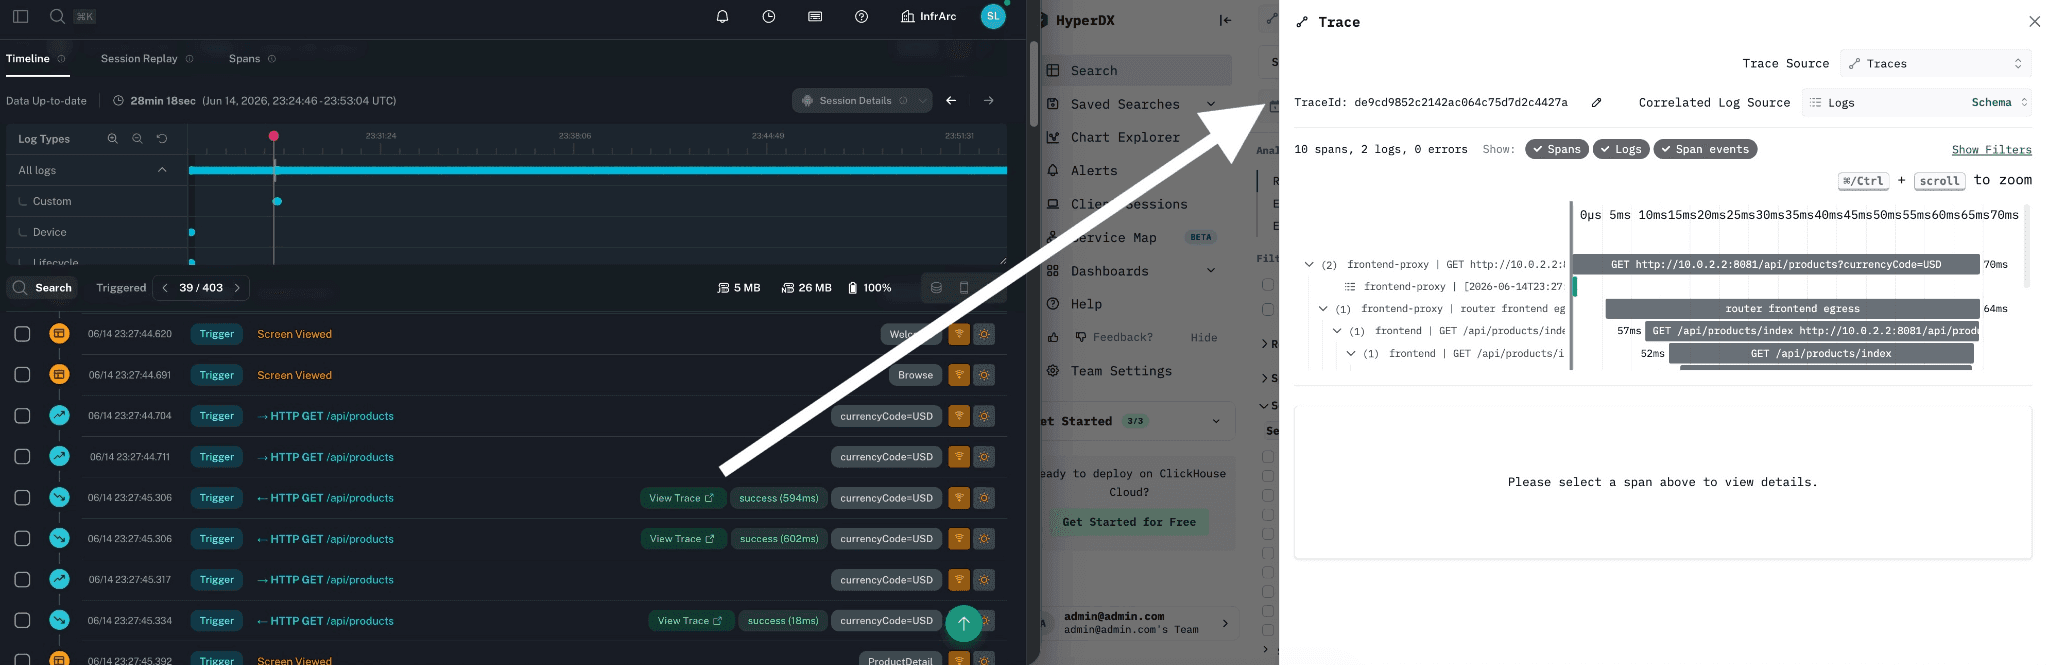
A bitdrift mobile request linking to ClickStack tracing
Closing the mobile observability gap with one connected view
Observability shouldn't start at the API gateway when the user's experience starts on a device. Most observability platforms were built around servers, containers, and short-lived backend requests, but mobile presents a different problem. A session can run for hours, move between networks, drop offline, hit device-specific resource limits, and generate far more diagnostic context than any app could stream continuously. Traditional mobile tools handle this by collecting a fixed set of signals and sampling away the rest. The catch? The session you need is usually the one that got dropped.
bitdrift Capture and ClickStack close that gap from both directions. On the device, bitdrift records rich telemetry locally and pulls the full session when something meaningful happens, so teams get complete mobile context without shipping every event from every device. Once a trace ID crosses into the backend, ClickStack’s columnar storage and OpenTelemetry-native design hold up under the high-cardinality, high-volume querying that distributed tracing demands. Neither half of the system is left guessing, and no part of the user journey has to be reconstructed from scattered timestamps or partial data.
bitdrift's mobile-native telemetry and selective tracing, paired with ClickStack's scalable OpenTelemetry backend, let teams investigate production issues from the user's device all the way through their distributed systems. Together, it brings true mobile-to-backend observability to ClickStack users.
Interested in connecting mobile and backend observability? Contact us to book a demo of the bitdrift and ClickStack integration.
Learn more:
- Check out the bitdrift sandbox to see what working with Capture is like.
- Start a free trial to dive right into the product.
- Check out the new documentation for more details on the integration between bitdrift and ClickHouse.
Frequently asked questions
How can I get mobile observability on ClickHouse?
bitdrift is a mobile observability integration partner, bringing mobile-native telemetry, tracing, and debugging to ClickStack. Teams add the bitdrift Capture SDK to their iOS, Android, or React Native app, and mobile requests correlate with backend traces in ClickStack through OpenTelemetry trace context, whether ClickStack is self-managed or run on ClickHouse Cloud. This gives engineering teams one continuous view from a user's mobile session through the backend services that handled the request.
How does mobile tracing work between bitdrift and ClickStack?
bitdrift adds W3C other tracing headers to mobile network requests and presents the resulting trace IDs in the mobile user’s session timeline. Engineers can follow a trace ID from a bitdrift session directly into the ClickStack UI (powered by HyperDX), where the full backend trace is available. This removes the need to manually line up timestamps across separate mobile and backend tools.
Do I need to change my ClickStack deployment to use bitdrift?
No. The integration works whether ClickStack is self-managed or run as a managed offering on ClickHouse Cloud. Telemetry from bitdrift reaches the same OpenTelemetry Collector that ClickStack already uses.
What mobile platforms does bitdrift support for tracing?
bitdrift's Capture SDK supports iOS, Android, and React Native. On Android, tracing is enabled through bitdrift's OkHttp integrations (CaptureOkHttpTracingInterceptor and CaptureOkHttpEventListenerFactory). On iOS, tracing runs through bitdrift's existing URLSession integration. Both links capture trace IDs into ClickStack via a View Trace link on bitdrift timeline events and spans.